


The ODX Range
The ODX Range provides guideposts along an individual’s path toward dysfunction or health. It is essential to evaluate those guideposts and adjust healthcare, true healthcare, accordingly.
The ODX Range aims to identify trends toward metabolic dysfunction early enough in the disease process to reverse the disease process.
The ODX Range assesses an individual’s biochemistry, physiology, metabolism, and risk of chronic disease. It evaluates early blood glucose dysregulation, cardiovascular inflammation, atherosclerosis risk, thyroid dysfunction, acid-base balance, immune dysfunction, etc. The range identifies historical trends for individual biomarkers and biomarker patterns associated with specific body systems and functions.
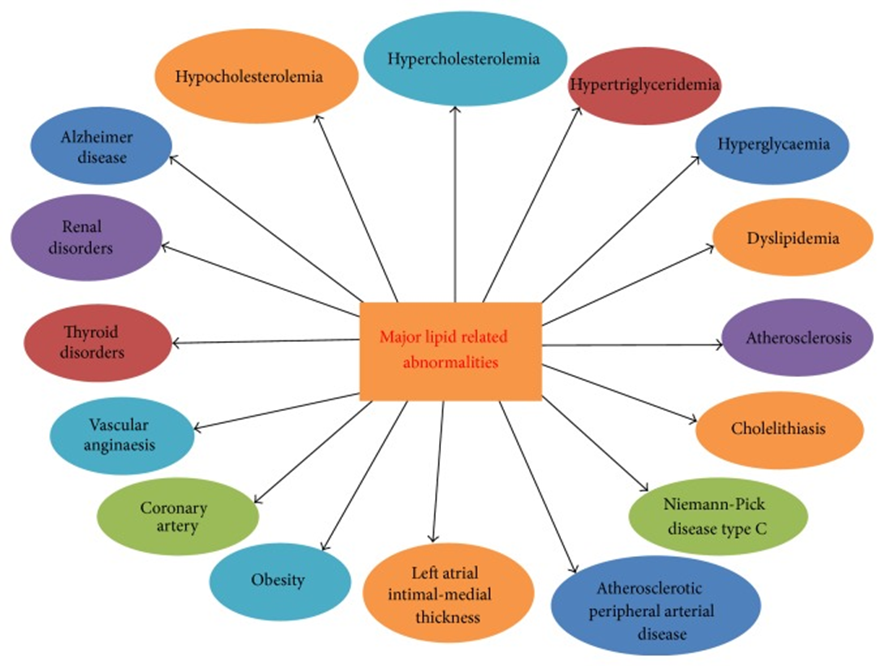
Upadhyay, Ravi Kant. “Emerging risk biomarkers in cardiovascular diseases and disorders.” Journal of lipids vol. 2015 (2015): 971453. doi:10.1155/2015/971453. This is an open access article distributed under the Creative Commons Attribution License, which permits unrestricted use, distribution, and reproduction in any medium, provided the original work is properly cited.
The ODX Range can help detect progression toward:
- Acid-Base Imbalance
- Cardiovascular disease
- Diabetes
- Endothelial dysfunction
- Inflammation
- Insulin resistance
- Metabolic syndrome
- Nutrient insufficiency
- Thyroid disease
- Etc.
Conventional Lab Ranges
Conventional lab ranges, on the other hand, are designed to identify dysfunction once it has occurred and likely progressed to disease. Unlike optimal ranges, they do not address subclinical disease, latent nutrient or enzyme deficiencies, or imbalances. The conventional ranges reflect the average distribution of values in a geographic population but not necessarily normal physiology.
A standard reference interval is based on a reference population with similar characteristics (e.g., age, gender, health status, race). Results from a set number of people, at least 120 subjects, are analyzed, and “typical” results are determined based on the middle 95% of that population (Testing.com 2021). Researchers recognize that some test subjects may have subclinical diseases but are still deemed “healthy” (Katayev 2010).
Standard reference intervals may become so broad that they lose clinical relevance as they miss early signs of dysfunction and sub-clinical disease. It is recommended that the literature be reviewed regularly to determine updated or relevant guidelines for determining reference intervals beyond a simple statistical derivation (jones 2008).
Optimal Levels Translate into Optimal Health
Below are a few examples illustrating the value of using the ODX Range to determine optimal biomarker ranges.
Fasting Glucose
Conventional Lab Range: 65 - 99 mg/dL (3.6 - 5.5 mmol/L)
The ODX Range: 75 - 86 mg/dL (4.2 - 4.8 mmol/L)
Recognition of elevated blood glucose as a cardiovascular risk factor has been documented in the literature for decades. However, its importance has been overlooked by conventional range advocates.
Earlier research from 1999 revealed that fasting glucose above 85 mg/dL (4.7 mmol/L) is associated with health risks, including an increased risk of cardiovascular disease and myocardial infarction. A 22-year follow-up study of healthy non-diabetic men demonstrated the importance of considering optimal versus conventional ranges (Bjørnholt 1999).
The prospective study, published in Diabetes Care in 1999, revealed that those with a fasting blood glucose of 86-109 mg/dL (4.8–6 mmol/L) had a “significantly higher mortality rate from cardiovascular diseases compared to the three lowest quartiles... even after adjusting for age, smoking habits, serum lipids, blood pressure, forced expiratory volume in 1 s, and physical fitness.”
20 years later…
A 2019 study of 19,630 individuals assessing Long-term Absolute Risk for Cardiovascular Disease Stratified by Fasting Glucose Level revealed the risk associated with “normal” fasting glucose levels (Bancks 2019):
- Participants had no history of a prior CVD event
- Incidence for each CVD endpoint was lowest among those with a fasting blood glucose of less than 90 mg/dL (<5.0 mmol/L) and highest among those meeting the criteria for diabetes.
- Conversion of prediabetes to diabetes was associated with a 1.3 - 3.6-fold increased cardiovascular risk, including coronary heart disease and stroke
Homocysteine
Conventional Lab Range: 0.00 - 10.30 umol/L
The ODX Range: 5.0 - 7.2 umol/L
Elevated homocysteine is considered an independent risk factor for all-cause mortality, cardiovascular mortality, and shortened telomeres. It impairs antioxidant systems and increases oxidative stress and inflammation in vital tissues such as the heart, brain, and liver, contributing to their pathology.
Analysis of the Ludwigshafen Risk and Cardiovascular Health Study revealed that mortality increased significantly as serum homocysteine rose above 9.8 umol/L, even when adjusted for antioxidants vitamin C and alpha- and gamma-tocopherol. Individuals with homocysteine below 9.8 umol/L had significantly lower hs-CRP and IL-6 and significantly longer telomeres. Homocysteine may also be a marker of B6, B12, and folate status (Pusceddu 2020).
Data analyzed from the NHANES III studies suggest that when the highest and lowest quintiles of homocysteine were compared (11.5-98.1 versus 3-6.4 umol/L), the risk of hypertension increased twofold for men and threefold for women with higher homocysteine (Lim 2002).
Ideally, homocysteine should be maintained below 7 umol/L, a level associated with improved cardiovascular function and reduced risk of atherosclerosis and stroke (Travica 2015). However, very low homocysteine may have consequences as well. Under normal metabolic conditions, homocysteine serves as a methyl transfer molecule, sulfur depot, and source of cysteine for glutathione synthesis. Suboptimal homocysteine may compromise glutathione status, facilitate increased oxidative stress, and contribute to pathology such as peripheral neuropathy (Pizzorno 2014).
Ironically, some medical insurance companies consider homocysteine “experimental and investigational” and don’t cover its assessment as a benefit (CVD Risk Tests).
Magnesium
Conventional Lab Range: 1.50 - 2.50 mg/dL (0.62 - 1.04 mmol/L)
The ODX Range: 2.20 - 2.50 mg/dL (0.91 - 1.04 mmol/L)
Accurate assessment of magnesium status is another prime example of where conventional lab ranges can fall short. Magnesium is an essential mineral most organs require for various metabolic functions. Its insufficiency contributes to hypertension, atherosclerosis, cardiovascular disease, insulin resistance, type 2 diabetes, neurological dysfunction, osteoporosis, low-grade inflammation, and electrolyte imbalance, among other dysfunctions (Kostov 2018).
Magnesium insufficiency may be subtle but widespread, as less than half of the population in the United States consumes adequate magnesium. Not surprisingly, subclinical magnesium deficiency was suspected even at “acceptable” serum magnesium levels of 1.82 - 2.3 mg/dL (0.75–0.95 mmol/L) based on 1974 NHANES I data (Costello 2016).
Unfortunately, some standard lab ranges for magnesium currently have an even lower acceptable cut-off, making it more challenging to identify suboptimal status:
- Quest Diagnostics: 5 - 2.5 mg/dL (0.62 – 1.03 mmol/L)
- Labcorp: 6 - 2.3 mg/dL (0.66 – 0.95 mmol/L)
- Mosby’s: 3 - 2.1 mg/dL (0.53 – 0.86 mmol/L)
- Merck Manual: 8 to 2.6 mg/dL (0.74 to 1.07 mmol/L)
Researchers suggest magnesium deficiency is likely with serum magnesium of less than 2 mg/dL (0.82 mmol/L), especially with decreased urinary magnesium. A urinary magnesium of 40-80 mg/day reflects an intake of less than 250 mg/day, while an excretion of 80-160 mg/day reflects an intake of more than 250 mg/day (Costello 2016).
Magnesium insufficiency is suspected in primary hypertension, the most common form of high blood pressure. A 2021 systematic review of the literature noted the cardiovascular benefits of magnesium supplementation (Rosanoff 2021):
- 240 mg/day or more successfully reduced blood pressure in uncontrolled medicated hypertensives.
- 600 mg/day or more was needed to reduce blood pressure in uncontrolled untreated hypertensives.
- Supplementation in normotensive subjects didn’t lower blood pressure further but significantly improved serum magnesium, lipoprotein levels, CRP, fasting glucose, insulin resistance, sodium excretion, and retinal vasospasm.
- The current US tolerable upper limit (UL) for supplemental magnesium was set at 350 mg/day based on limited evidence.
- The potential for mild diarrhea in a minority of subjects at levels of 360-380 mg/day prompted the limited UL.
- Exceedingly high doses of 5000 mg/day or more can cause serious side effects.
Omega-3 Index
Conventional Lab Range: 2.5 – 16%
The ODX Range: 8 – 16%
The Omega-3 Index is another biomarker for which the ODX Range is superior to conventional ranges for thoroughly assessing cardiovascular risk. The conventional range for some labs is still considered 1.4-4.9%, suggesting that CVD risk is lowest with an Omega-3 Index above 3.2% (Quest Omega-3 and 6 Fatty acids), although alternate interpretations suggest that low risk is associated with an Omega-3 Index of 5.5% or above (Quest OmegaCheck).
However, research suggests that an Omega-3 Index of at least 8% and above must be achieved to significantly reduce cardiovascular risk, especially the risk of sudden cardiac death.
The Omega-3 index (O3I) reflects the amount of long-chain omega-3 eicosapentaenoic acid (EPA) and docosahexaenoic (DHA) in red blood cell membranes or the phospholipid portion of plasma. The index also reflects EPA and DHA in cardiac and gastrointestinal tissues. It is a valid biomarker for cardiovascular risk, especially sudden cardiac death (Von Schacky 2019, Harris 2008, Gurzell 2014). The index also reflects omega-3 intake and compliance with intake recommendations (Harris 2013).
Omega-3 fatty acids support the integrity and function of red blood cells. A low O3I is associated with compromised cell membrane fluidity and flexibility and an elevated red cell distribution width (RDW). Elevated RDW is a potential marker of inflammation and increased risk of death from cardiovascular disease, lung disease, COVID-19, sepsis, and cancer. In one cross-sectional analysis of 25,485 adults, O3I was significantly inversely associated with RDW. A low O3I and an elevated RDW increase the risk of red blood cell dysfunction and cardiovascular disease. Researchers recommend an O3I above 5.6% to help maintain a healthy RDW, partly by improving antioxidant stability and red cell fluidity and flexibility (McBurney 2022).
The O3I is also inversely associated with neutrophil-lymphocyte ratio (NLR), a marker of systemic inflammation. A low O3I and elevated NLR are associated with an increased risk of chronic disease, including cardiovascular disease and cancer. An O3I above 6.6% was associated with a desirable NLR in a study of 28,871 healthy individuals (McBurney 2022 NLR).
“A low Omega-3 Index fulfills the current criteria for a novel cardiovascular risk factor.” An O3I above 8% is a reasonable therapeutic target to reduce the risk of cardiovascular and inflammatory disorders. An index of 4-8% may be considered intermediate risk, while below 4% is high risk (Harris 2008). A review of the literature conducted in 2014 found that a mean O3I below 8% correlated with an increased risk of CVD (with an O3I of 7.1%), myocardial infarction (O3I 4.88-6.08%), major depression (O3I 2.9%), severe sleep apnea (O3I 4%), and diabetes with an O3I of 3.47% (Von Schacky 2014).
A 2017 meta-analysis of 10 cohort studies revealed that the risk of fatal coronary heart disease was significantly reduced by 15% for every standard deviation increase in the O3I. Dose-response research suggests that increasing EPA and DHA intake by 1.5 grams daily will increase the index by 4%. Researchers confirm that an index below 4% is high risk, while an index above 8% is desirable, with ranges from 8-12% observed in clinical research (Harris 2017). The Physicians’ Health Study revealed an 81% reduced risk of sudden death from cardiac causes when the Omega-3 Index was above 4.98%. The highest risk was associated with an O3I below 3.45% (Superko 2013).
Thyroid Stimulating Hormone (TSH)
Conventional Lab Range: 0.40 – 4.50 uU/mL
The ODX Range: 1.00 – 2.00 uU/mL
Thyroid-stimulating hormone is considered a sensitive screening marker for thyroid dysfunction as long as pituitary and hypothalamus functions are normal (Pirahanchi 2020).
Clinicians may be surprised that the historic upper range for TSH was once 10 uU/mL before being lowered to 4.5. As research progressed, it was recognized that TSH between 4.5-9.9 uU/mL (mU/L), previously accepted as “normal,” was associated with dyslipidemia, vascular alterations, and diastolic dysfunction in young and middle-aged subjects (Biondi 2013).
Fortunately, evaluating TSH in terms of optimal ranges is becoming more mainstream. While the “normal” reference interval for TSH for a non-pregnant adult is 0.45−4.5 uU/mL, therapeutic targets range from 0.3- 3.0 uU/mL, reinforcing the value of a more optimal range (Labcorp). Even the National Academy of Clinical Biochemists (NACB) recognizes that 95% of subjects without indication of thyroid disease maintain a TSH below 2.5 uU/mL (Garber 2012).
Updated reproducibility studies confirm that a TSH of 0.44-3.19 uU/mL, rather than the conventional range, better reflects normal thyroid function (Katayev 2010). Further research suggests that a TSH of 2.5-4.5 uU/mL, in the upper end of conventional, was associated with obesity, hypertriglyceridemia, and increased metabolic syndrome risk (Ruhla 2010). Research also reveals that antithyroid antibodies are more prevalent when TSH levels rise above 2.5 uU/mL (Surks 2004). A TSH above 2.5 uU/mL has also been associated with depression as well, a syndrome that shares clinical characteristics with hypothyroidism (Talaei 2017).
Case studies demonstrate that classic hypothyroid symptoms may persist despite TSH within the conventional range, including a 2.65 uU/mL level. In one case, symptoms of dry skin, constipation, compromised thyroid function, and low energy were resolved, and TSH decreased from 2.65 uU/mL to 1.95 uU/mL, with thyroid hormone support incorporating T3 (5 ug) and T4 (25 ug) (Ling 2018). One prospective survey indicates that thyroid dysfunction was lowest with a serum TSH between 1 and 1.9 uU/mL (Liu 2010).
Optimal Takeaways
- Many medical decisions are based on lab results and blood chemistry analysis. However, conventional biomarker reference intervals can fail to identify early dysfunction, subclinical disease, or latent deficiencies.
- Clinicians must look beyond conventional reference intervals and not wait for a pathological diagnosis if we are to help patients improve their metabolic profile now to prevent disease later.
- Early trends away from optimal values can be identified and addressed before overt symptoms or dysfunction occur.
- Monitoring results over time and using the same laboratory for repeat bloodwork will provide the most relevant data for a comprehensive functional blood chemistry analysis.
- Functional Blood Chemistry Analysis is not considered diagnostic and must be used as part of a matrix addressing each patient’s clinical presentation history, symptoms, and blood chemistry changes over time.
- The ODX Ranges help fully evaluate chronic dysfunction and disease risk, guide therapeutic intervention, and promote prevention.
- Promoting optimal function on the inside is imperative to achieving optimal health on the outside.
Want to Learn More?
Click HERE to view the ODX White Paper What is Optimal
Click on the links below to review more biomarker overviews and their ODX Range- ODX Research Blog
- Cholesterol, LDL
- Cholesterol, Total
- Fasting Glucose
- Magnesium, Serum
- Magnesium, RBC
- Omega-3 Index
- Sodium
- And there are MANY more here: The ODX Research Blog
References
Bancks, Michael P et al. “Long-term Absolute Risk for Cardiovascular Disease Stratified by Fasting Glucose Level.” Diabetes care vol. 42,3 (2019): 457-465. doi:10.2337/dc18-1773
Biondi, Bernadette. “The normal TSH reference range: what has changed in the last decade?.” The Journal of clinical endocrinology and metabolism vol. 98,9 (2013): 3584-7. doi:10.1210/jc.2013-2760 [R]
Bjørnholt, J V et al. “Fasting blood glucose: an underestimated risk factor for cardiovascular death. Results from a 22-year follow-up of healthy nondiabetic men.” Diabetes care vol. 22,1 (1999): 45-9. doi:10.2337/diacare.22.1.45
Cardiovascular Disease Risk Tests. https://www.aetna.com/cpb/medical/data/300_399/0381.html
Costello, Rebecca B et al. “Perspective: The Case for an Evidence-Based Reference Interval for Serum Magnesium: The Time Has Come.” Advances in nutrition (Bethesda, Md.) vol. 7,6 977-993. 15 Nov. 2016, doi:10.3945/an.116.012765
Garber, Jeffrey R et al. “Clinical practice guidelines for hypothyroidism in adults: cosponsored by the American Association of Clinical Endocrinologists and the American Thyroid Association.” Thyroid : official journal of the American Thyroid Association vol. 22,12 (2012): 1200-35. doi:10.1089/thy.2012.0205
Gurzell, Eric A et al. “Is the omega-3 index a valid marker of intestinal membrane phospholipid EPA+DHA content?.” Prostaglandins, leukotrienes, and essential fatty acids vol. 91,3 (2014): 87-96. doi:10.1016/j.plefa.2014.04.001
Harris, William S., Clemens von Schacky, and Yongsoon Park. "Standardizing methods for assessing omega-3 fatty acid biostatus." The Omega-3 fatty acid deficiency syndrome: opportunities for disease prevention. Nova Science Publishers, Inc., 2013. 385-398.
Harris, William S et al. “The Omega-3 Index and relative risk for coronary heart disease mortality: Estimation from 10 cohort studies.” Atherosclerosis vol. 262 (2017): 51-54. doi:10.1016/j.atherosclerosis.2017.05.007
Jones, Graham, and Antony Barker. “Reference intervals.” The Clinical biochemist. Reviews vol. 29 Suppl 1,Suppl 1 (2008): S93-7.
Katayev, Alex et al. “Establishing reference intervals for clinical laboratory test results: is there a better way?.” American journal of clinical pathology vol. 133,2 (2010): 180-6. doi:10.1309/AJCPN5BMTSF1CDYP
Kostov, Krasimir, and Lyudmila Halacheva. “Role of Magnesium Deficiency in Promoting Atherosclerosis, Endothelial Dysfunction, and Arterial Stiffening as Risk Factors for Hypertension.” International journal of molecular sciences vol. 19,6 1724. 11 Jun. 2018, doi:10.3390/ijms19061724
Labcorp. Magnesium Sample Report. https://files.labcorp.com/testmenu-d8/sample_reports/001537.pdf
Labcorp. Thyroid Stimulating Hormone. https://www.labcorp.com/tests/004259/thyroid-stimulating-hormone-tsh
Lim, Unhee, and Patricia A Cassano. “Homocysteine and blood pressure in the Third National Health and Nutrition Examination Survey, 1988-1994.” American journal of epidemiology vol. 156,12 (2002): 1105-13. doi:10.1093/aje/kwf157
Ling, C et al. “Does TSH Reliably Detect Hypothyroid Patients?.” Annals of thyroid research vol. 4,1 (2018): 122-125. [R]
Liu, D et al. “A cross-sectional survey of relationship between serum TSH level and blood pressure.” Journal of human hypertension vol. 24,2 (2010): 134-8. doi:10.1038/jhh.2009.44 [R]
McBurney, Michael I et al. “Omega-3 index is directly associated with a healthy red blood cell distribution width.” Prostaglandins, leukotrienes, and essential fatty acids vol. 176 (2022): 102376. doi:10.1016/j.plefa.2021.102376
McBurney, Michael I et al. “The omega-3 index is inversely associated with the neutrophil-lymphocyte ratio in adults'.” Prostaglandins, leukotrienes, and essential fatty acids vol. 177 (2022): 102397. doi:10.1016/j.plefa.2022.102397
Merck Manual Professional Version. Overview of Disorders of Magnesium Concentration. https://www.merckmanuals.com/professional/endocrine-and-metabolic-disorders/electrolyte-disorders/overview-of-disorders-of-magnesium-concentration
Mosby’s: Pagana, Kathleen Deska, et al. Mosby's Diagnostic and Laboratory Test Reference. 16th ed., Mosby, 2022.
Pusceddu, Irene et al. “Subclinical inflammation, telomere shortening, homocysteine, vitamin B6, and mortality: the Ludwigshafen Risk and Cardiovascular Health Study.” European journal of nutrition vol. 59,4 (2020): 1399-1411. doi:10.1007/s00394-019-01993-8
Quest Diagnostics. OmegaCheck. https://testdirectory.questdiagnostics.com/test/test-guides/TS_OmegaCheck/omegacheck
Quest Diagnostics Omega-3 and 6 Fatty Acids. https://testdirectory.questdiagnostics.com/test/test-detail/91001/omega-3-and--6-fatty-acids?cc=MASTER
Quest Diagnostics. Serum Magnesium. https://testdirectory.questdiagnostics.com/test/test-detail/622/magnesium?q=magnesium&cc=MASTER
Rosanoff, Andrea et al. “Effectively Prescribing Oral Magnesium Therapy for Hypertension: A Categorized Systematic Review of 49 Clinical Trials.” Nutrients vol. 13,1 195. 10 Jan. 2021, doi:10.3390/nu13010195
Ruhla, Stephan et al. “A high normal TSH is associated with the metabolic syndrome.” Clinical endocrinology vol. 72,5 (2010): 696-701. doi:10.1111/j.1365-2265.2009.03698.x
Superko, H Robert et al. “Omega-3 fatty acid blood levels: clinical significance and controversy.” Circulation vol. 128,19 (2013): 2154-61. doi:10.1161/CIRCULATIONAHA.113.002731
Surks, Martin I et al. “Subclinical thyroid disease: scientific review and guidelines for diagnosis and management.” JAMA vol. 291,2 (2004): 228-38. doi:10.1001/jama.291.2.228 [R]
Talaei, A et al. “TSH cut off point based on depression in hypothyroid patients.” BMC psychiatry vol. 17,1 327. 7 Sep. 2017, doi:10.1186/s12888-017-1478-9 [R]
Testing.com. AACC affiliate. Reference Ranges and What They Mean. Modified July 9, 2021. https://www.testing.com/articles/laboratory-test-reference-ranges/
Travica, Nikolaj, et al. "Integrative Health Check reveals suboptimal levels in a number of vital biomarkers." Advances in integrative medicine 2.3 (2015): 135-140.
Upadhyay, Ravi Kant. “Emerging risk biomarkers in cardiovascular diseases and disorders.” Journal of lipids vol. 2015 (2015): 971453. doi:10.1155/2015/971453
von Schacky, Clemens. “Omega-3 index and cardiovascular health.” Nutrients vol. 6,2 799-814. 21 Feb. 2014, doi:10.3390/nu6020799