
Optimal DX is Functional Blood Chemistry Analysis (FBCA) software for Functional Medicine practitioners. Optimal DX scores every biomarker on a standard blood panel against a standard range and an Optimal DX optimal range, scores the patterns across related biomarkers, and produces a Functional Health Report in a practitioner version and a patient version. Practitioners in 84 countries use it to see where a patient's physiology is changing and to choose which advanced tests to order next.

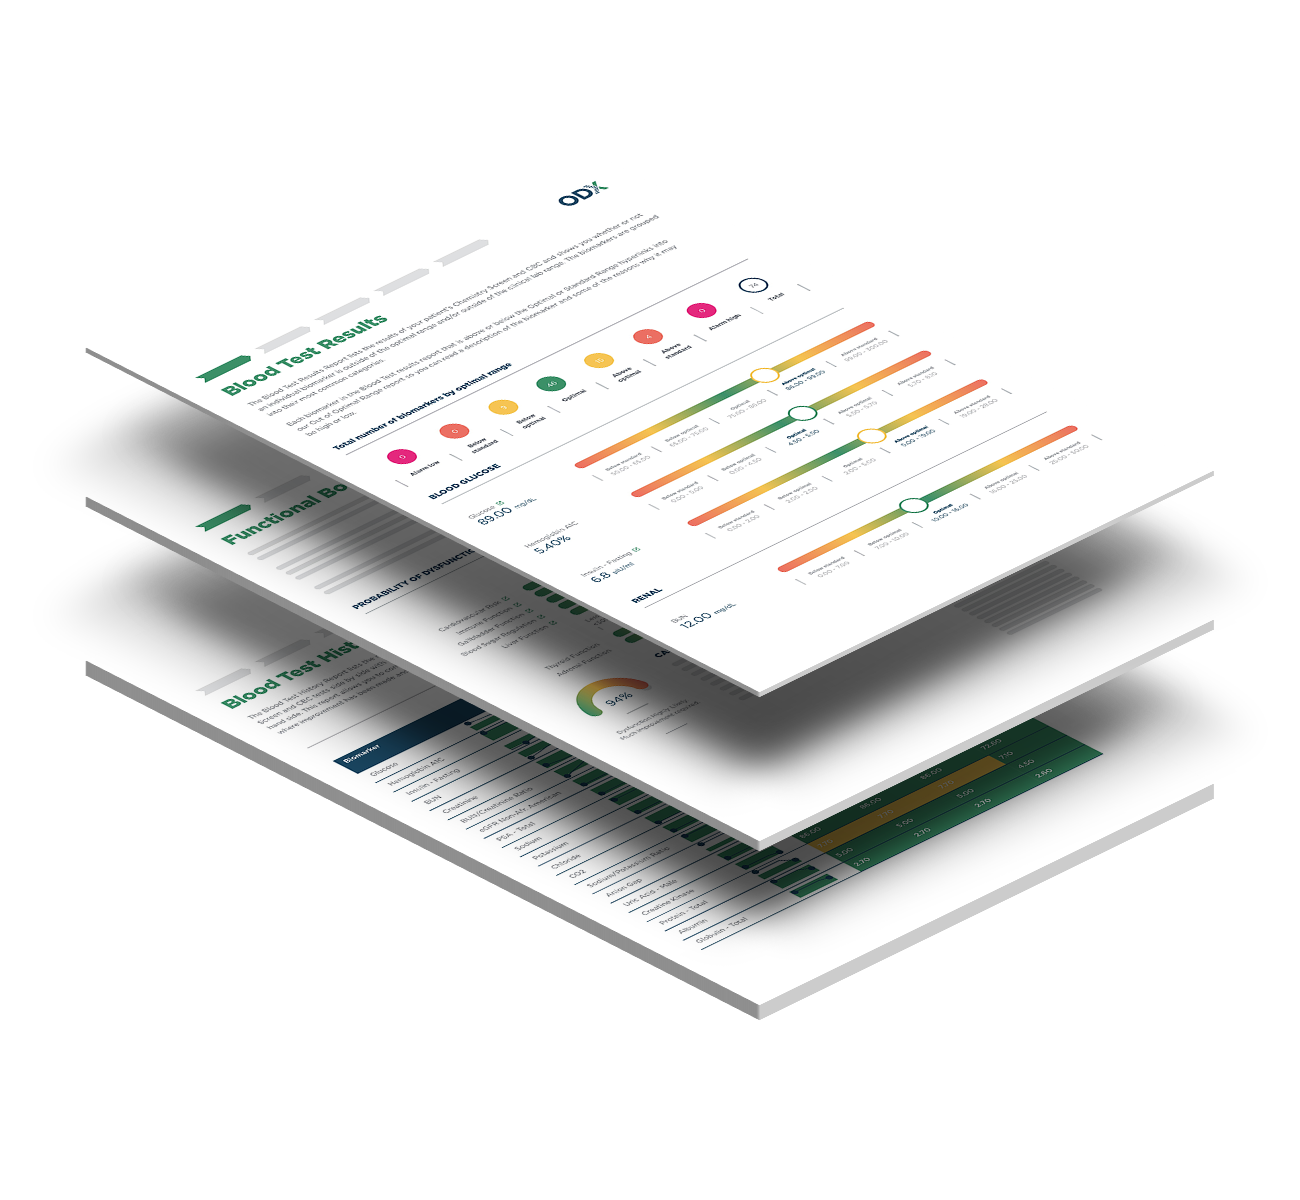
Optimal DX produces each Functional Health Report in a practitioner version with 16 sections and a patient version with 12. Both share 11 sections, and each opens with its own introduction: the Practitioner Report or the Patient Report. The practitioner version adds Blood Test Score, Clinical Dysfunctions, Recommended Further Testing and What To Look For.
Learn More About Reports
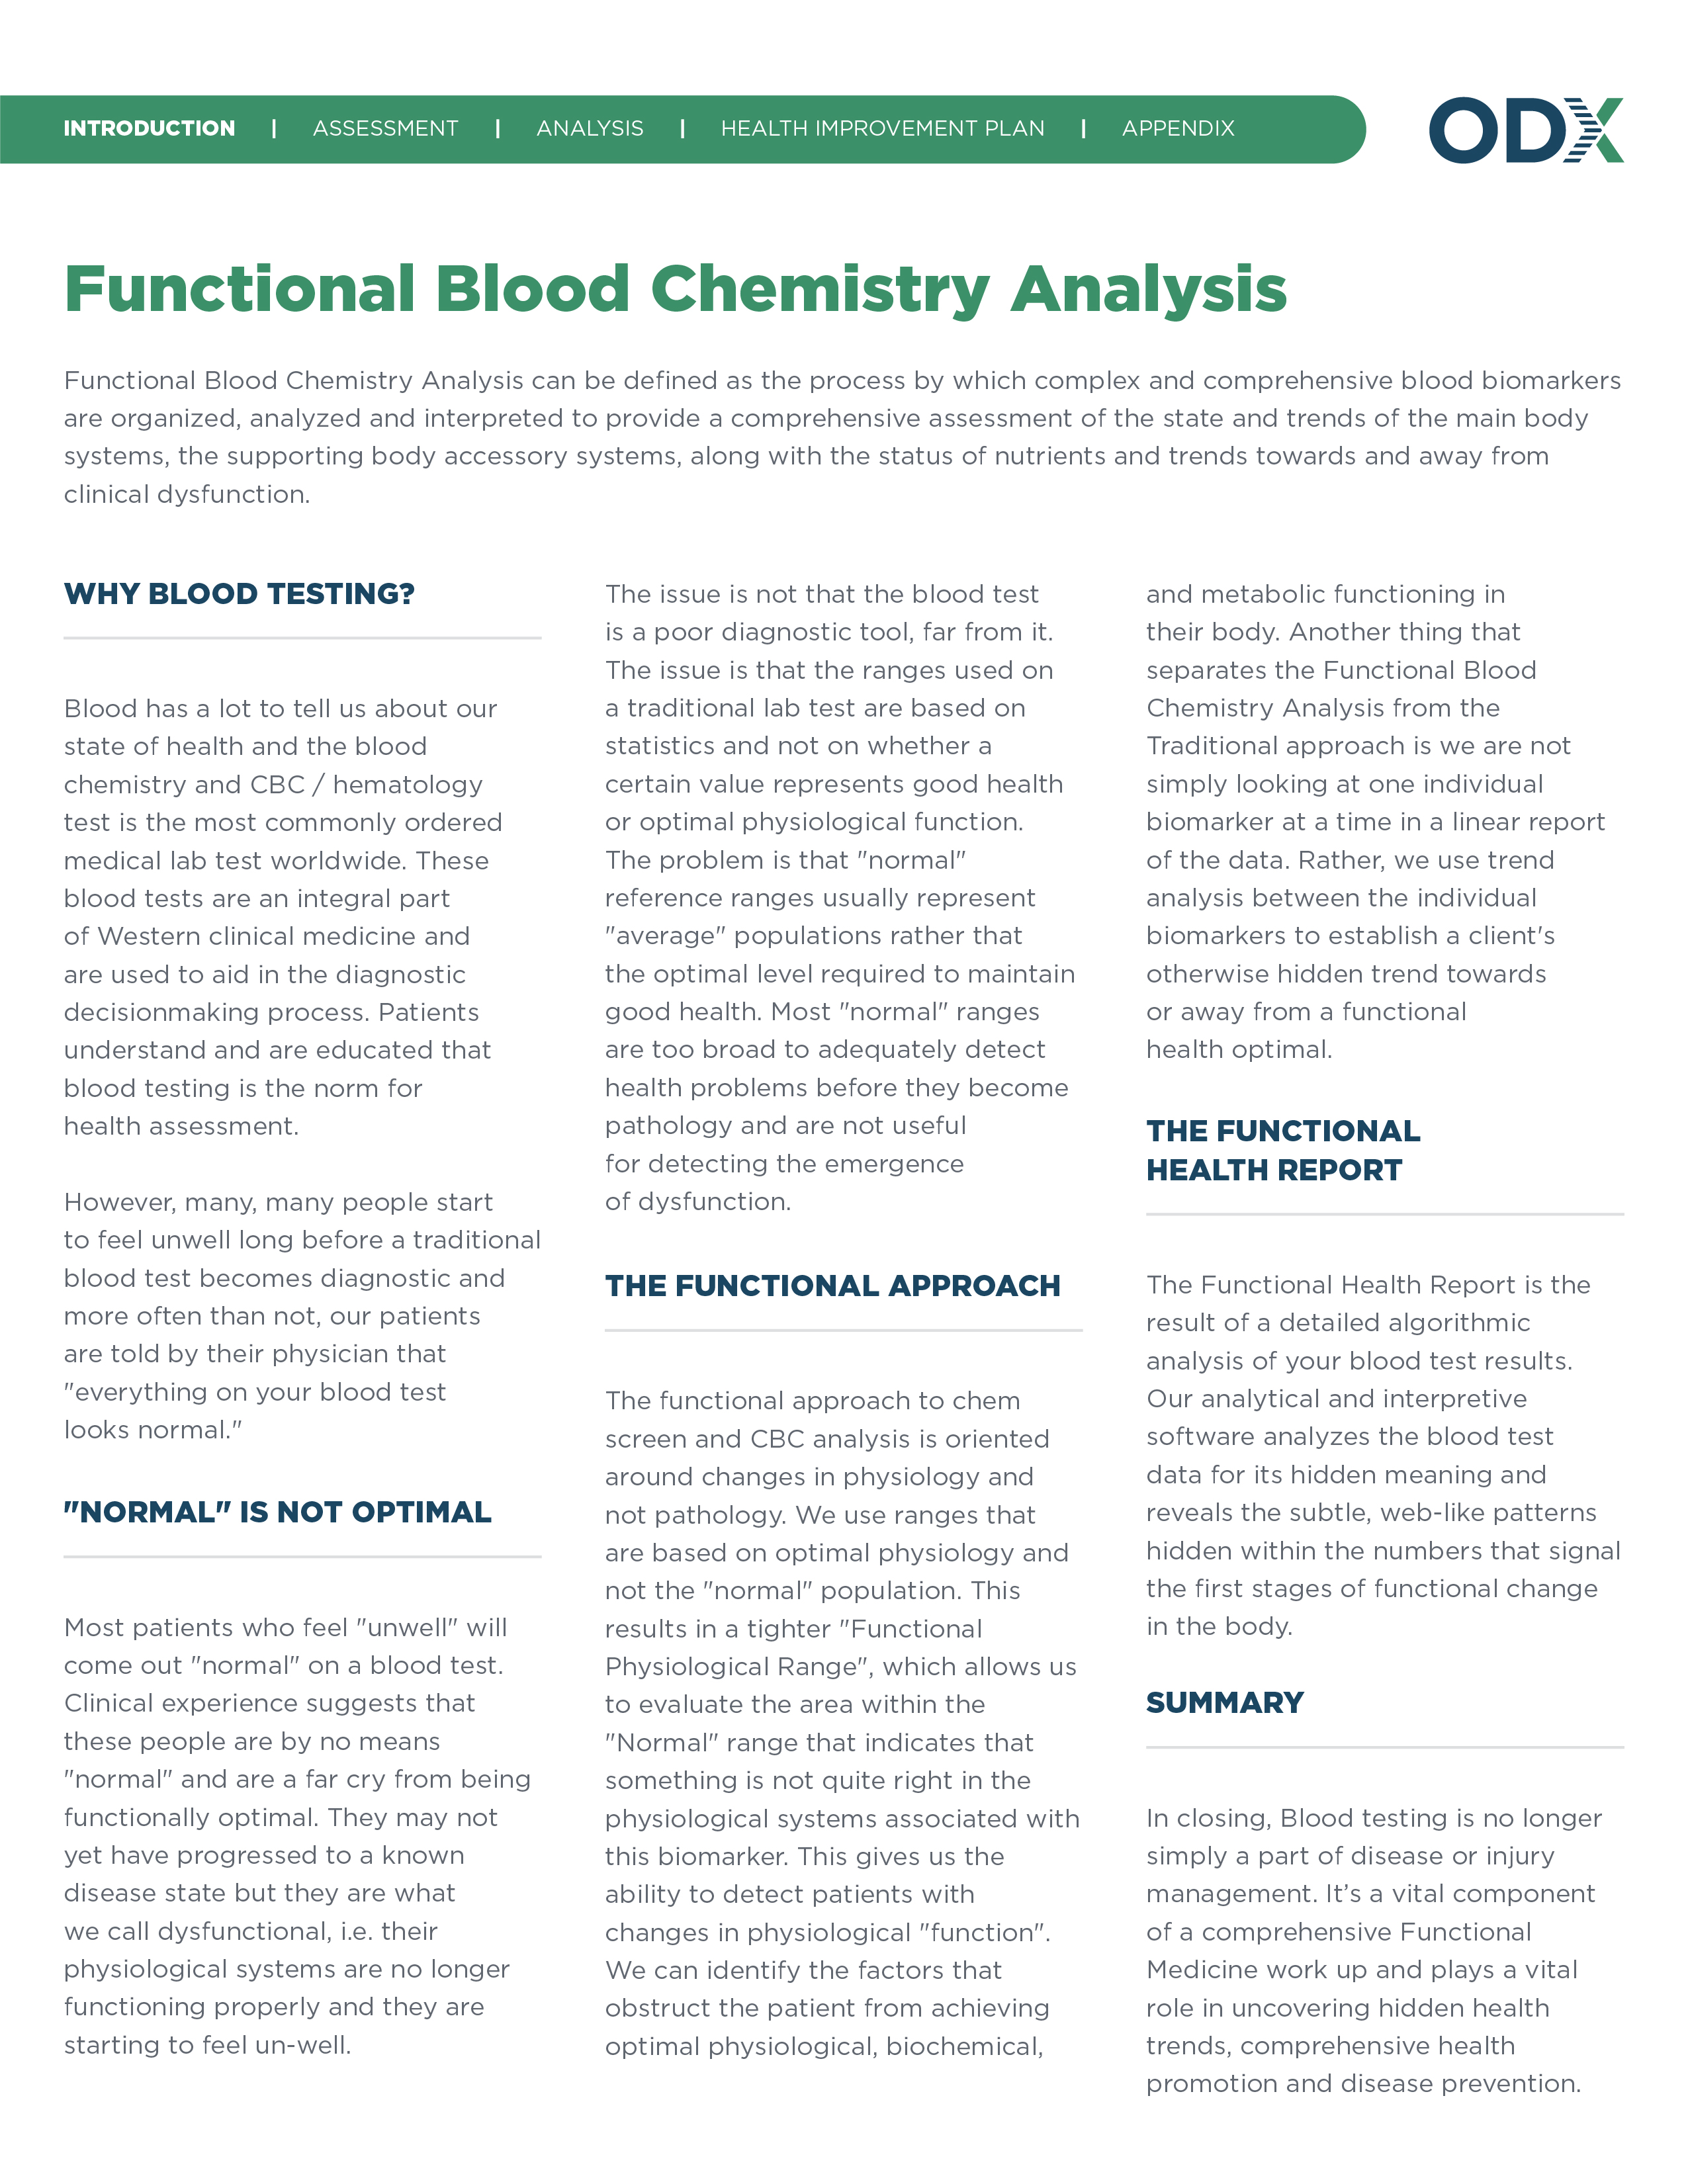
Provide a simple, easy-to-understand overview of the functional approach to blood chemistry analysis to your patients. With the right context, patients will more clearly see the value of their Functional Health Report.
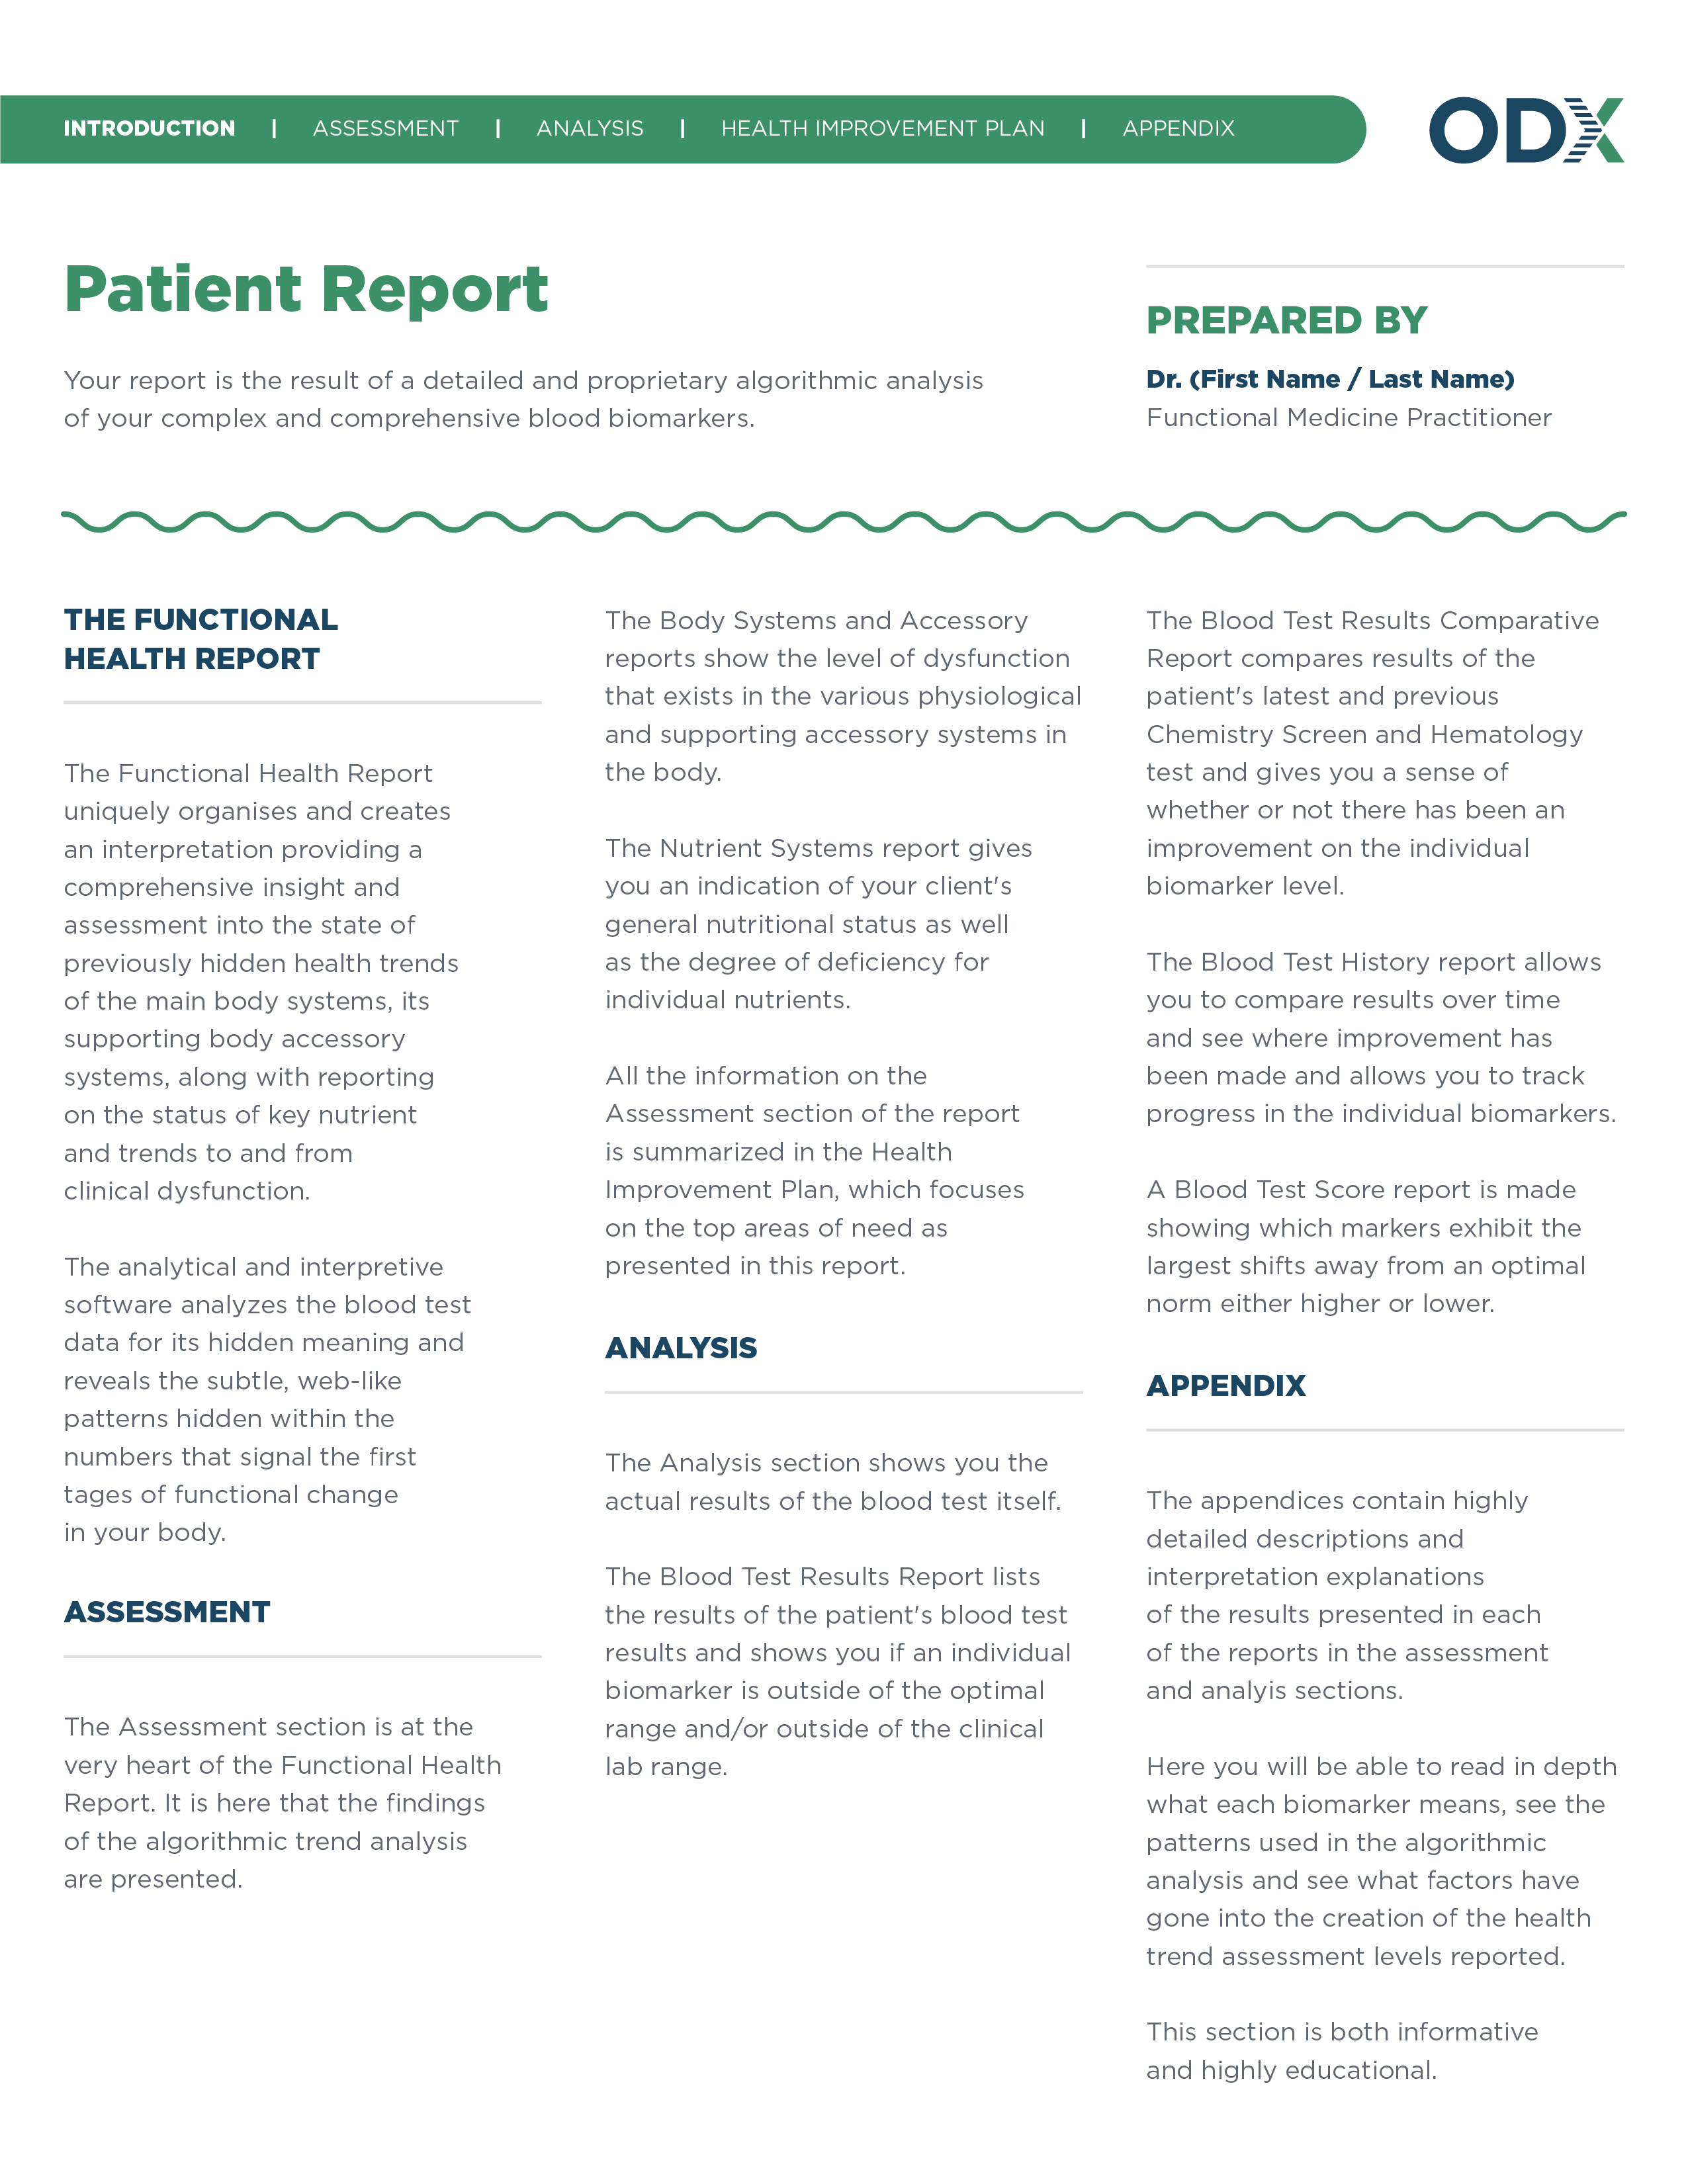
Introduce the modules in the Functional Health Report so your patients can easily interpret and digest the information contained within.
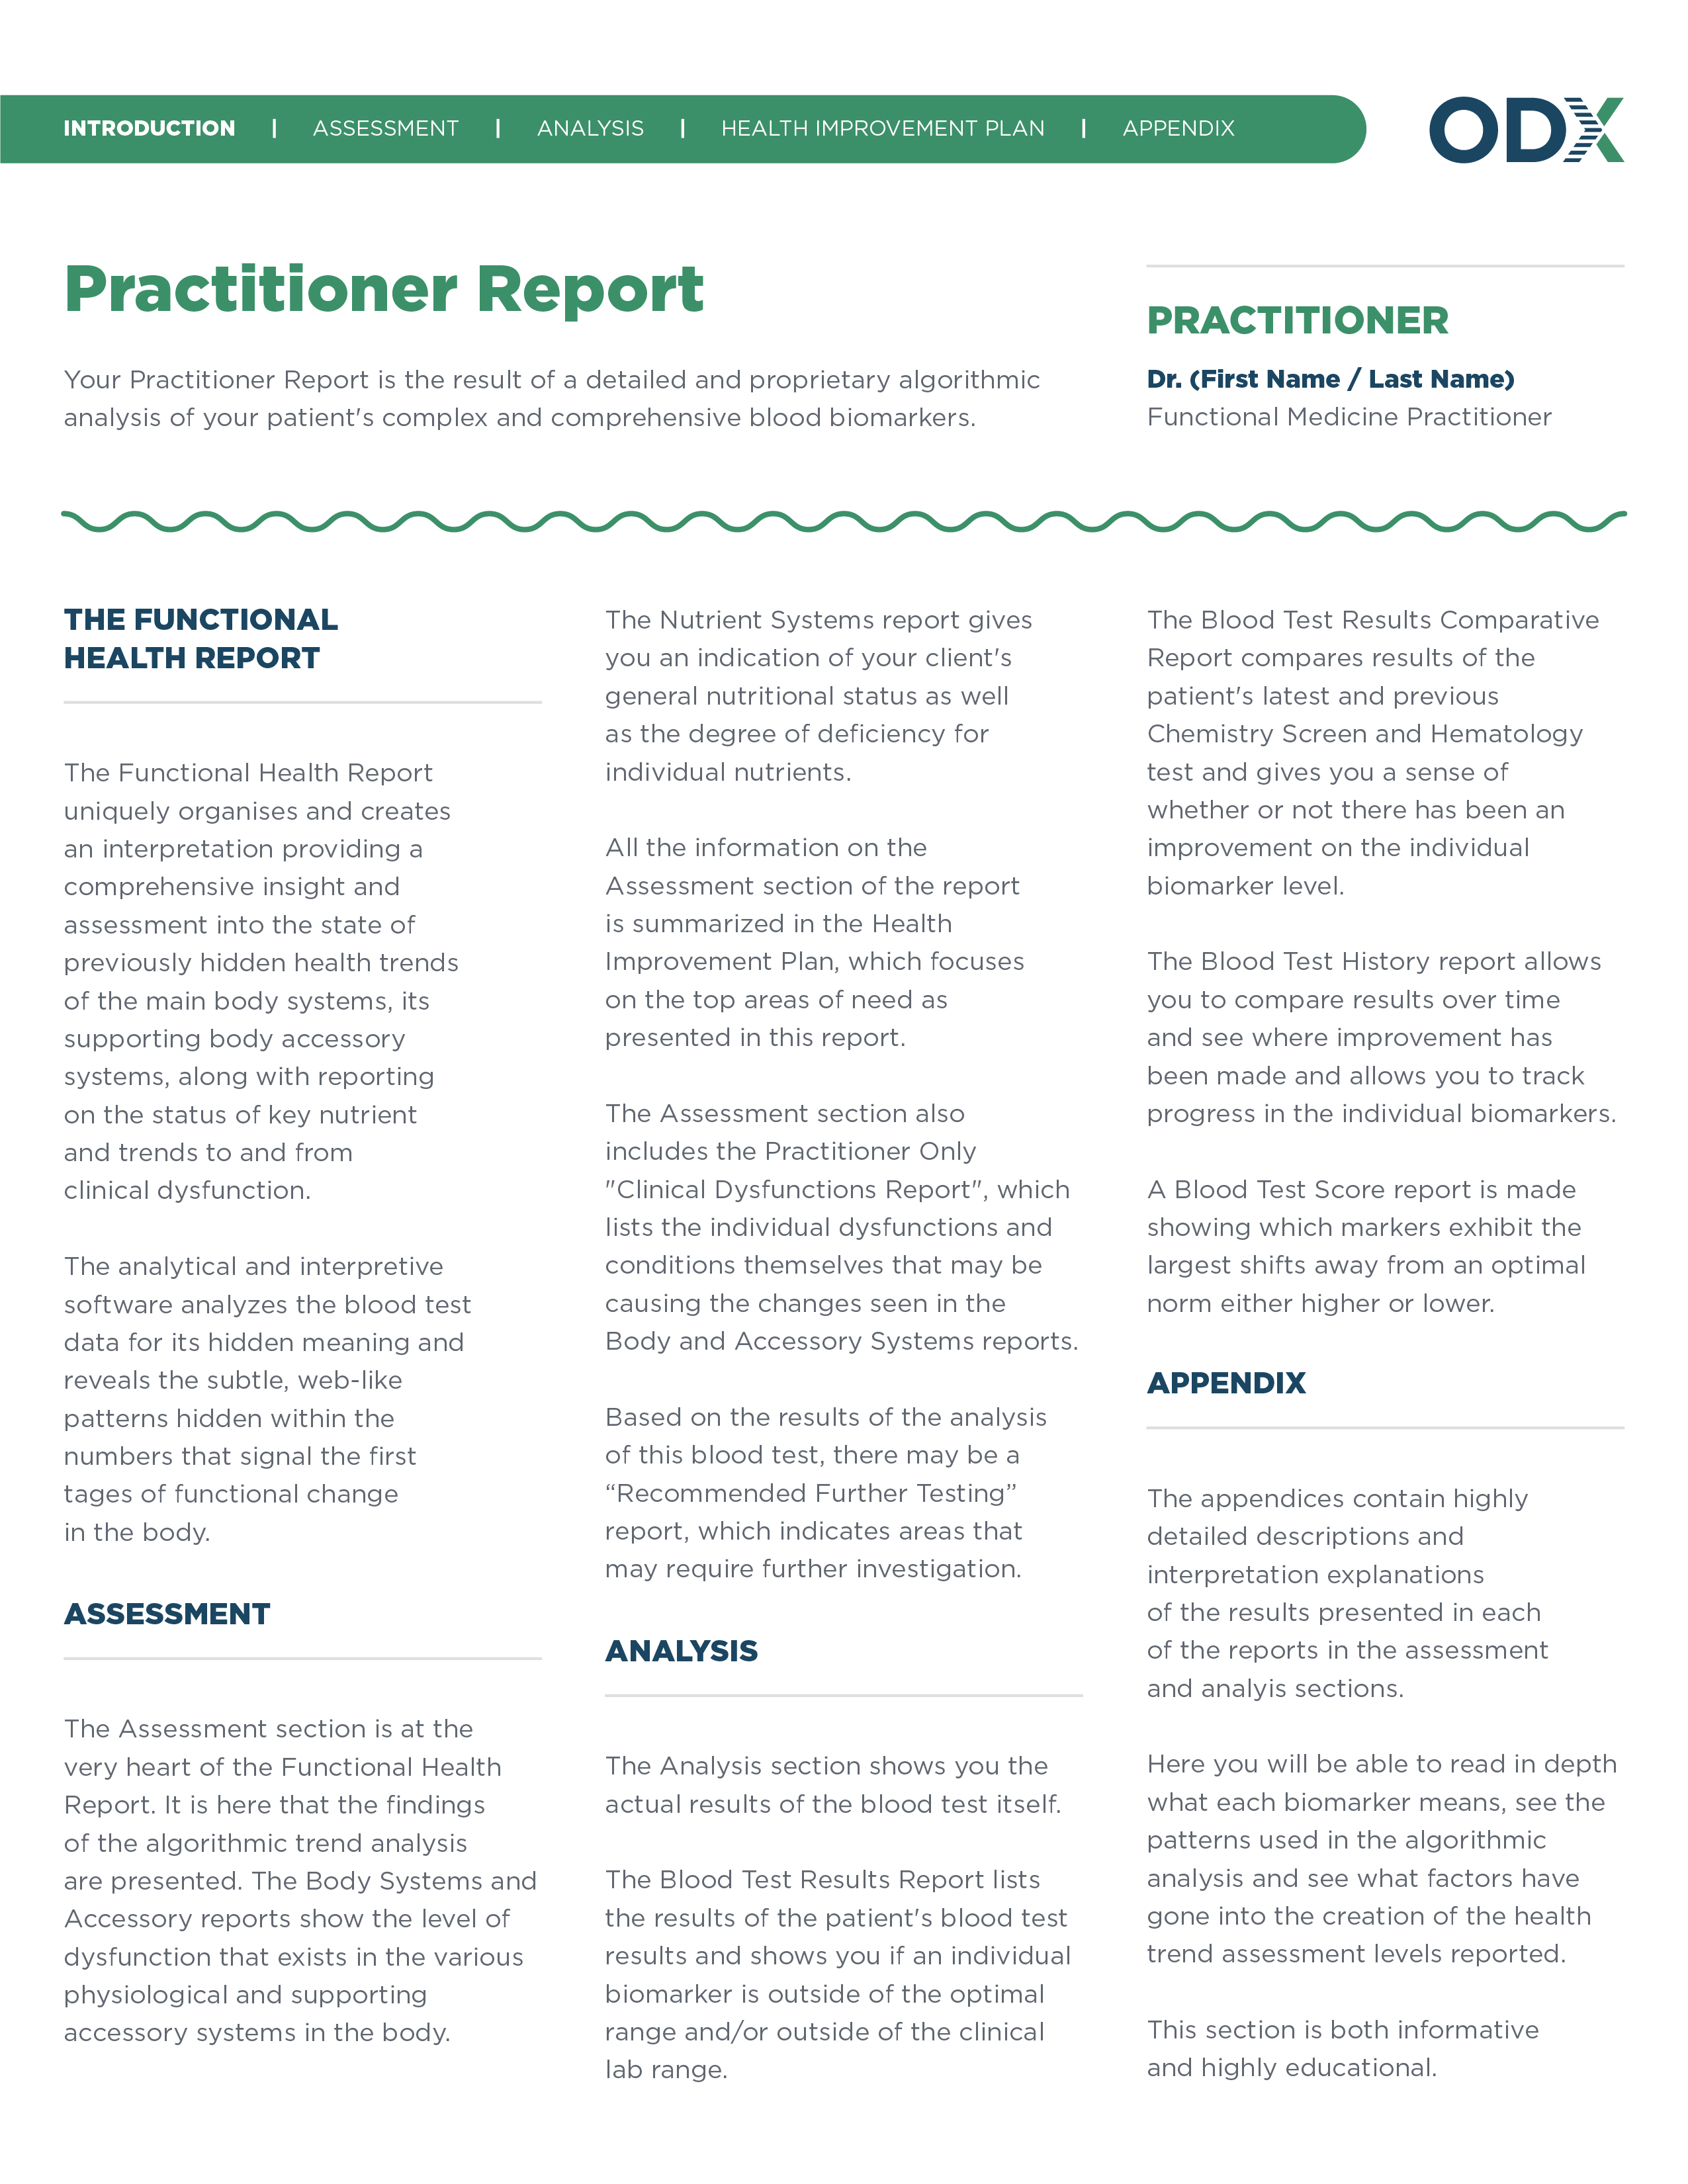
Contextualize the Functional Health Report so that you or other practitioners are equipped with the knowledge to interpret its information.
Add your own notes to deliver alongside the Functional Health Report to your patients. You can call out important information, detail your treatment plan, explain the report further or add any information you feel is relevant to your patients’ health journey.
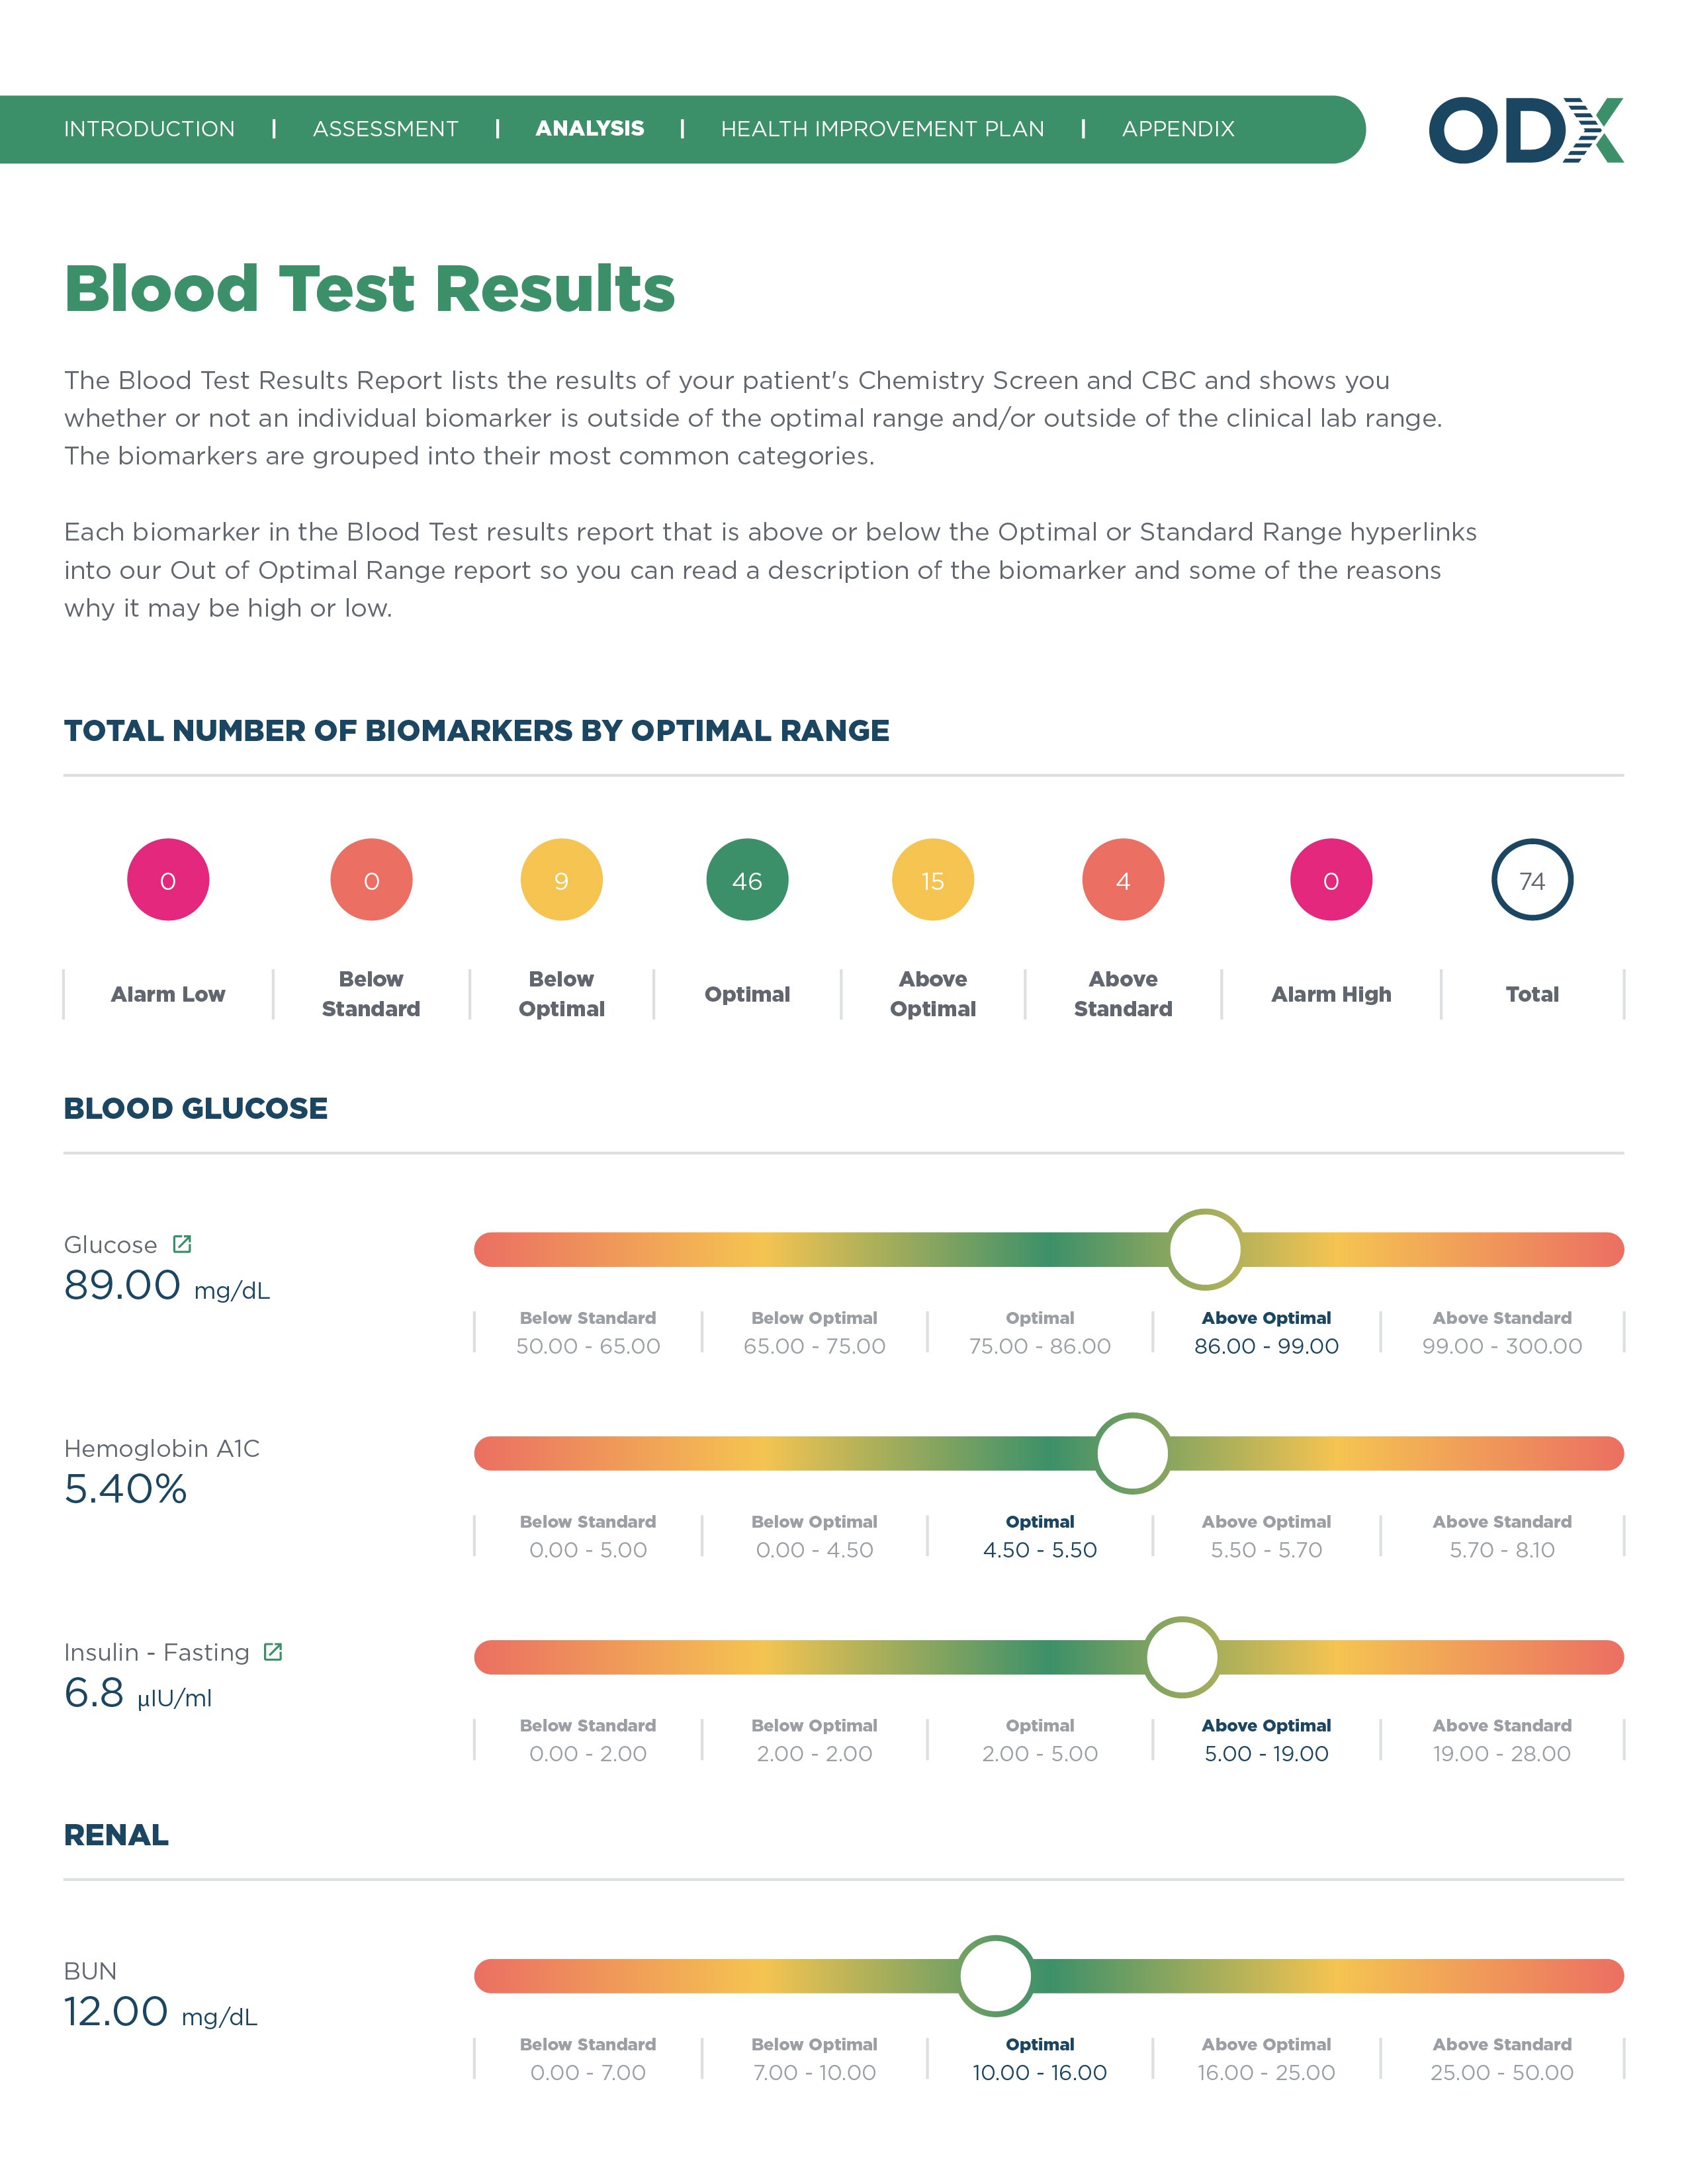
Now that you’ve received your patients’ blood test results, it’s time to review them with a functional lens. This report lists the results of the patients’ tests and whether or not a given biomarker is outside of the optimal range or lab range.
How does a patient’s most recent blood biomarker profile compare to a previous one? This report calls out major areas of change between two lab tests.
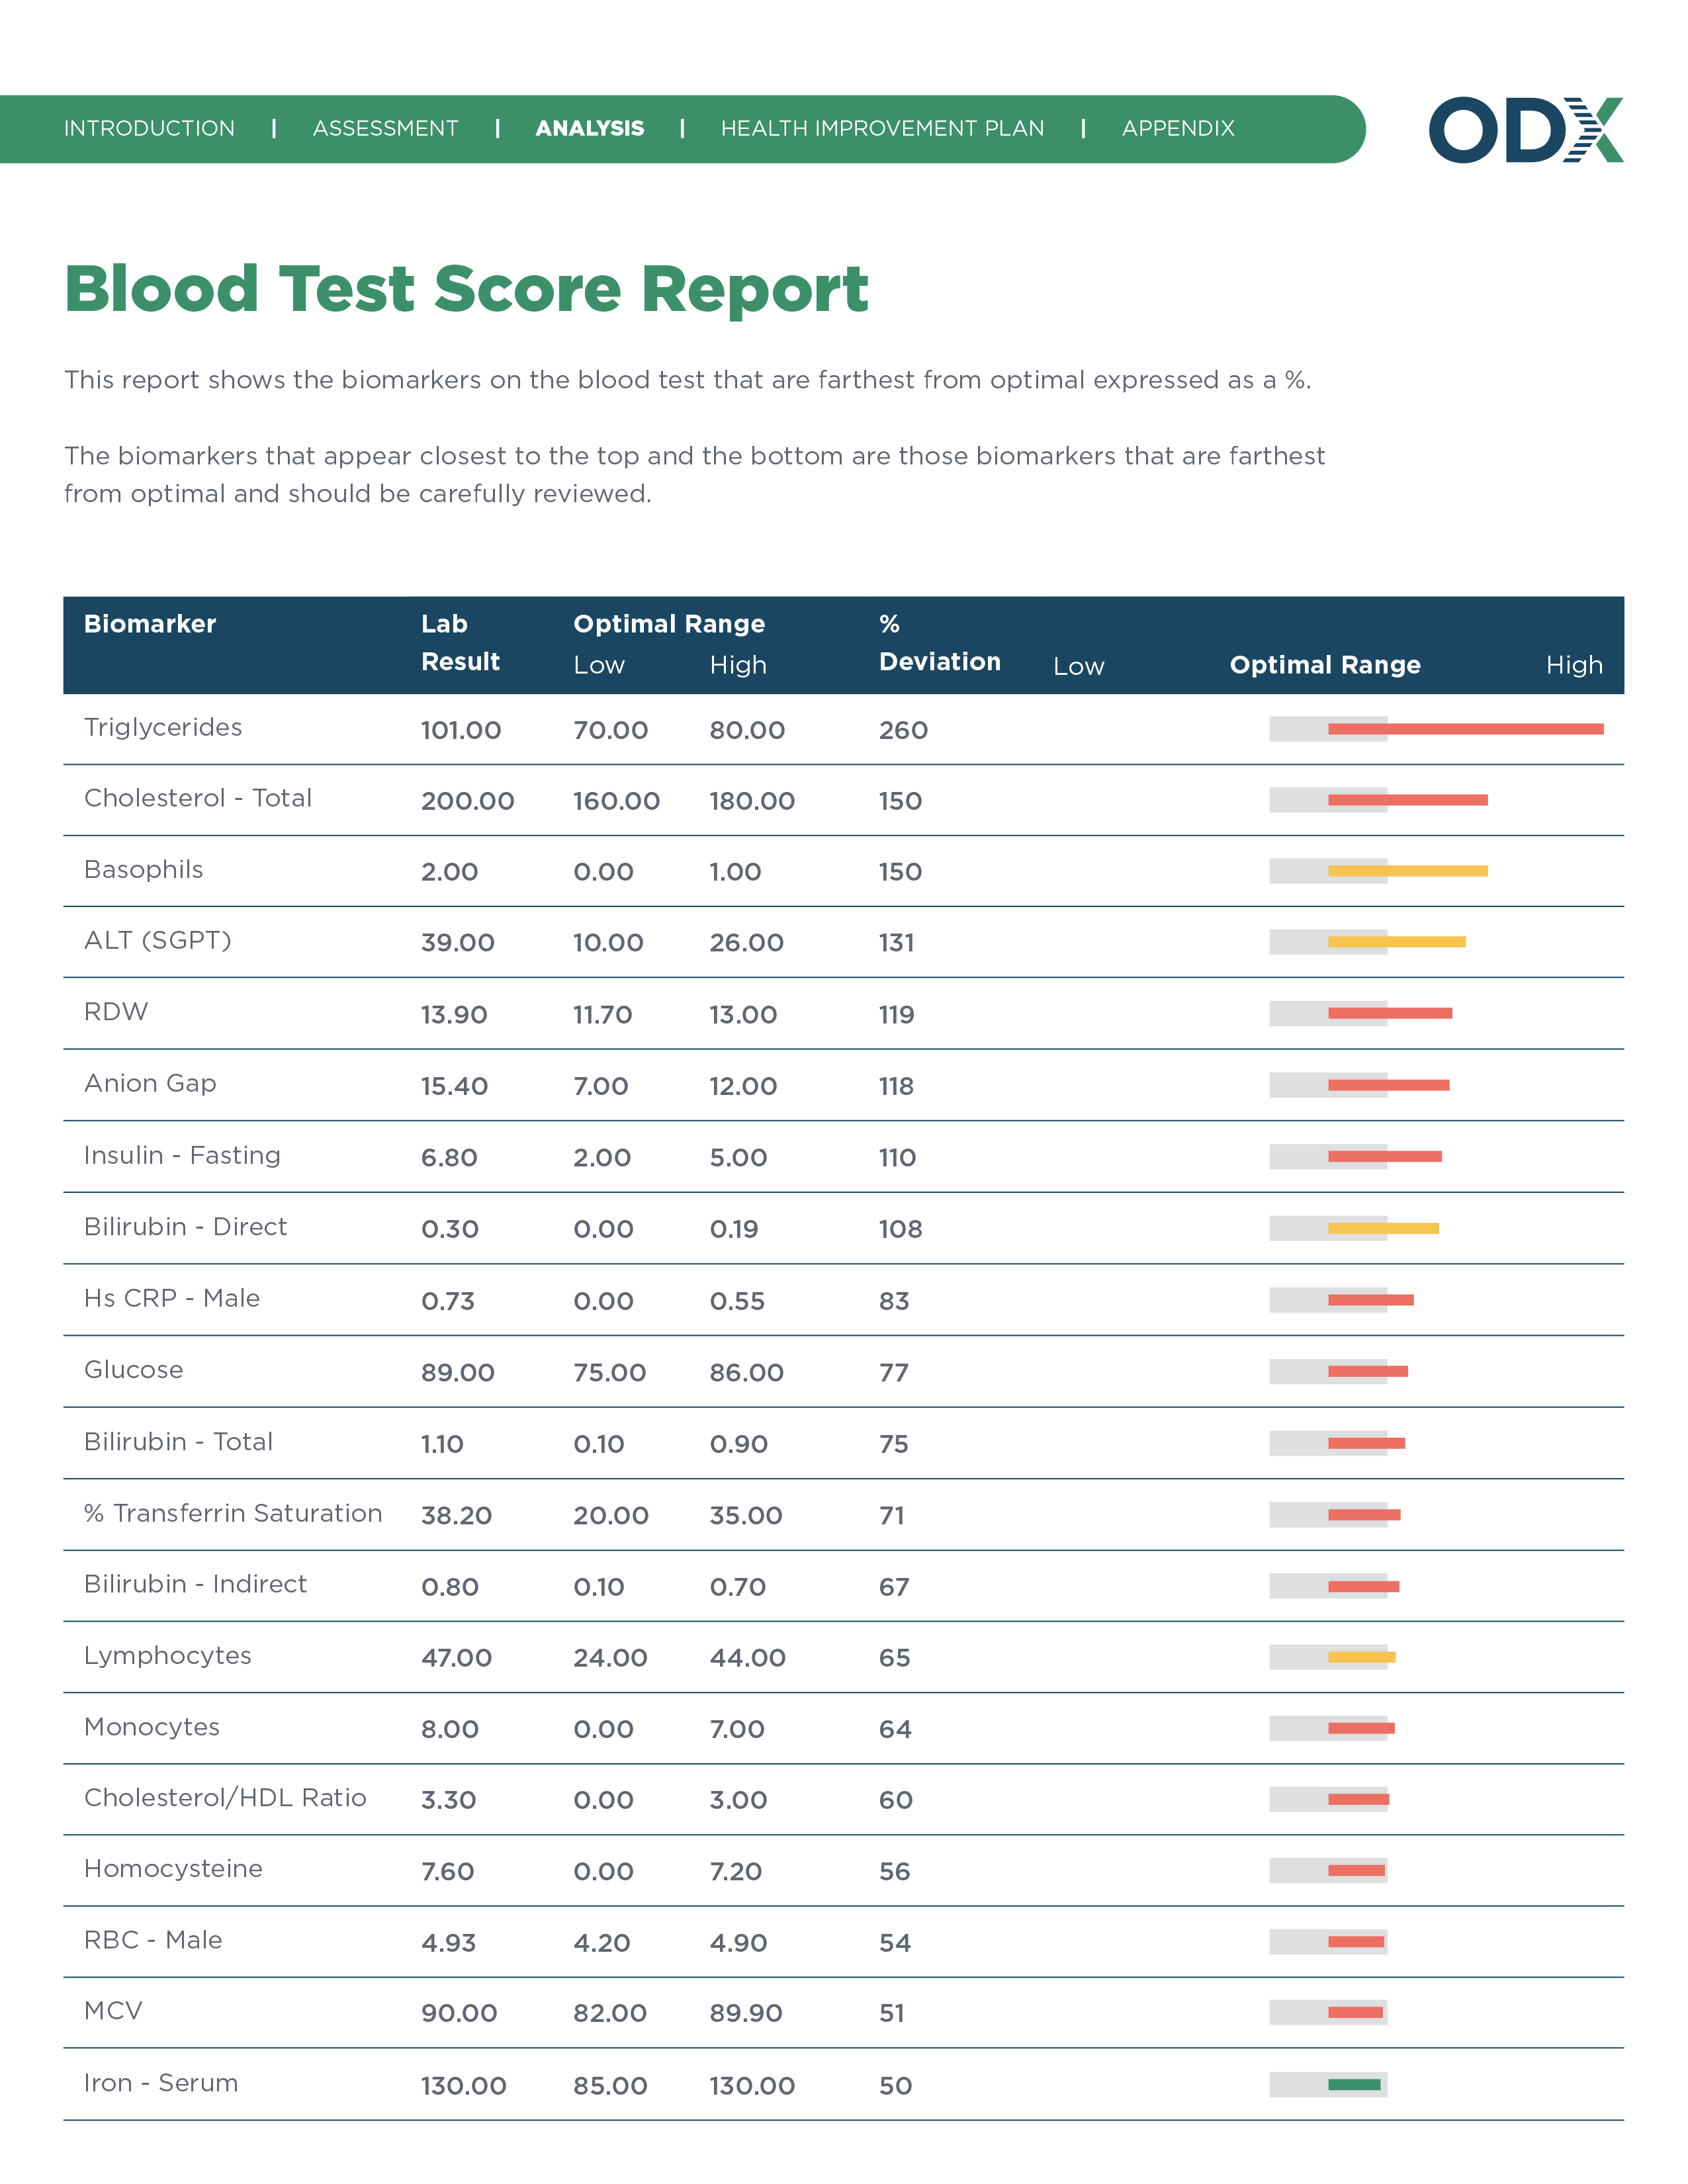
Using this report, you can quickly view which biomarkers scored farthest from the median on your patients’ blood test as expressed as a percentage score.
Take a broader view of your patients’ progress over time using the Blood Test History report. This report shows the past 6 blood tests side by side, graphing biomarker change over time.
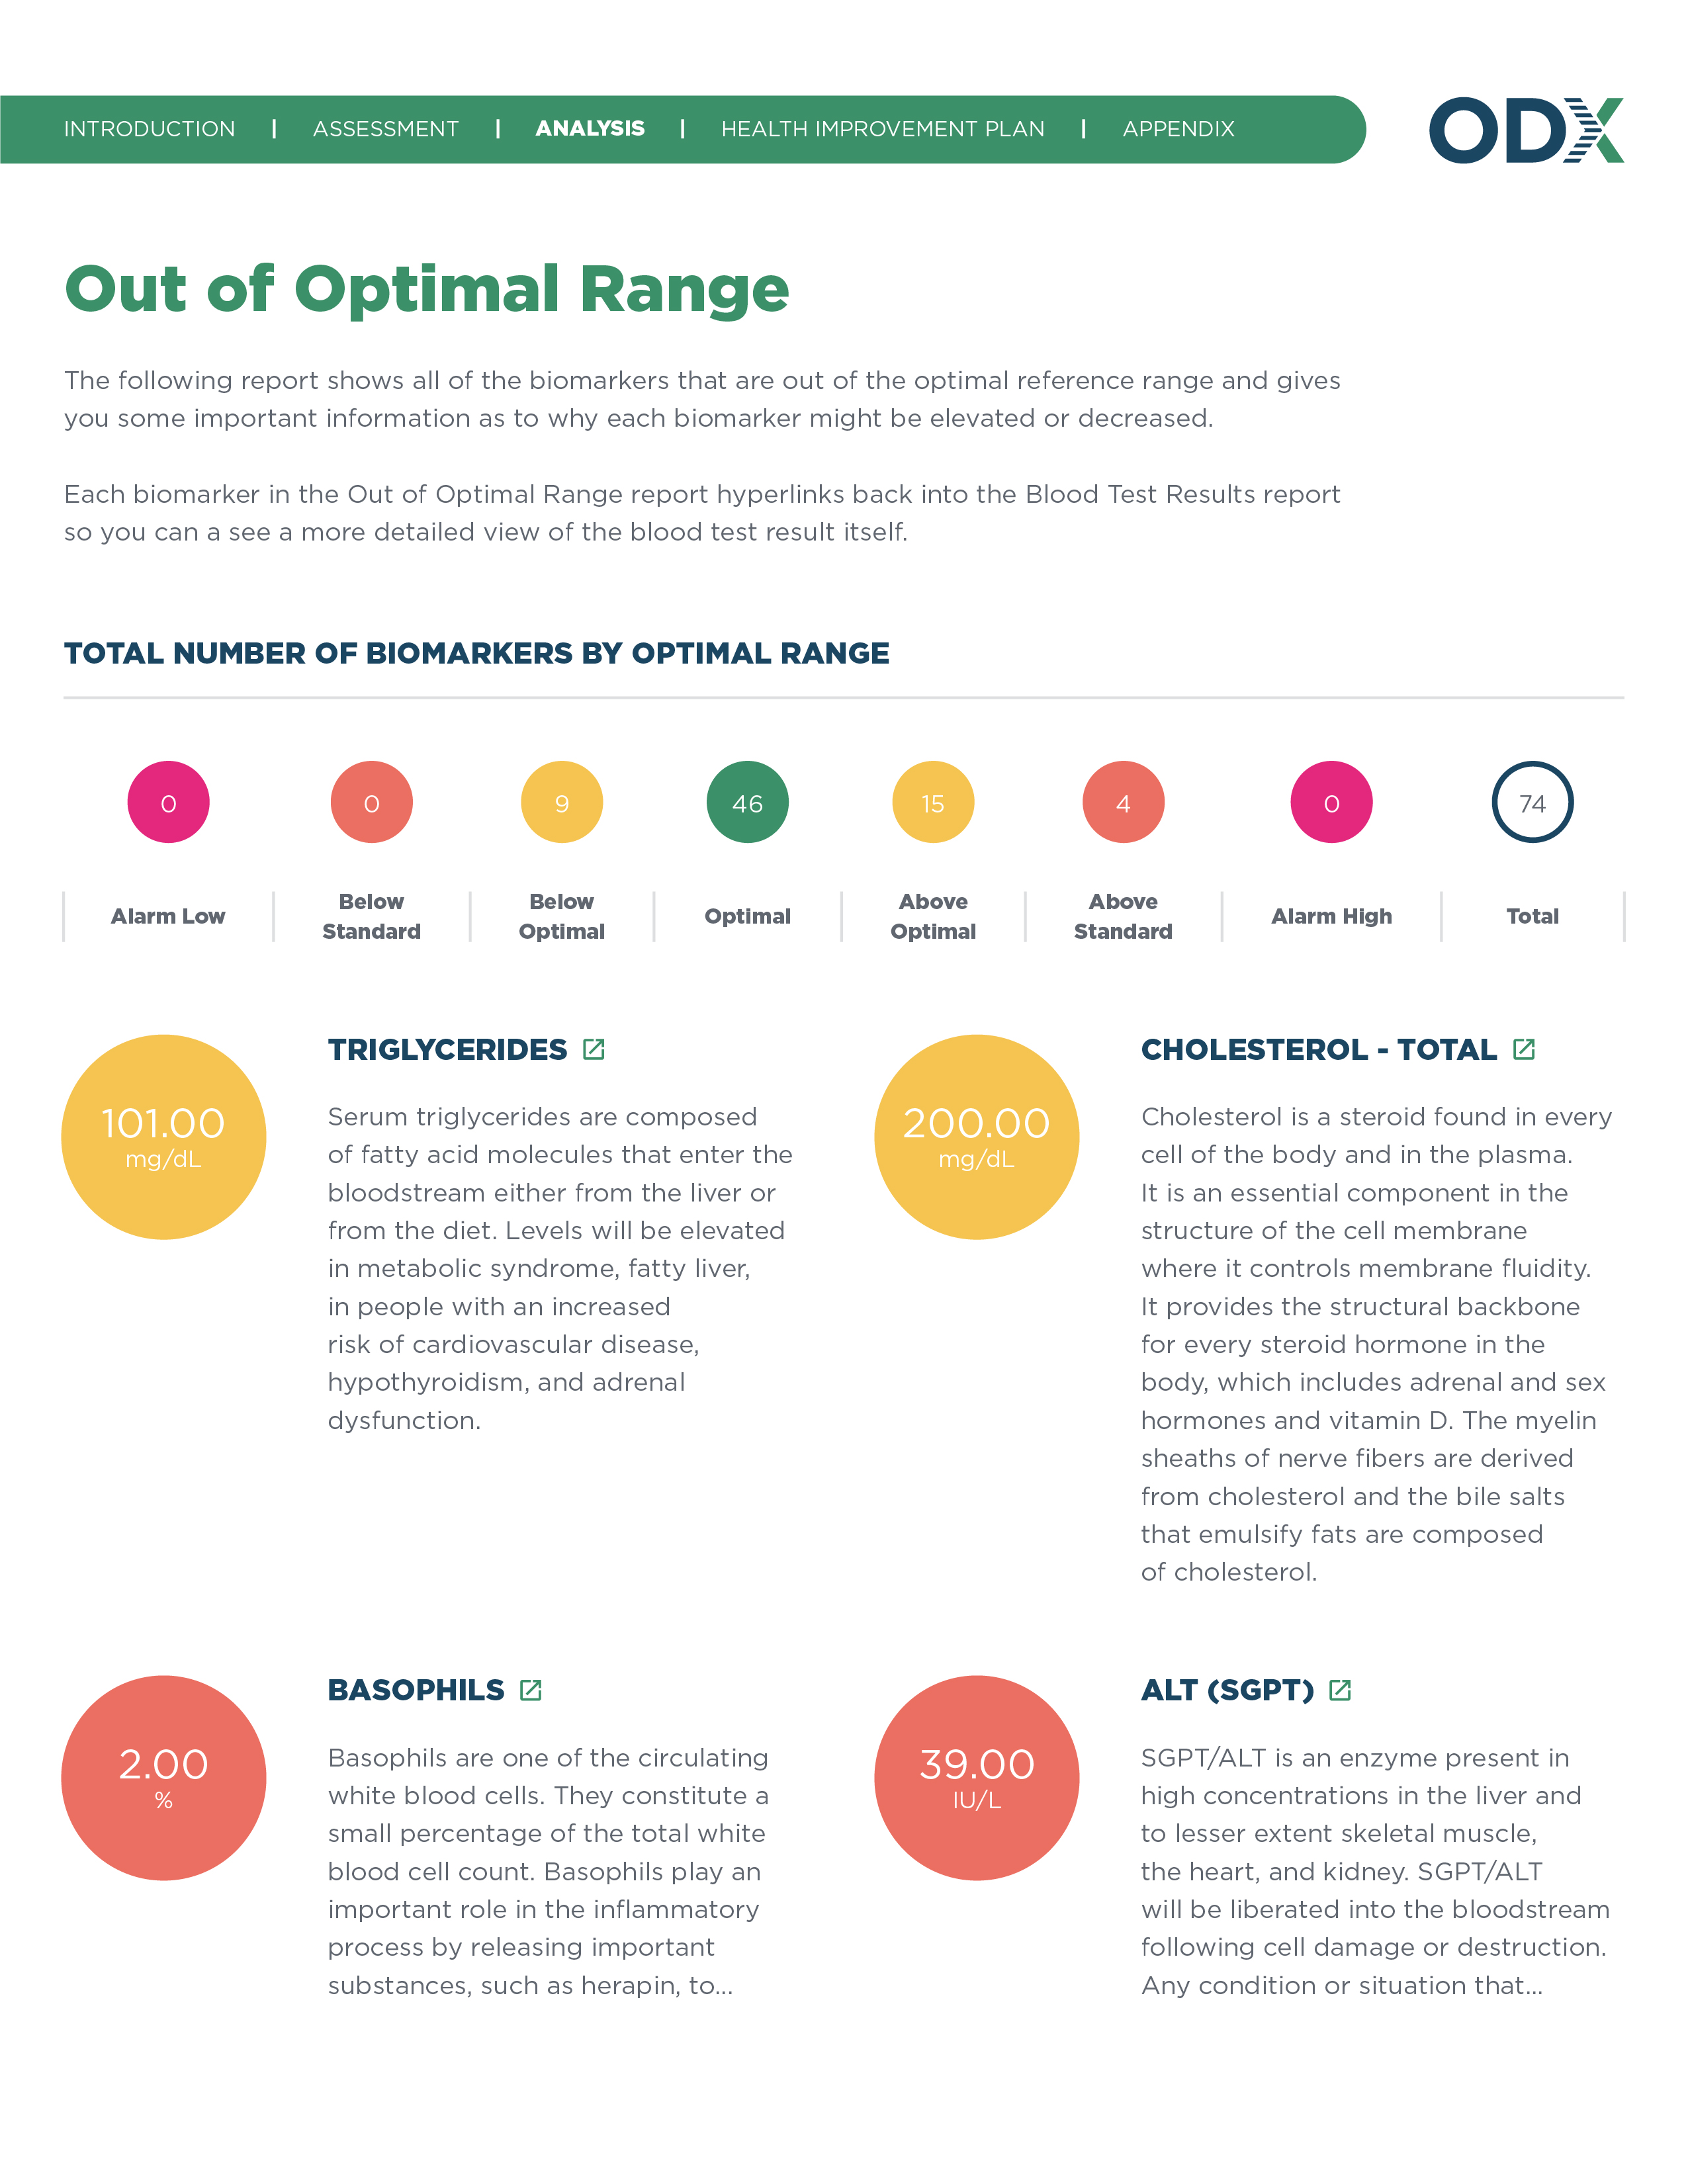
Every biomarker outside its optimal range, at a glance. Optimal DX adds a short description of why each one may be elevated or decreased.
View an algorithmically derived assessment of dysfunction risk for each major functional body system — such as the immune, cardiovascular and others — based on the data from your patients’ latest blood test results.
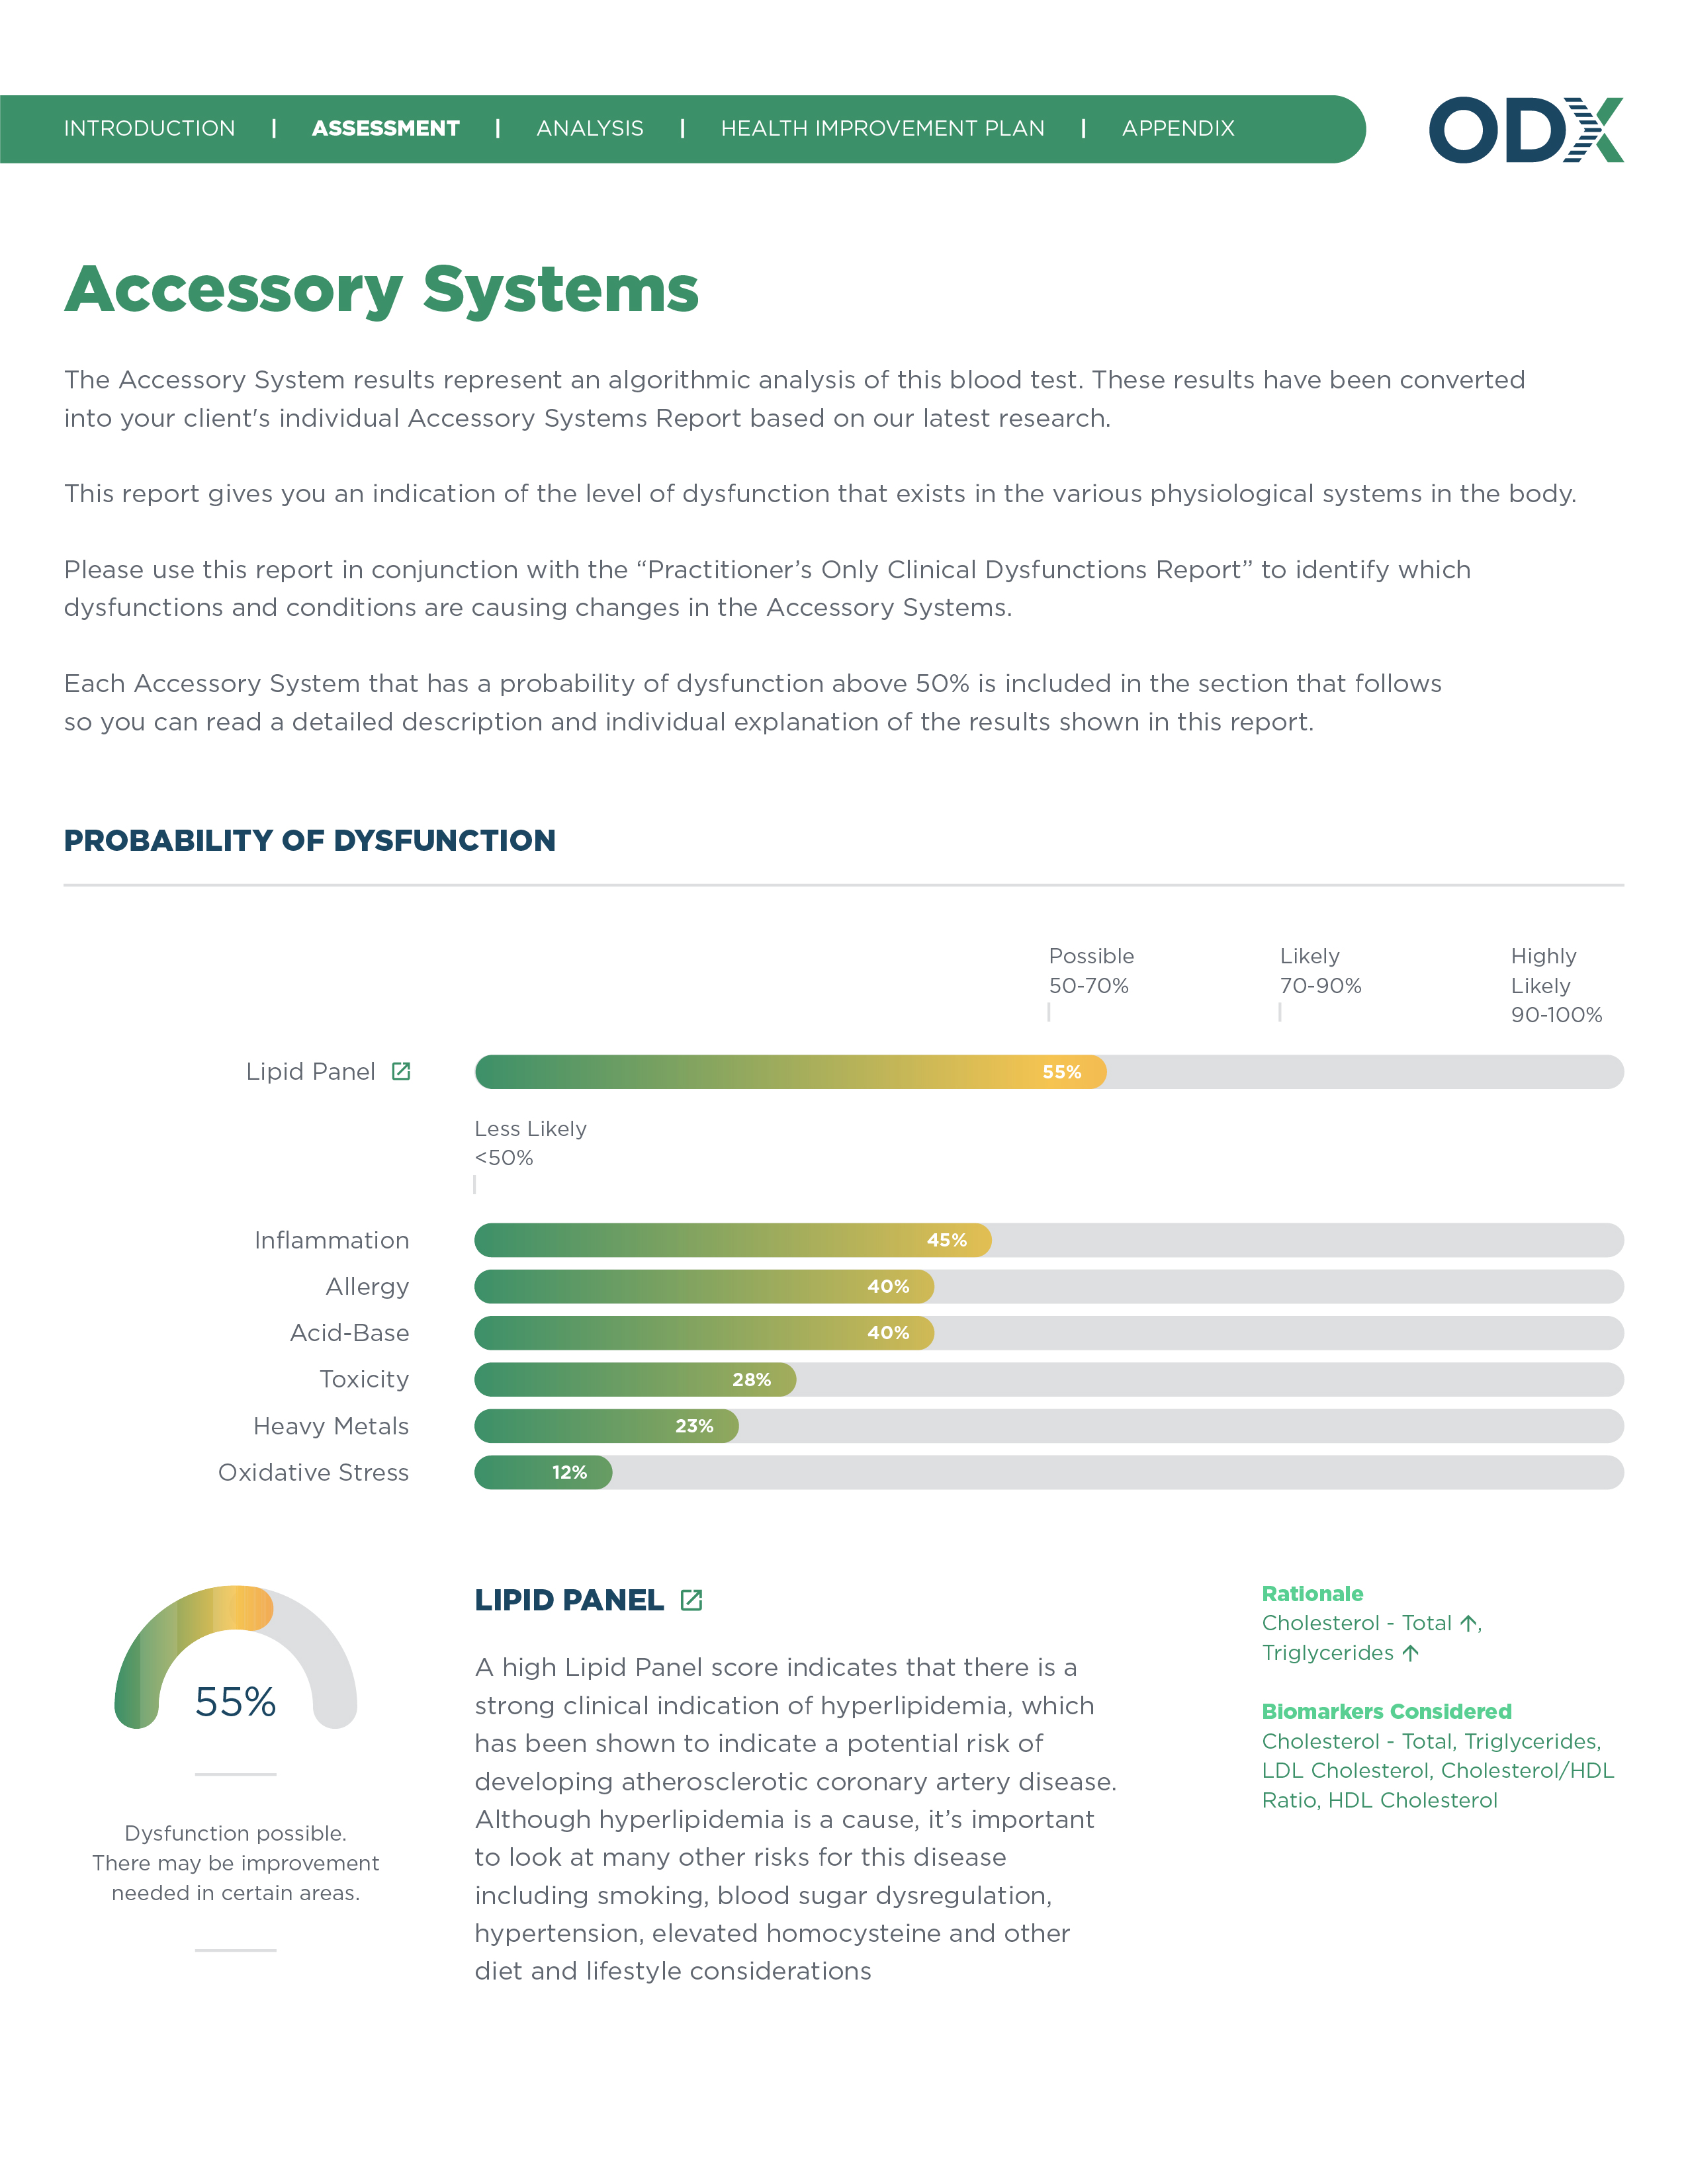
View an algorithmic analysis of the probability of dysfunction for each accessory functional system — such as inflammatory, acid-base and others — based on the data from your patients’ latest blood test results.
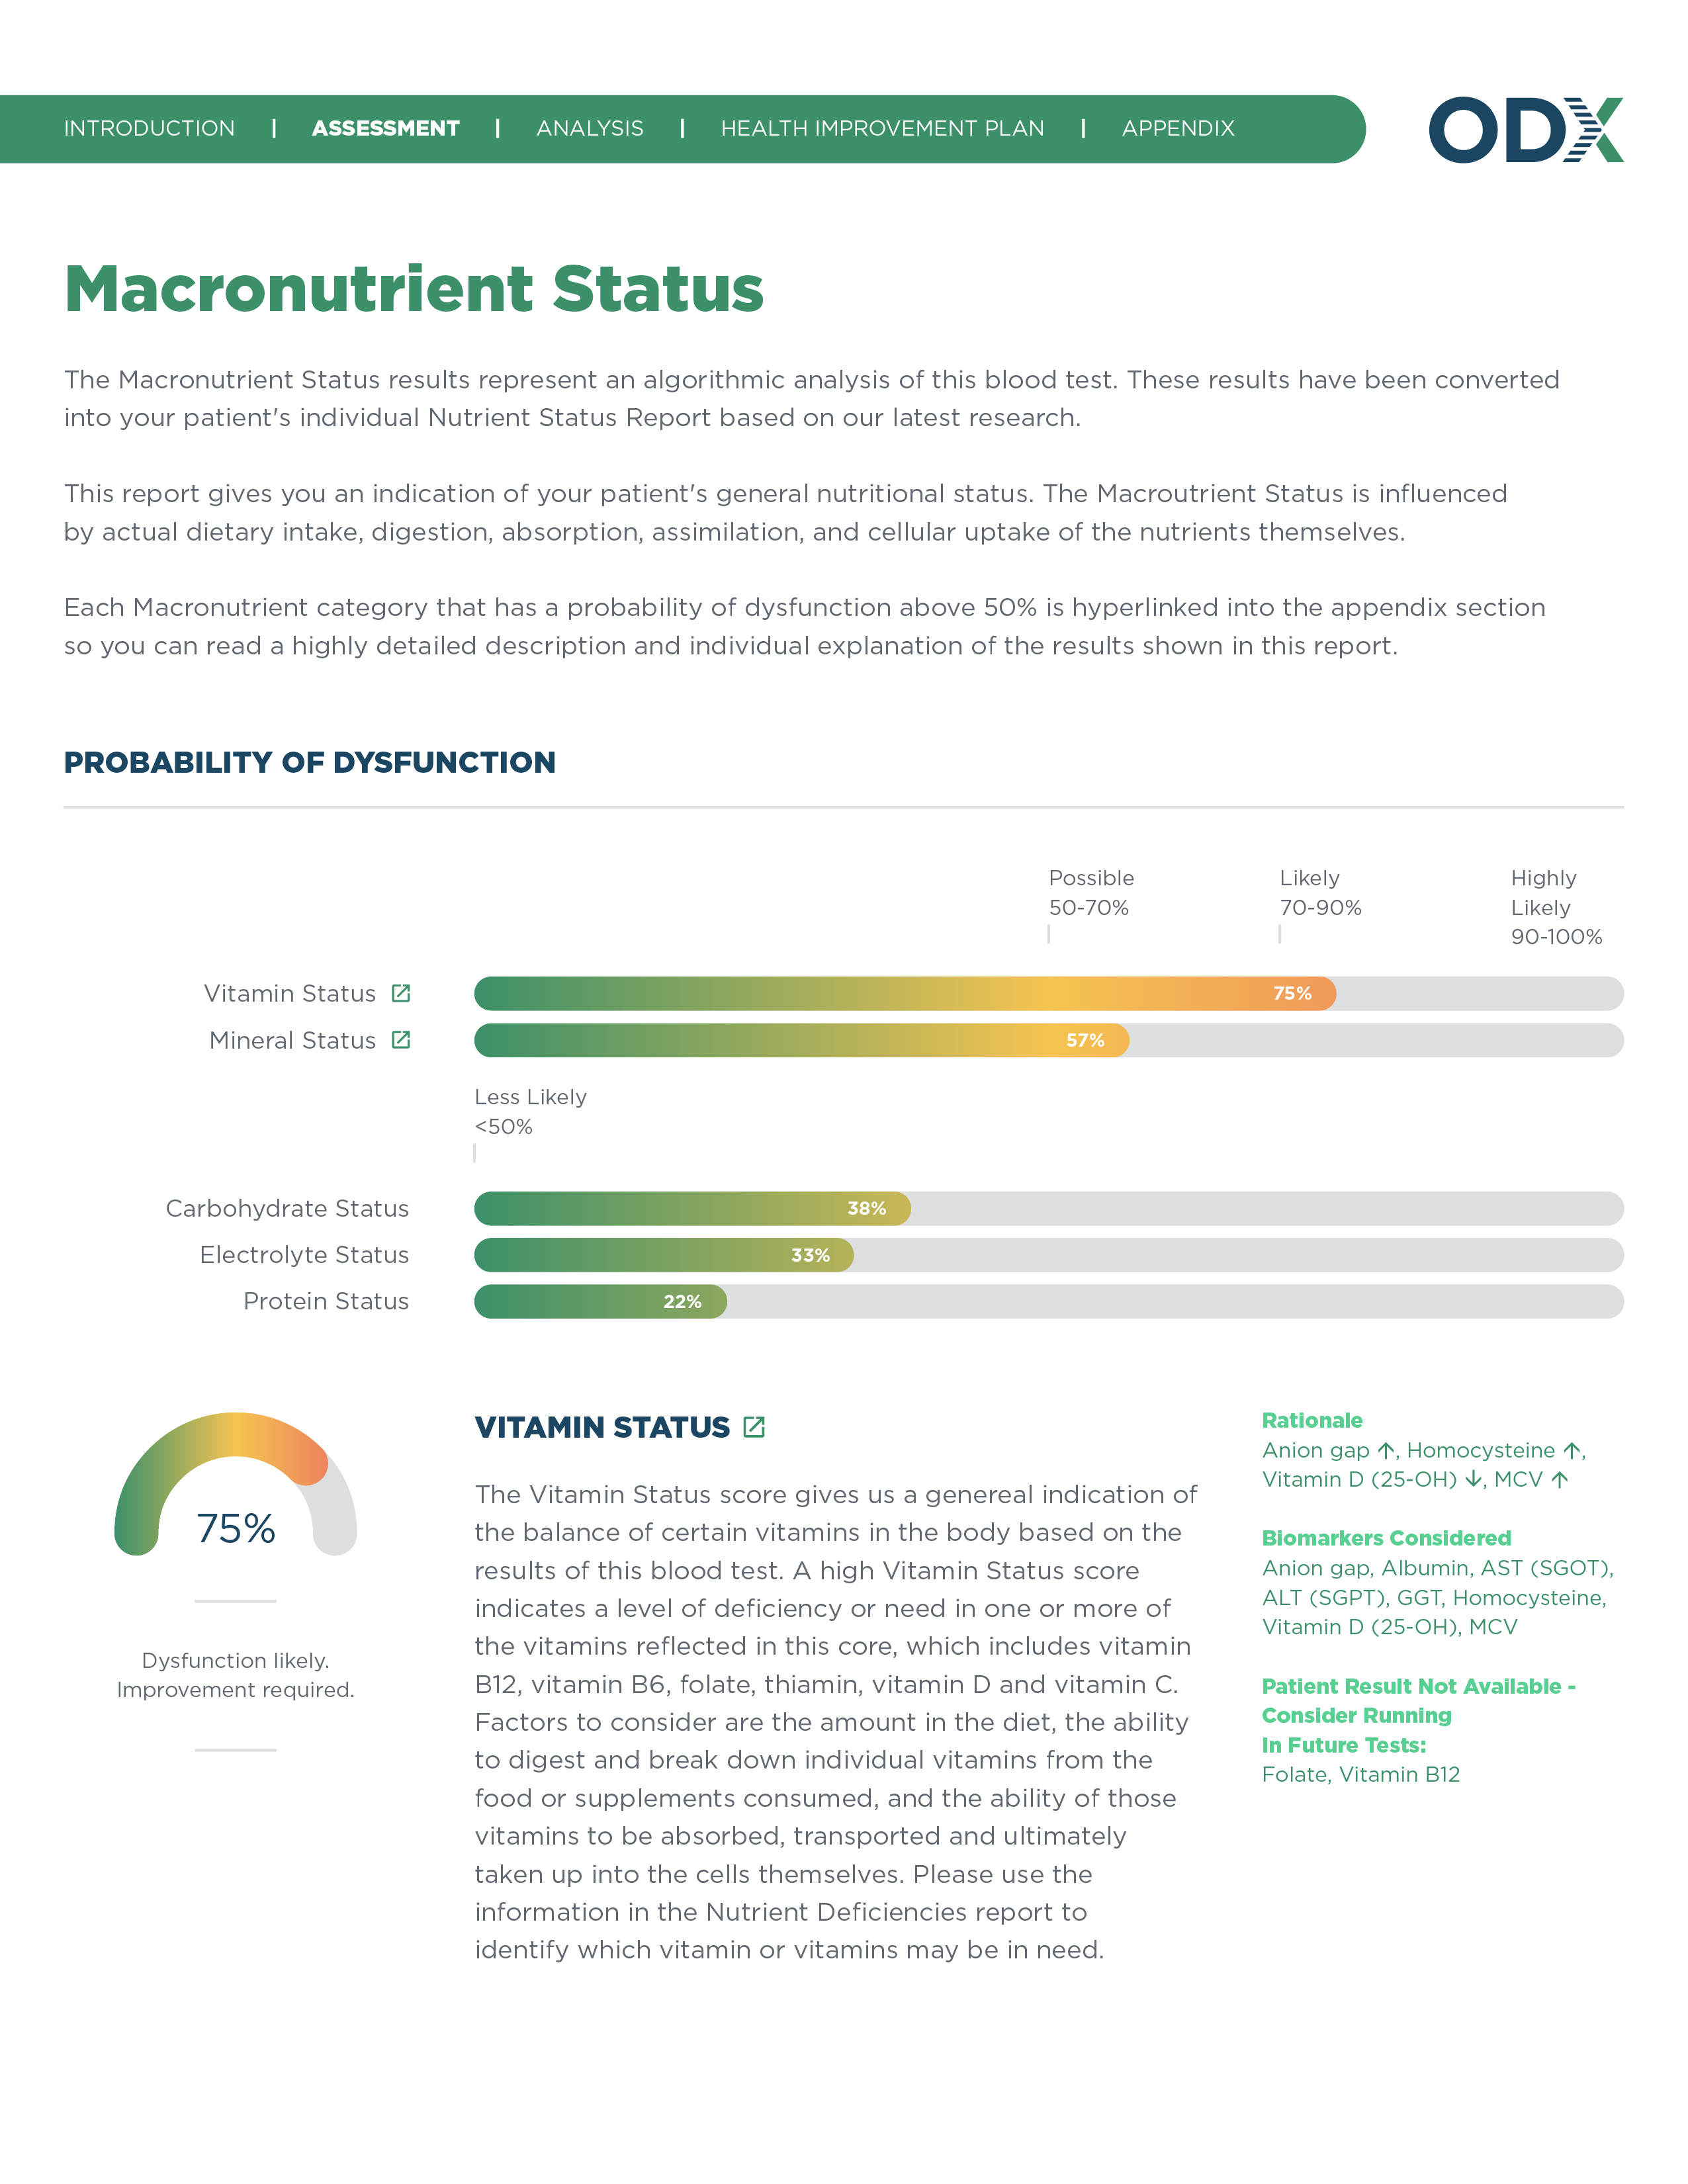
The likelihood of dysfunction in overall nutritional status and in individual domains such as vitamin, mineral and protein status: intake, digestion, absorption, assimilation and cellular uptake.
The likely degree of deficiency for each nutrient, based on the biomarkers in the patient's latest blood test.
The Clinical Dysfunctions report provides detailed descriptions and explanations of the major areas of concern surfaced by the analysis. It includes all biomarkers involved in the likely dysfunction, the reason why dysfunction is likely with this pattern of biomarkers and recommended future tests.
The Health Concerns report gives you an insight into the top areas of concern that need support. Each major area links to a detailed description and individual explanation of why it's an area of concern.
When Optimal DX finds likely dysfunction, this section suggests the areas that could benefit from further lab testing.
This report calls out important health concerns to watch for when certain biomarkers are out of range. Using it, practitioners can gain an overview of potential issues in their patients at a glance.
Provide a simple, easy-to-understand overview of the functional approach to blood chemistry analysis to your patients. With the right context, patients will more clearly see the value of their Functional Health Report.
Introduce the modules in the Functional Health Report so your patients can easily interpret and digest the information contained within.
Contextualize the Functional Health Report so that you or other practitioners are equipped with the knowledge to interpret its information.
Add your own notes to deliver alongside the Functional Health Report to your patients. You can call out important information, detail your treatment plan, explain the report further or add any information you feel is relevant to your patients’ health journey.
Now that you’ve received your patients’ blood test results, it’s time to review them with a functional lens. This report lists the results of the patients’ tests and whether or not a given biomarker is outside of the optimal range or lab range.
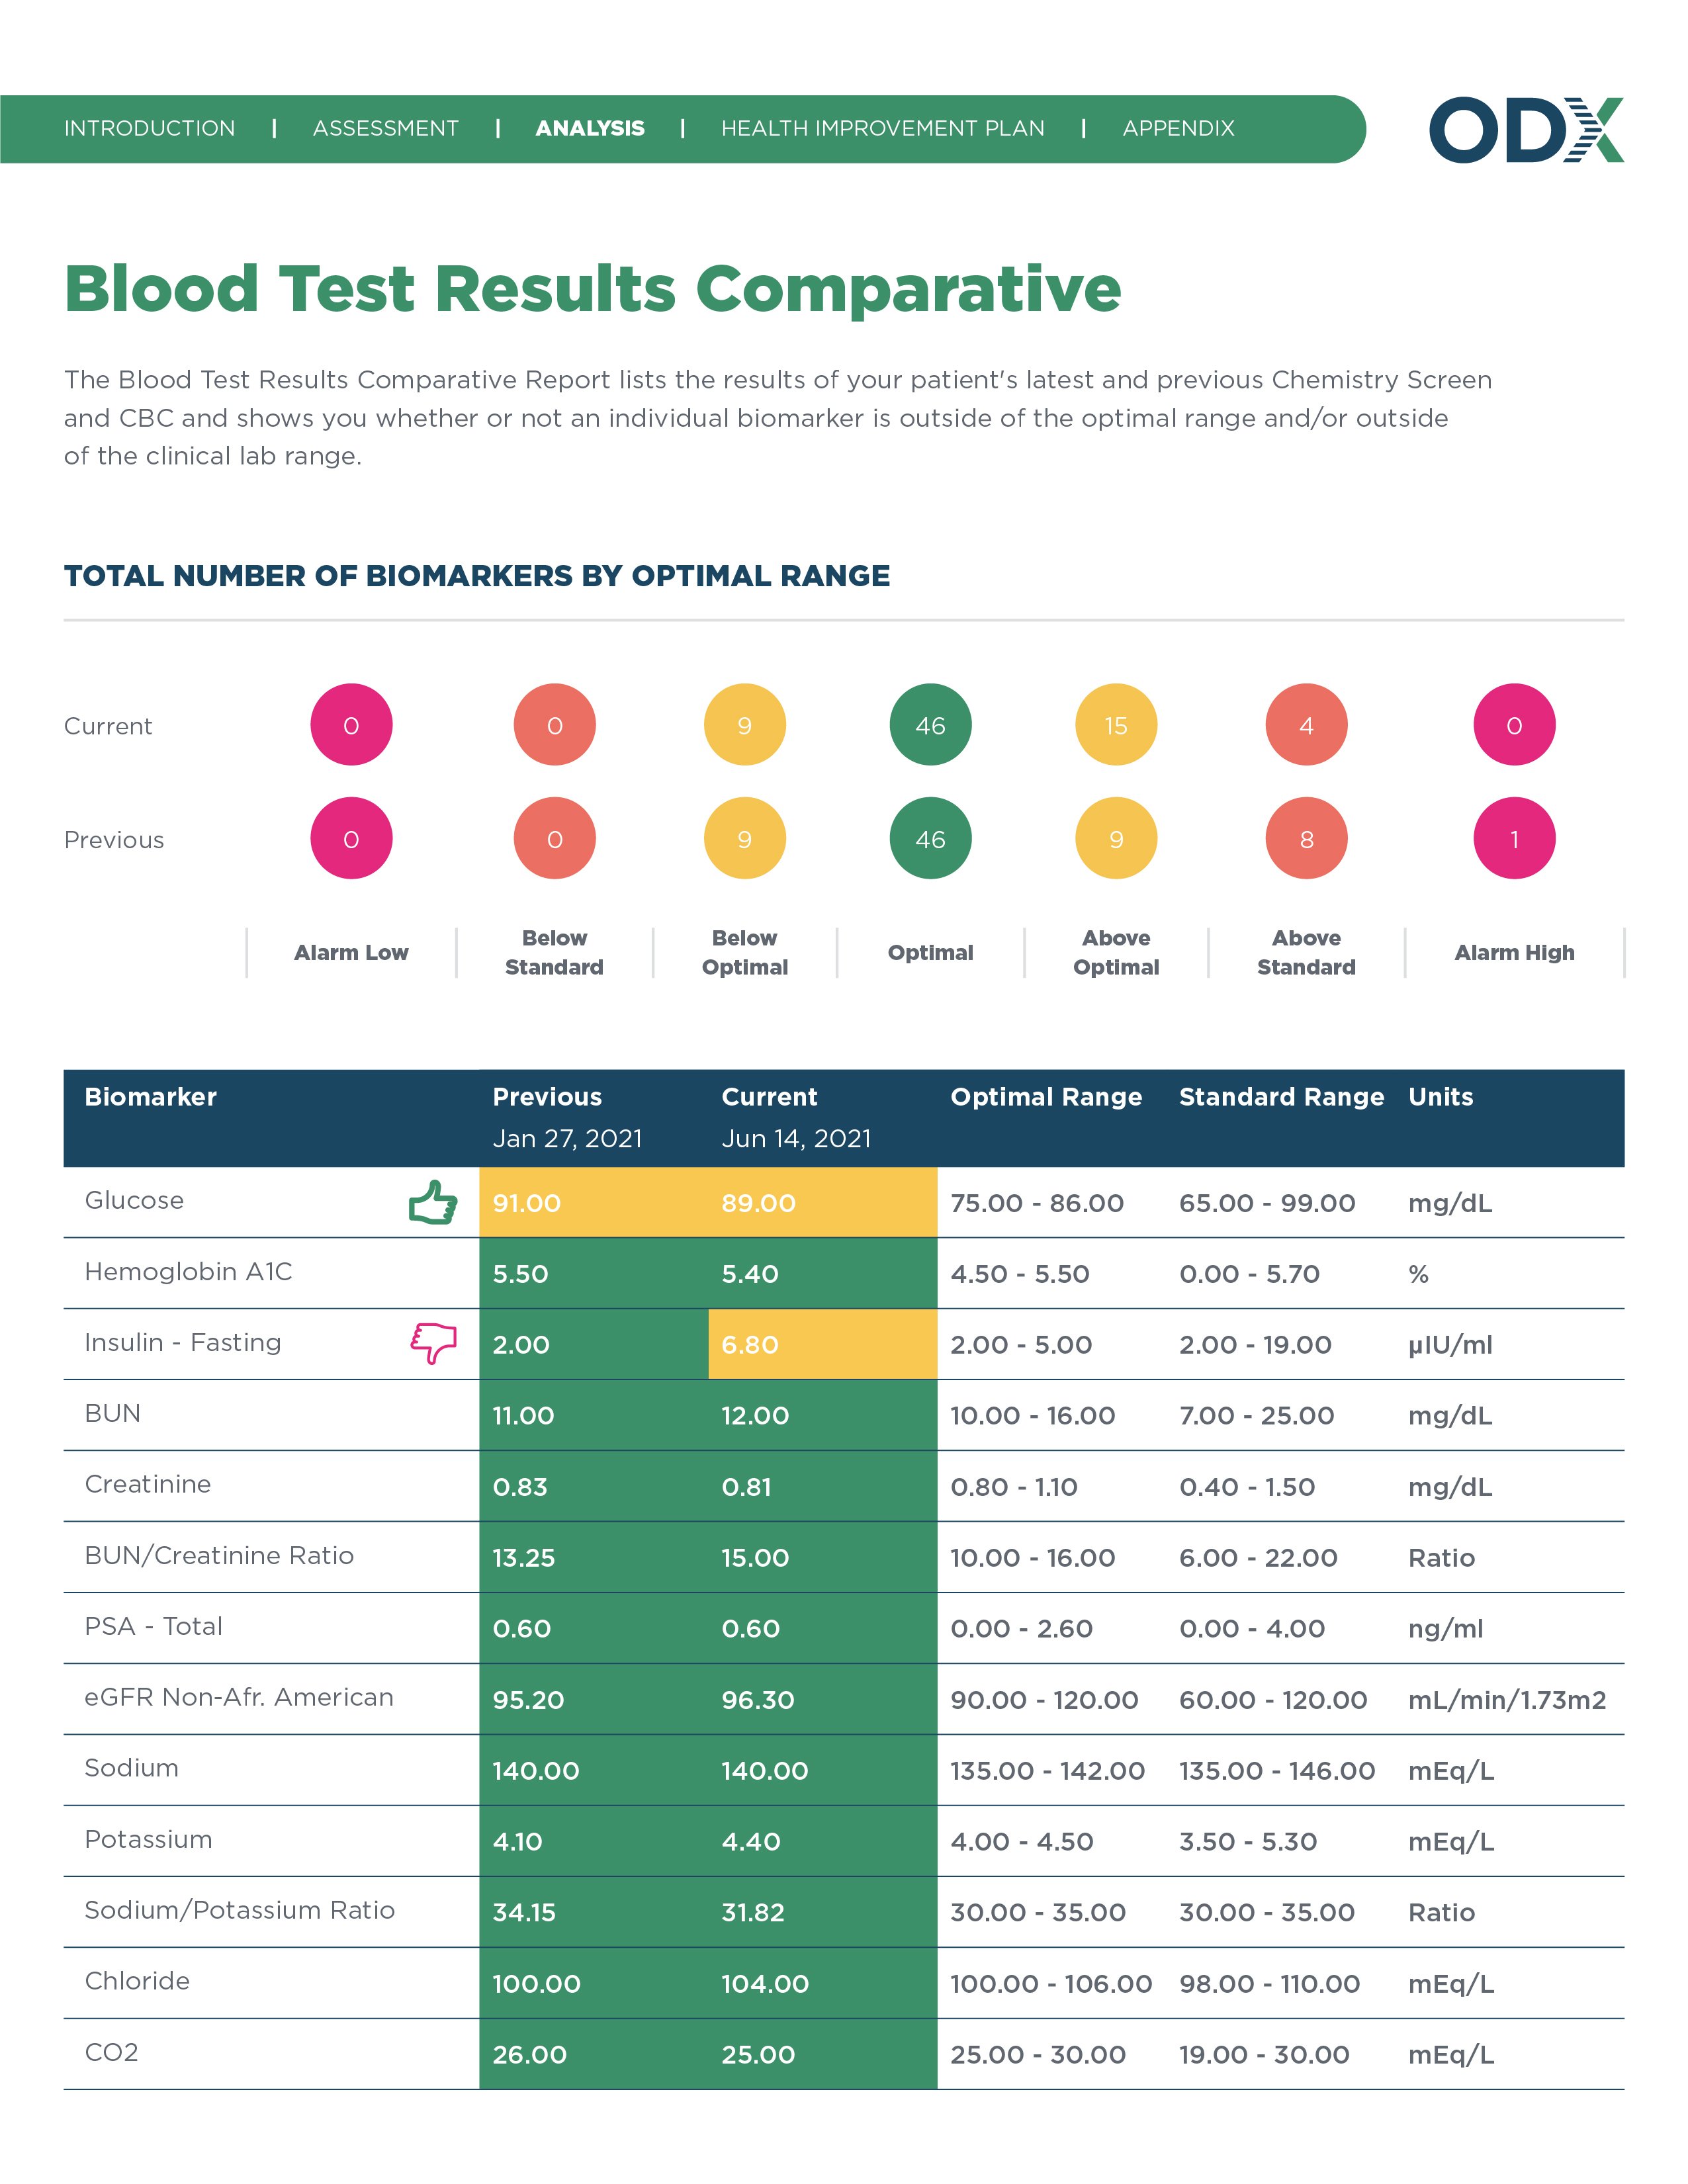
How does a patient’s most recent blood biomarker profile compare to a previous one? This report calls out major areas of change between two lab tests.
Using this report, you can quickly view which biomarkers scored farthest from the median on your patients’ blood test as expressed as a percentage score.
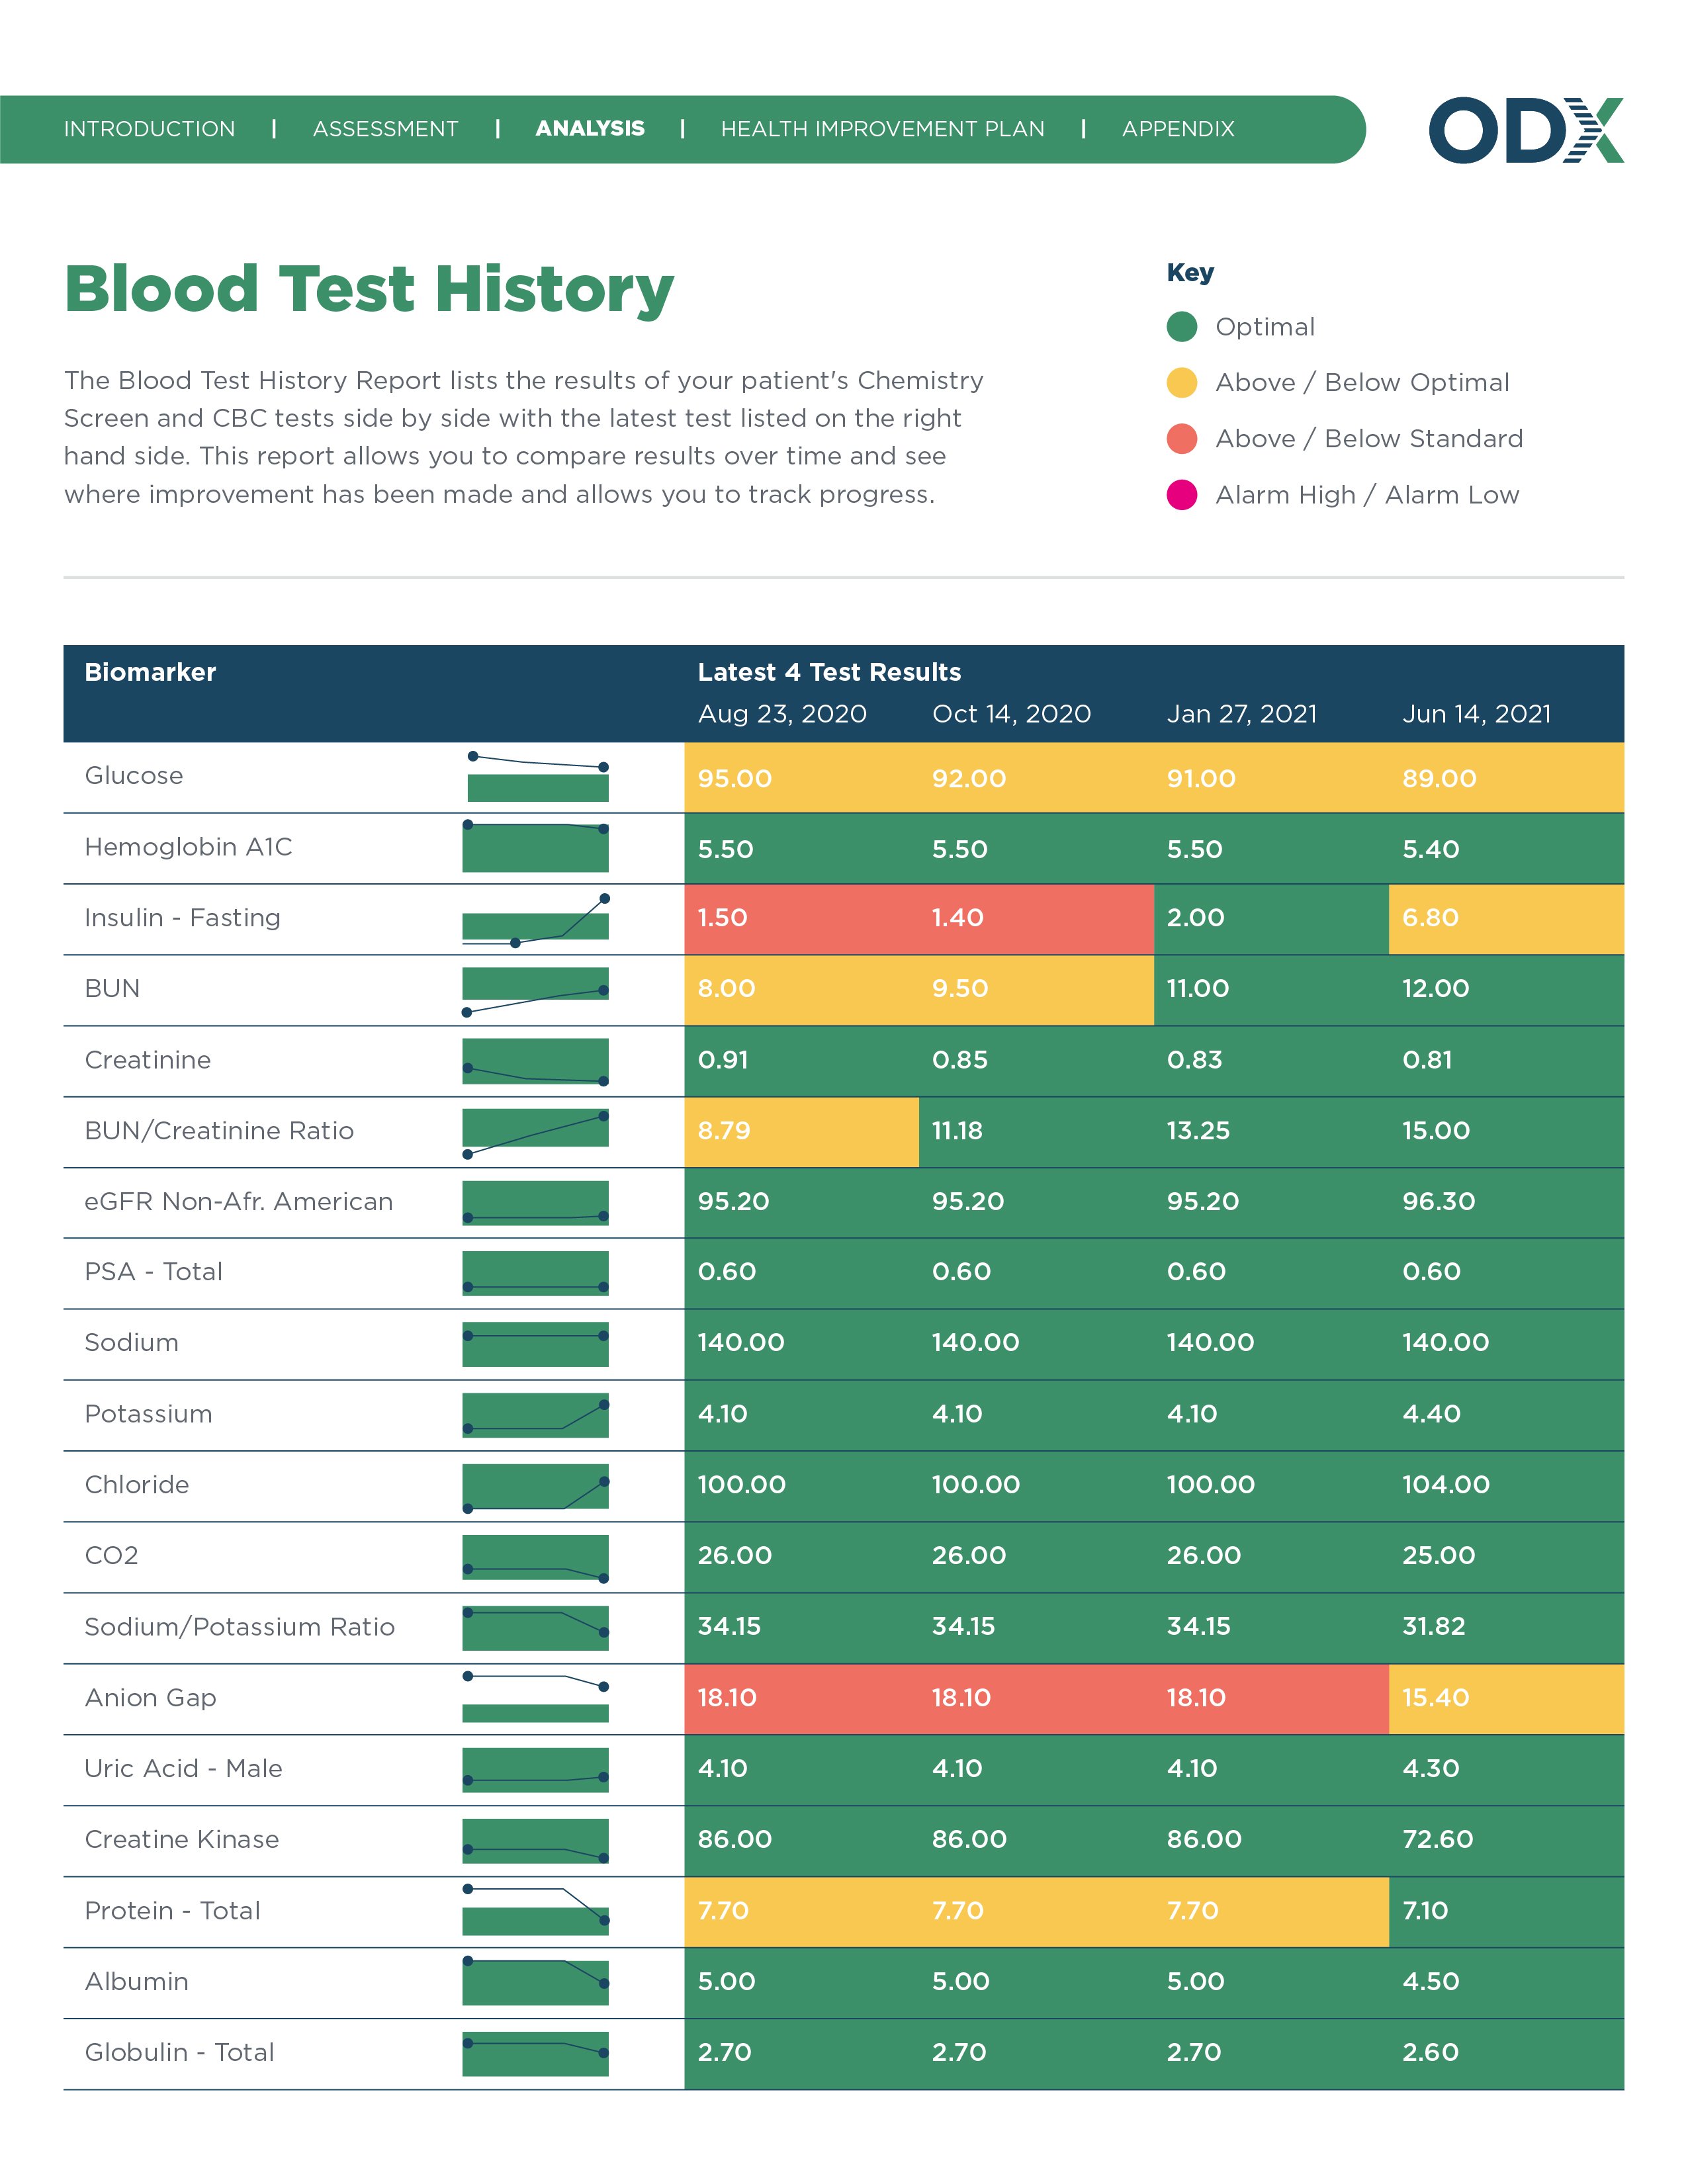
Take a broader view of your patients’ progress over time using the Blood Test History report. This report shows the past 6 blood tests side by side, graphing biomarker change over time.
Every biomarker outside its optimal range, at a glance. Optimal DX adds a short description of why each one may be elevated or decreased.
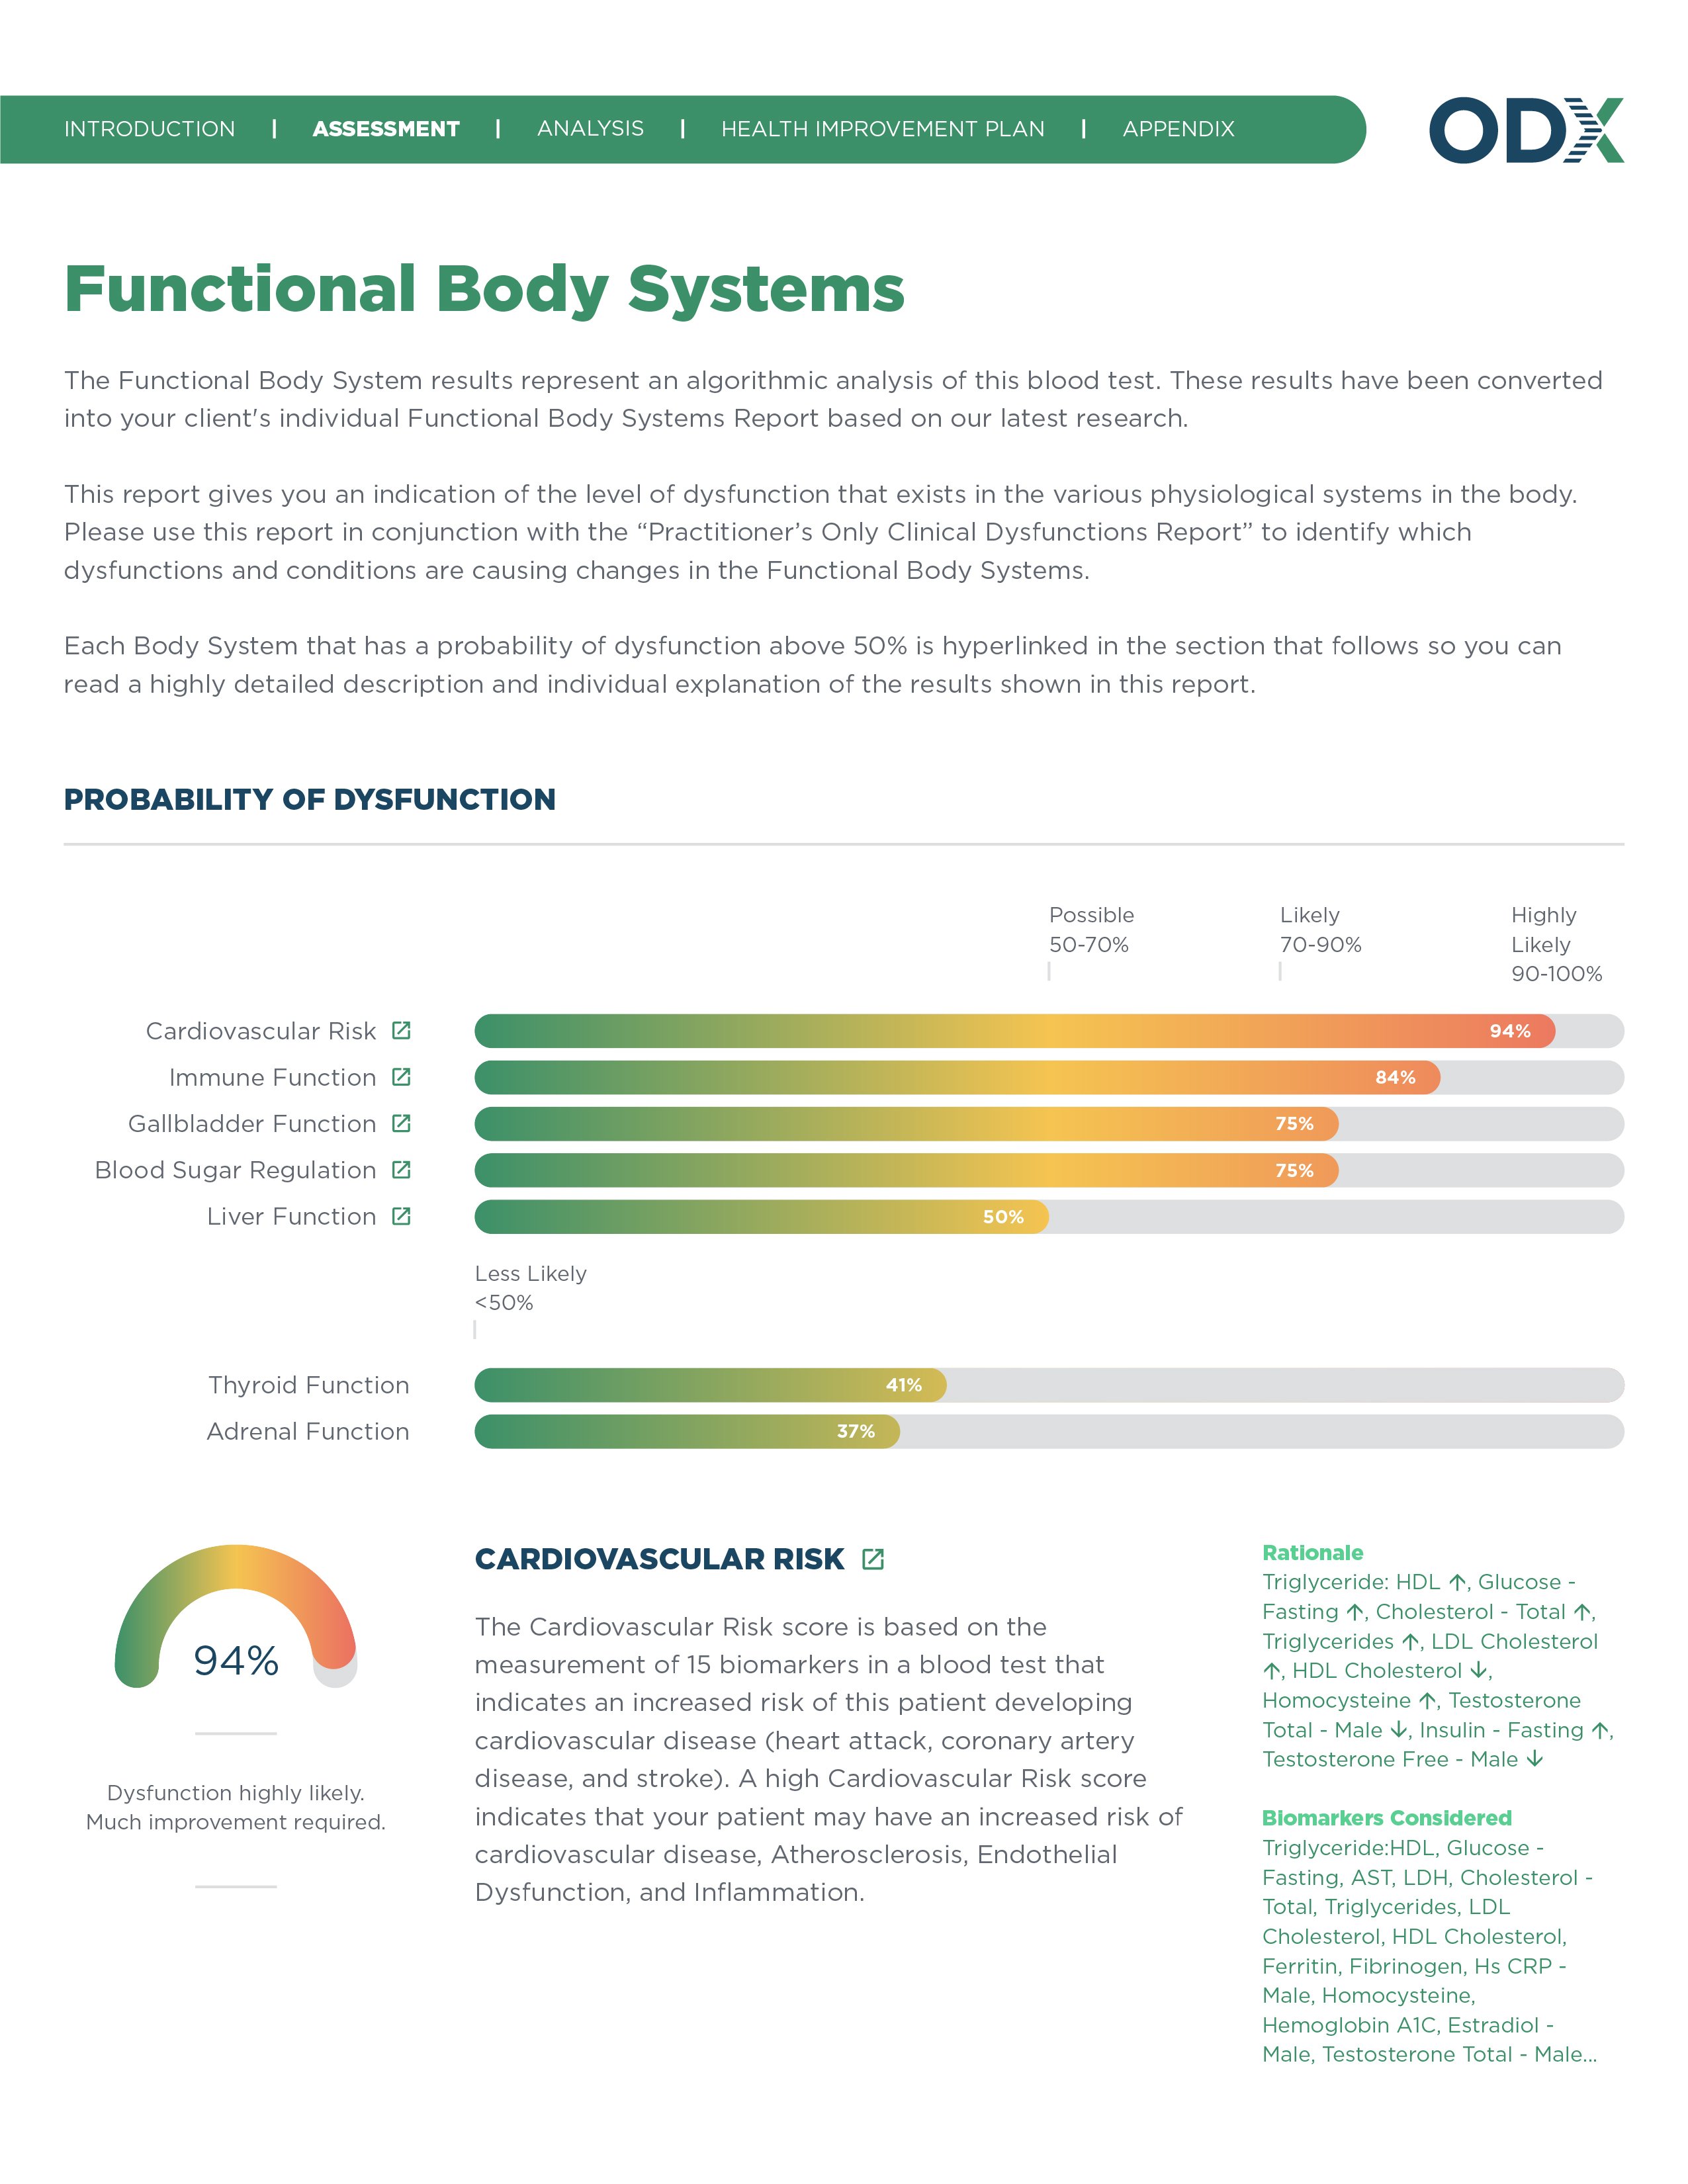
View an algorithmically derived assessment of dysfunction risk for each major functional body system — such as the immune, cardiovascular and others — based on the data from your patients’ latest blood test results.
View an algorithmic analysis of the probability of dysfunction for each accessory functional system — such as inflammatory, acid-base and others — based on the data from your patients’ latest blood test results.
The likelihood of dysfunction in overall nutritional status and in individual domains such as vitamin, mineral and protein status: intake, digestion, absorption, assimilation and cellular uptake.
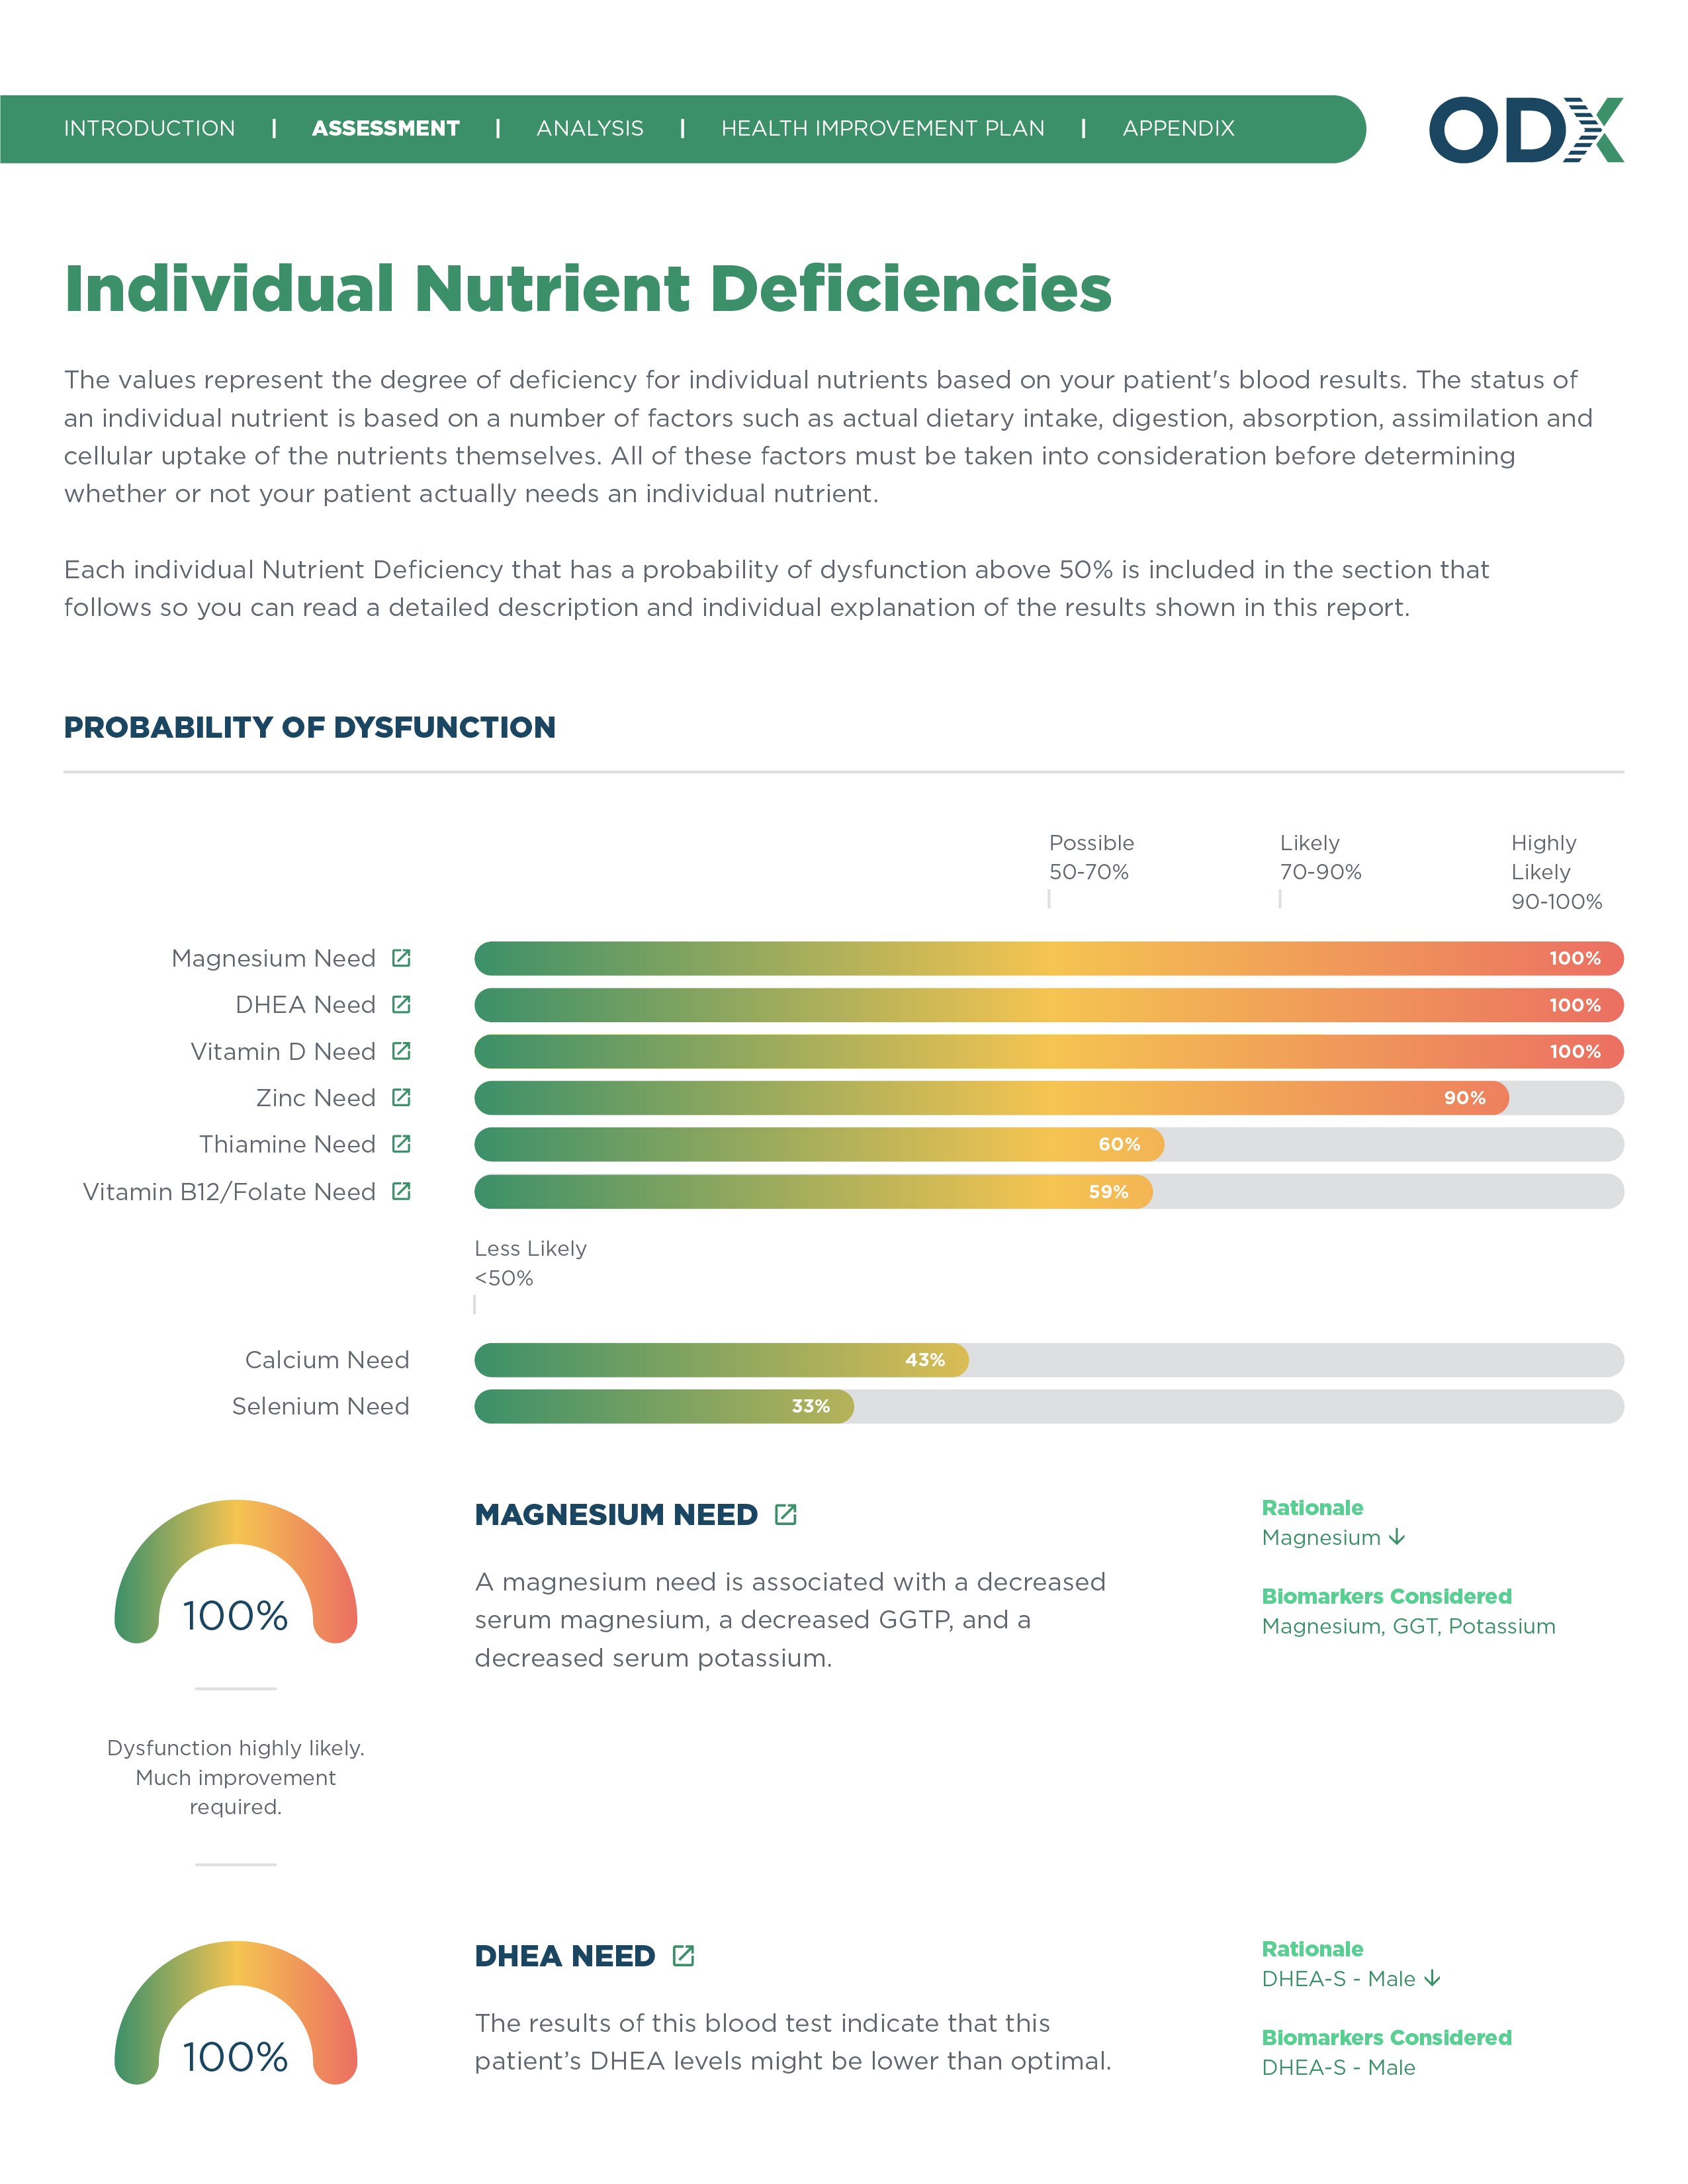
The likely degree of deficiency for each nutrient, based on the biomarkers in the patient's latest blood test.
The Clinical Dysfunctions report provides detailed descriptions and explanations of the major areas of concern surfaced by the analysis. It includes all biomarkers involved in the likely dysfunction, the reason why dysfunction is likely with this pattern of biomarkers and recommended future tests.
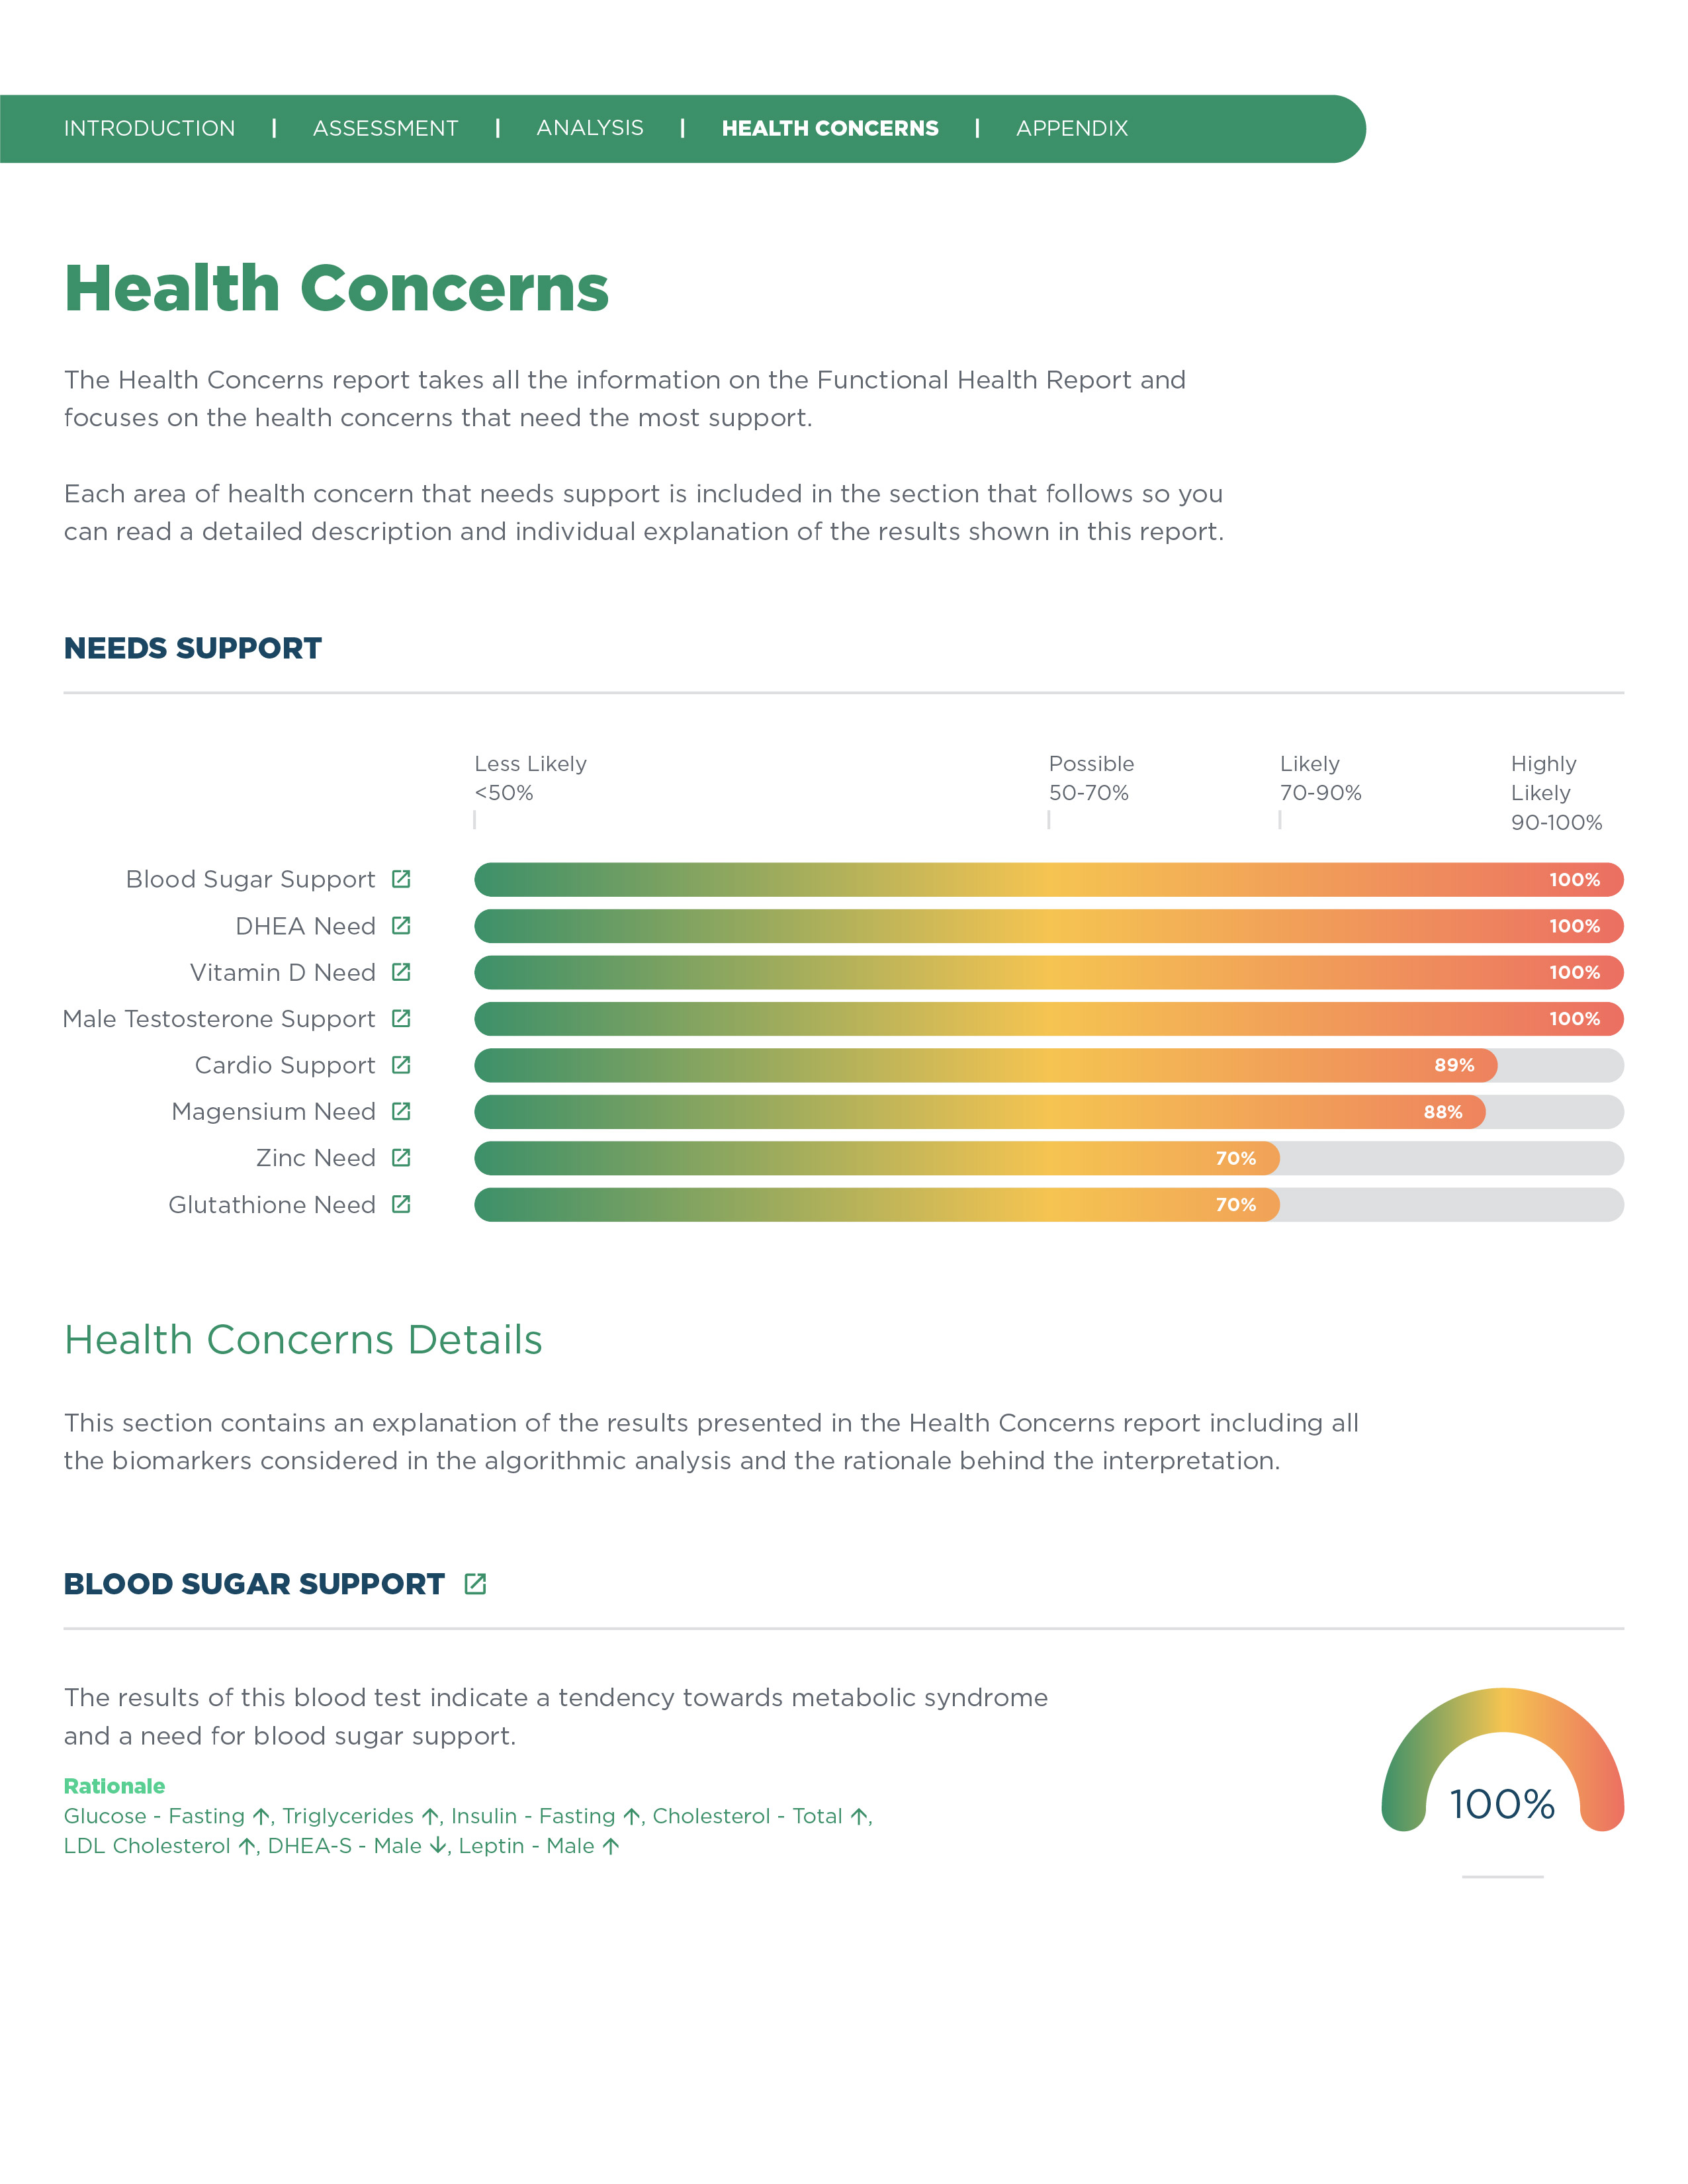
The Health Concerns report gives you an insight into the top areas of concern that need support. Each major area links to a detailed description and individual explanation of why it's an area of concern.
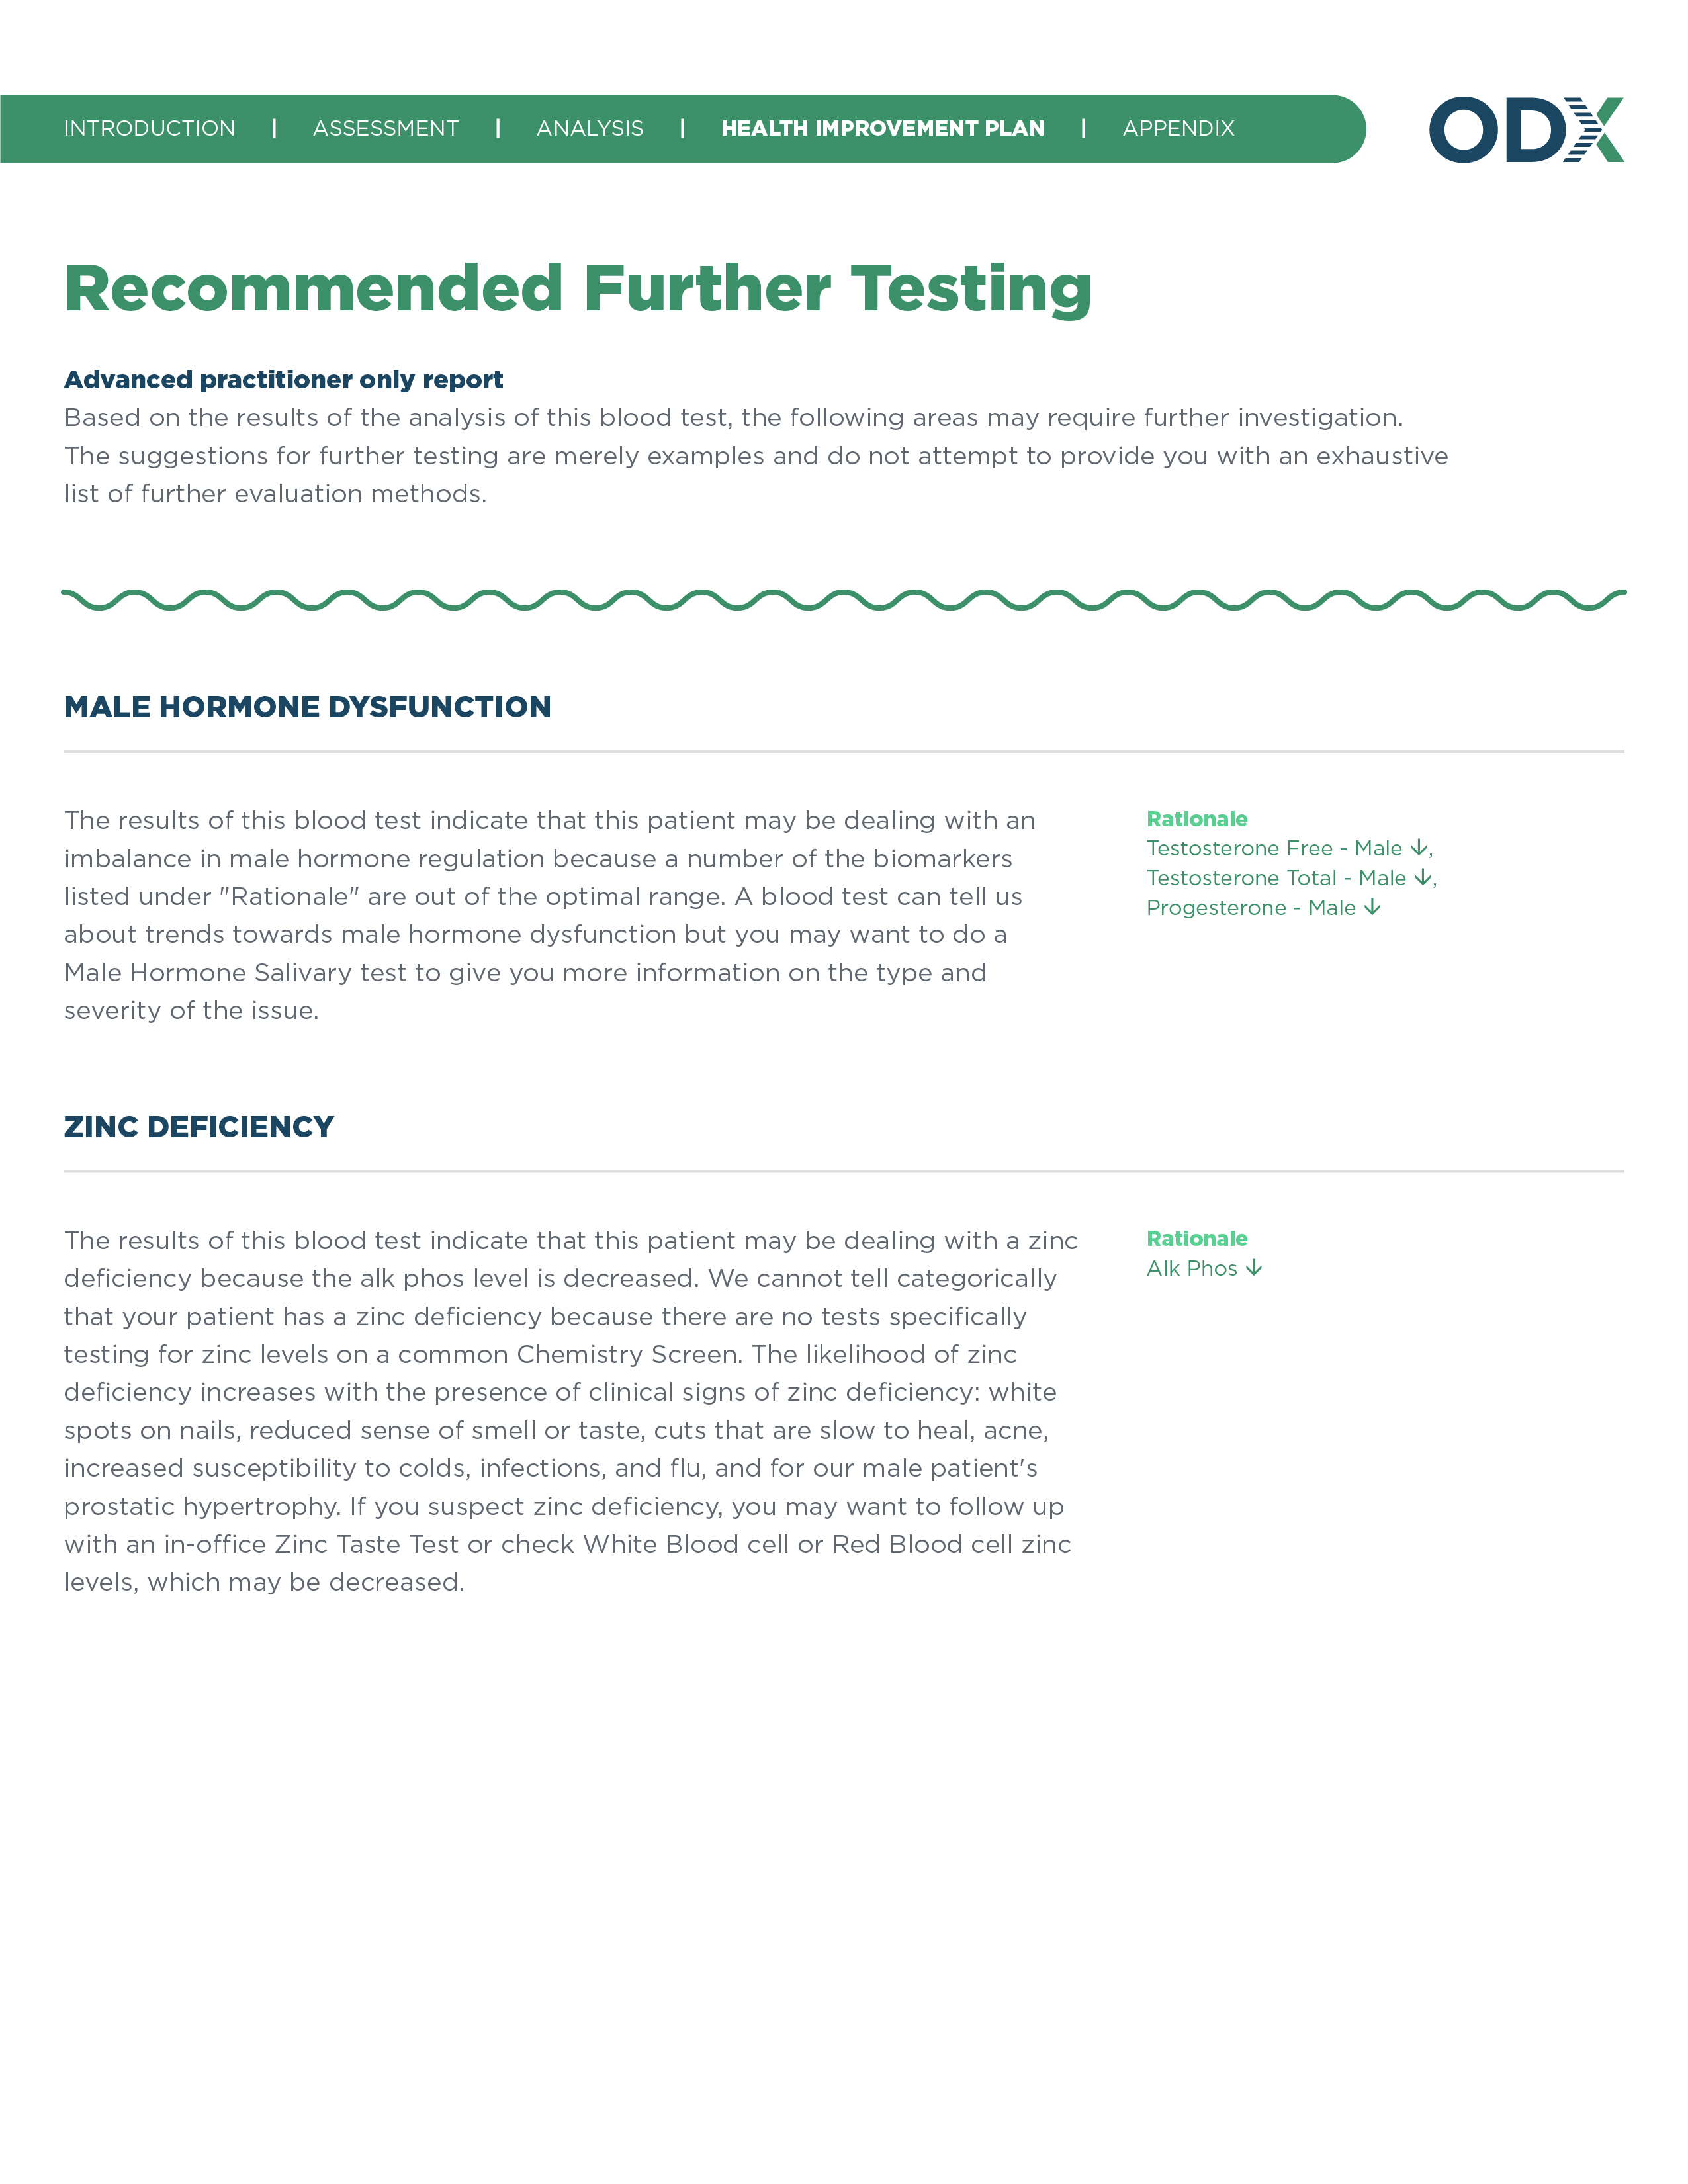
When Optimal DX finds likely dysfunction, this section suggests the areas that could benefit from further lab testing.
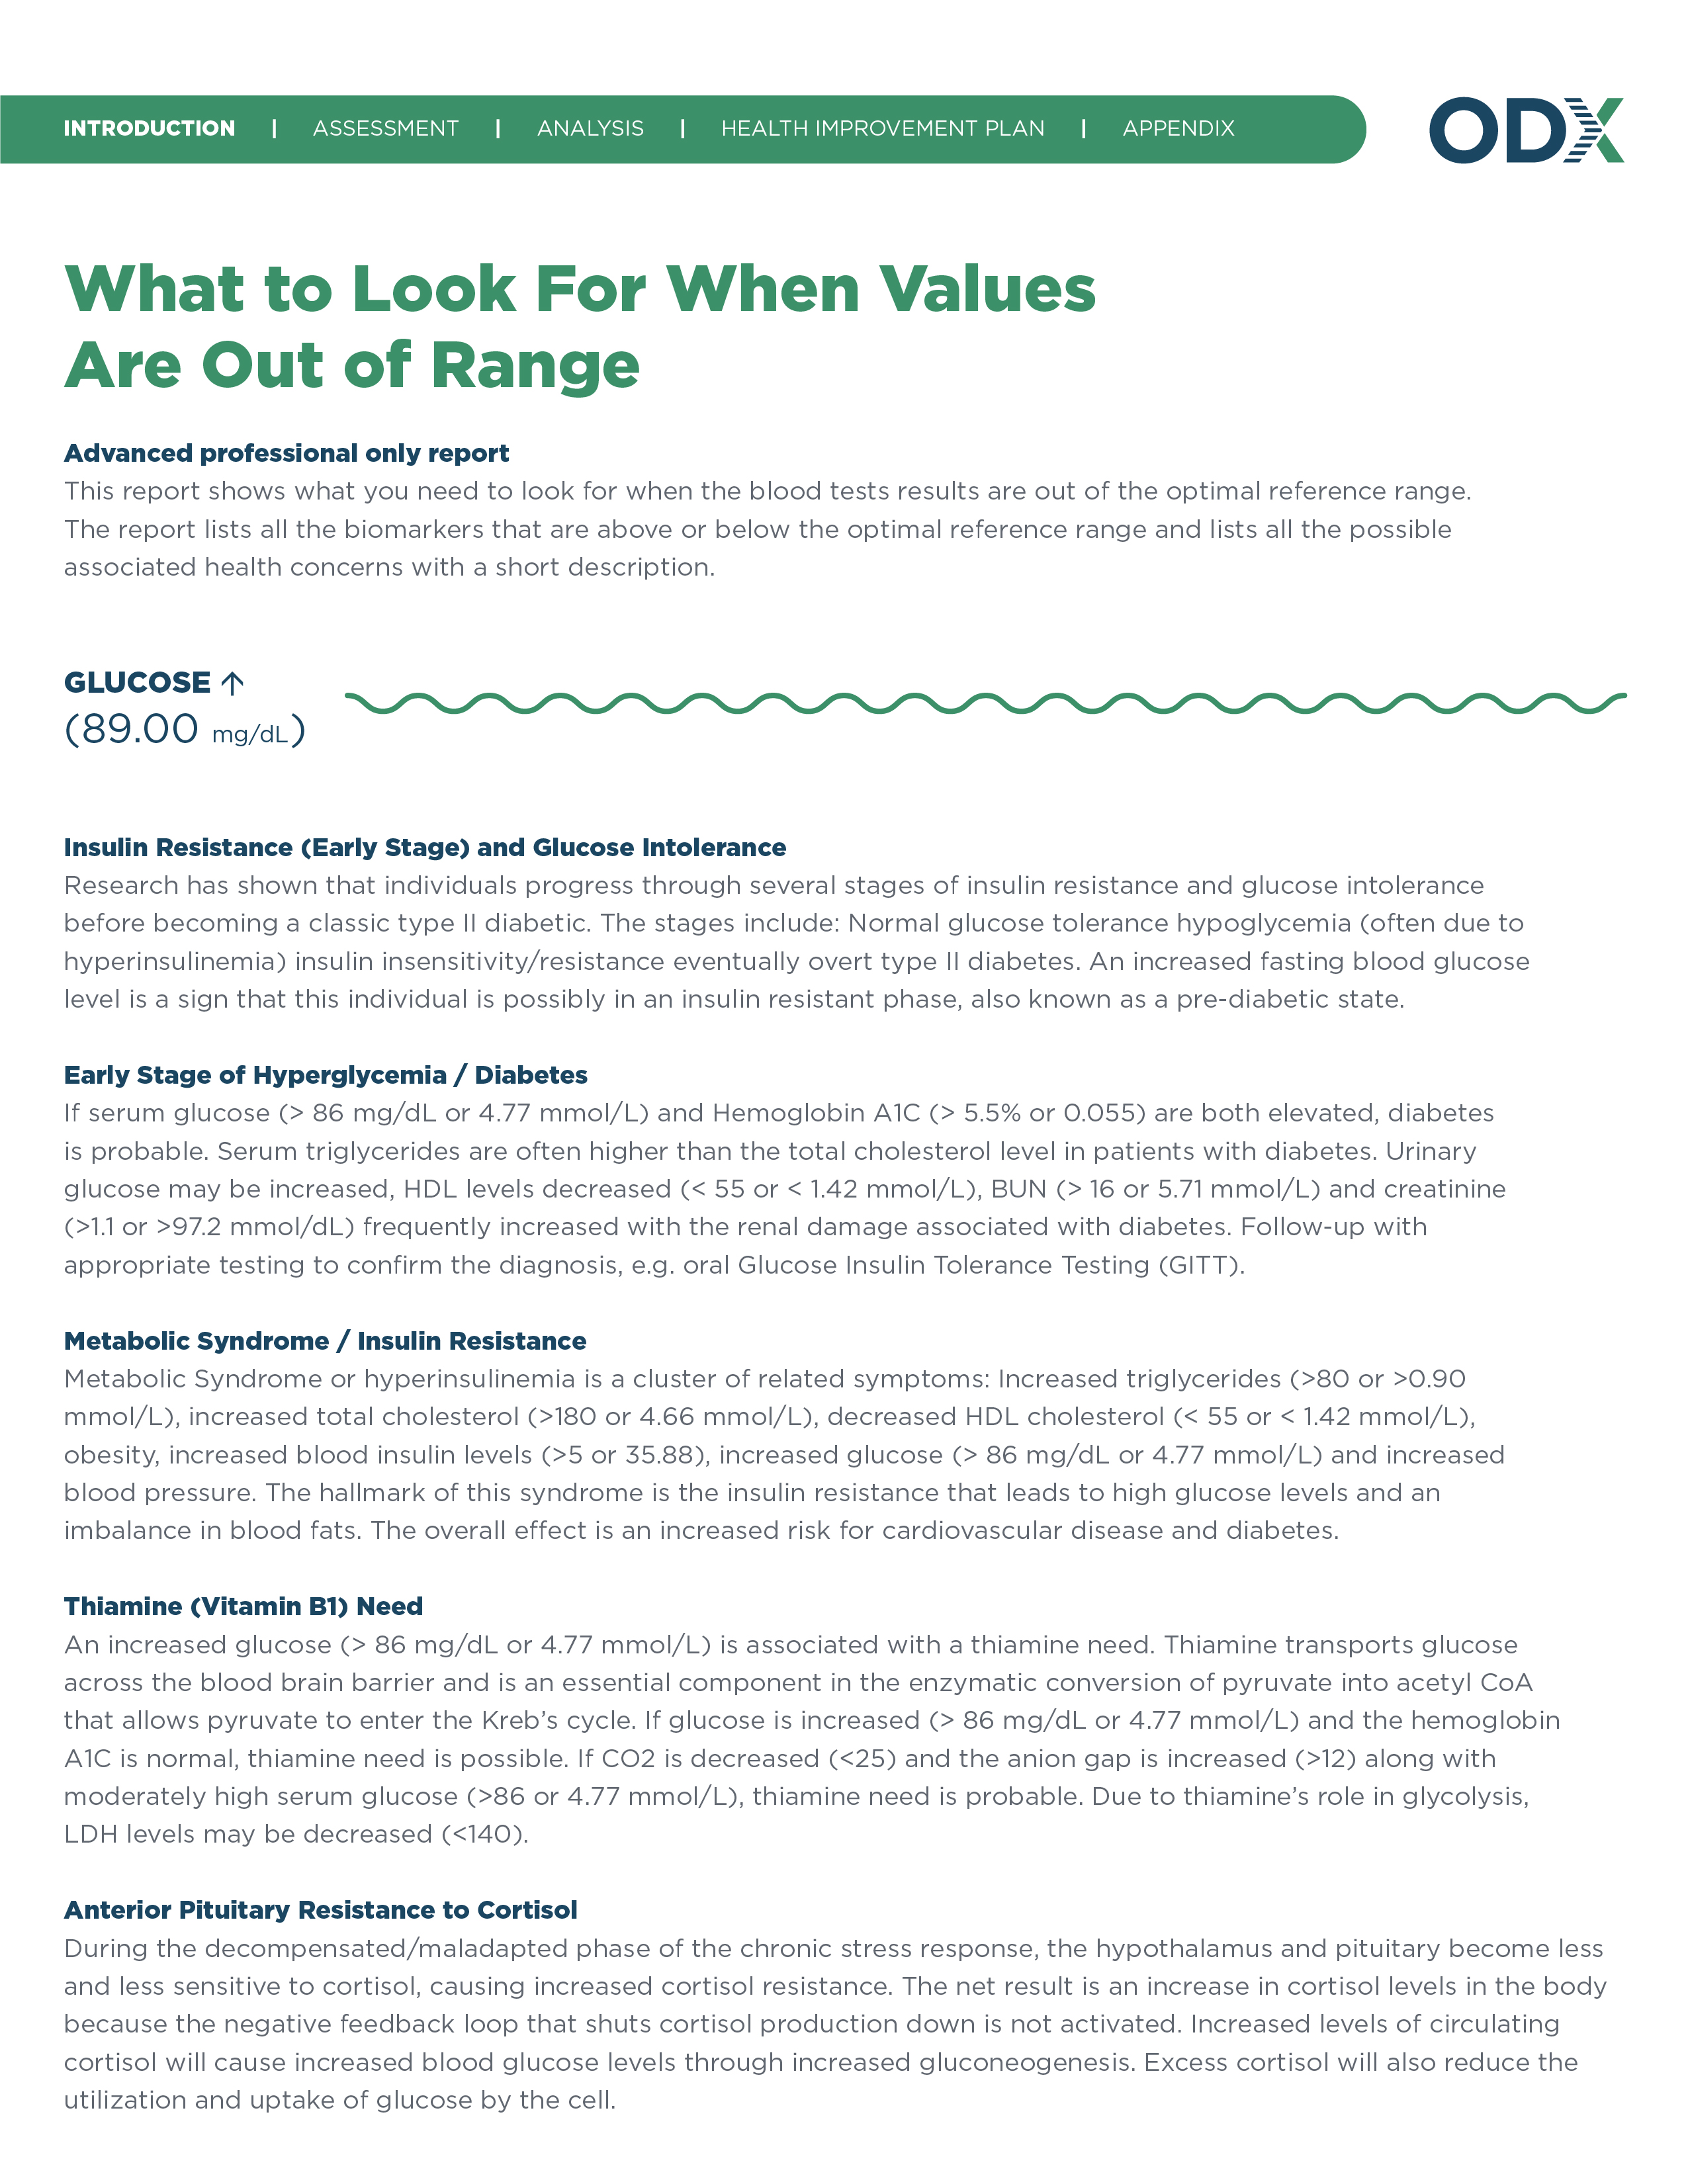
This report calls out important health concerns to watch for when certain biomarkers are out of range. Using it, practitioners can gain an overview of potential issues in their patients at a glance.
Optimal DX is Functional Blood Chemistry Analysis software built for Functional Medicine practitioners, with users in 84 countries. It scores a standard blood panel against standard and optimal ranges, scores patterns by body system, and produces a Functional Health Report in a practitioner version and a patient version.
Optimal DX scores every biomarker against 2 ranges: a standard range, drawn mainly from Quest Diagnostics with Labcorp ranges added where appropriate, and an Optimal DX optimal range. It then scores patterns across related biomarkers and reports each body system, accessory system and clinical dysfunction as Dysfunction Possible, Likely or Highly Likely.
Optimal DX optimal ranges come from Dr. Dicken Weatherby's research and clinical experience in Functional Blood Chemistry Analysis since 1998. The research behind each range is published with references in the online ODX Biomarker Guide, which covers more than 200 biomarkers.
Optimal DX reads lab PDFs from Labcorp, Quest and more than 100 other labs worldwide, free on every account. Blood Chemistry Unlimited adds direct lab connections, so results import without a PDF.
In Dr. Dicken Weatherby's own use, Optimal DX takes a lab PDF to a finished Functional Health Report and treatment plan in well under 15 minutes. The PDF parser enters the results in seconds. Reviewing a full panel by hand takes 25 to 40 minutes in his experience teaching FBCA.
No. Optimal DX presents FBCA as an assessment tool to be used with the patient's history, symptoms and changes in blood chemistry over time.
An Optimal DX account is free, with no card at signup. A Functional Health Report costs 10 credits ($50), and bulk credit packs bring it down to $40. Credits never expire. Blood Chemistry Unlimited is $197 a month for unlimited reports.
Functional Medicine practitioners in 84 countries use Optimal DX to interpret blood chemistry and build treatment plans.
“For me, the blood chemistry software is the centerpiece of my guidance system and helps people to understand what it is that’s really going on with their physiology and helps me to work my way through the decision-making relative to that.”
Dr. Brad RachmanMedical Director of the Rachman Clinic
Read His Story