

By Dr. Dicken Weatherby, ND, founder of Optimal DX
Functional Medicine practices struggle with blood chemistry interpretation for 4 reasons. Standard reference intervals are built to detect disease. Single biomarkers mislead when they're read without their related markers. Manual review of a full panel takes too long. And few practitioners have formal training in functional interpretation. Optimal DX built its optimal ranges, its pattern scoring and the Functional Health Report to address each one.
I took my first training in Functional Blood Chemistry Analysis (FBCA) in 1996 and have worked in the field since I graduated in 1998. In 2002 I published Blood Chemistry and CBC Analysis: Clinical Laboratory Testing from a Functional Perspective, and I've since trained thousands of practitioners worldwide in the method. It's the method Optimal DX uses today with practitioners in 84 countries.
FBCA reads a standard blood panel for early changes in physiology, before those changes meet the criteria for a diagnosis.
Optimal DX defines an optimal range as a narrow band of upper and lower limits that correspond to optimally healthy levels of a biomarker.[5] A standard range tells you whether a result is consistent with pathology. An optimal range tells you whether the result sits where a healthy body keeps it. You need both, and the Functional Health Report shows both for every biomarker.
Labs typically set a reference interval as the central 95% of results from a reference population.[1] By design, 1 healthy person in 20 falls outside it. A result inside it means the patient resembles that population, and that's all it means.
Intervals also differ between labs. In a survey of 163 clinical laboratories, about half had run their own study of healthy adults to validate adult intervals, and many adopted the manufacturer's interval without on-site testing. In some cases, 2 labs' intervals for the same test didn't overlap: a hemoglobin of 13.8 g/dL in a woman was "low" at one lab and "high" at another.[2]
The standard ranges in Optimal DX come mainly from Quest Diagnostics.[3] Optimal DX also adds or adjusts standard ranges where that's appropriate. Labcorp is the main example: many Optimal DX users test through Labcorp, so Labcorp ranges appear in their Functional Health Reports. Quest and Labcorp are the 2 largest national reference labs in the United States.[17] Optimal DX optimal ranges don't shift with the prevalence of disease in a population or with geography.[3]
Read alone, most biomarkers have several possible explanations. Read with their related markers, the list gets shorter.
Iron is a good example. Serum ferritin is the test best able to separate iron deficiency from other disorders. Serum iron falls with inflammation as well as with deficiency, and mean corpuscular volume (MCV) drops late.[6][7] A low serum iron alongside a low ferritin fits depleted stores. A low serum iron with ferritin in range and a raised hs-CRP points toward inflammation, which is a different conversation with the patient.
Glucose regulation is another. Elevated triglycerides with low HDL cholesterol is a recognized surrogate marker for insulin resistance, so it's worth reading alongside fasting insulin and HbA1c even when fasting glucose is in range.[8] The triglyceride-to-HDL ratio performs differently across ethnic groups, so treat it as one input among several.[9]
This is the reason Optimal DX scores patterns. The Functional Body Systems section of the Functional Health Report shows the likely level of dysfunction in each body system, and its detail pages list every biomarker the algorithm considered and the reasoning behind the result.[10]
Done by hand, the work is: transcribe values from the lab PDF, check each one against 2 ranges, find the patterns, then write it up for the patient. In my experience teaching FBCA, that takes 25 to 40 minutes for a comprehensive panel, and transcription is where most entry errors come from.
The Optimal DX PDF parser reads lab reports from Labcorp, Quest and more than 100 other labs worldwide and enters the results into the patient's record in seconds. It's free on every Optimal DX account. You check the imported values, run the report, and review it in the platform before the patient sees it.
In my experience teaching FBCA, most practitioners learned lab interpretation in school as a tool for detecting disease, and came to functional interpretation later through continuing education. Two practitioners using optimal ranges from different sources can read the same panel and reach different conclusions.
The Optimal DX FBCA Mastery Certification teaches one consistent method: 12 core training modules covering more than 100 biomarkers.[11] NANP lists it at 35 CECs.[12]
Optimal DX optimal ranges come from my research and clinical experience. The method is to catalog, biomarker by biomarker, the levels that research associates with health, or at least with the absence of disease.[3] The white paper What Is Optimal? sets out the rationale with more than 130 references.[13] The research behind each range is published in the online ODX Biomarker Guide, which covers more than 200 biomarkers and lists the references for each one.[14] Inside the platform, every biomarker also has a full research article in the Optimal DX Resource Center.
Fasting glucose shows how the 2 ranges work together. The Optimal DX optimal range is 75 to 86 mg/dL, inside a standard range of 65 to 99 mg/dL.[14] A fasting glucose of 95 mg/dL passes the standard range and sits above optimal, so the report flags it and reads it with insulin, HbA1c and triglycerides.
Homocysteine is another. Optimal DX uses an optimal range of 5 to 7.2 µmol/L against a standard range of 0 to 10.3 µmol/L.[5] Elevated homocysteine can reflect insufficient vitamin B6, B12, riboflavin or folate, so it's worth reading with the B-vitamin markers.[15]
An optimal range isn't always narrower than the standard range. When the research doesn't support a separate optimal range, Optimal DX keeps the 2 ranges the same: transferrin is 188 to 341 mg/dL for both. And for apolipoprotein A-1, the optimal range of 150 to 214 mg/dL runs above the standard range of 115 to 178 mg/dL.
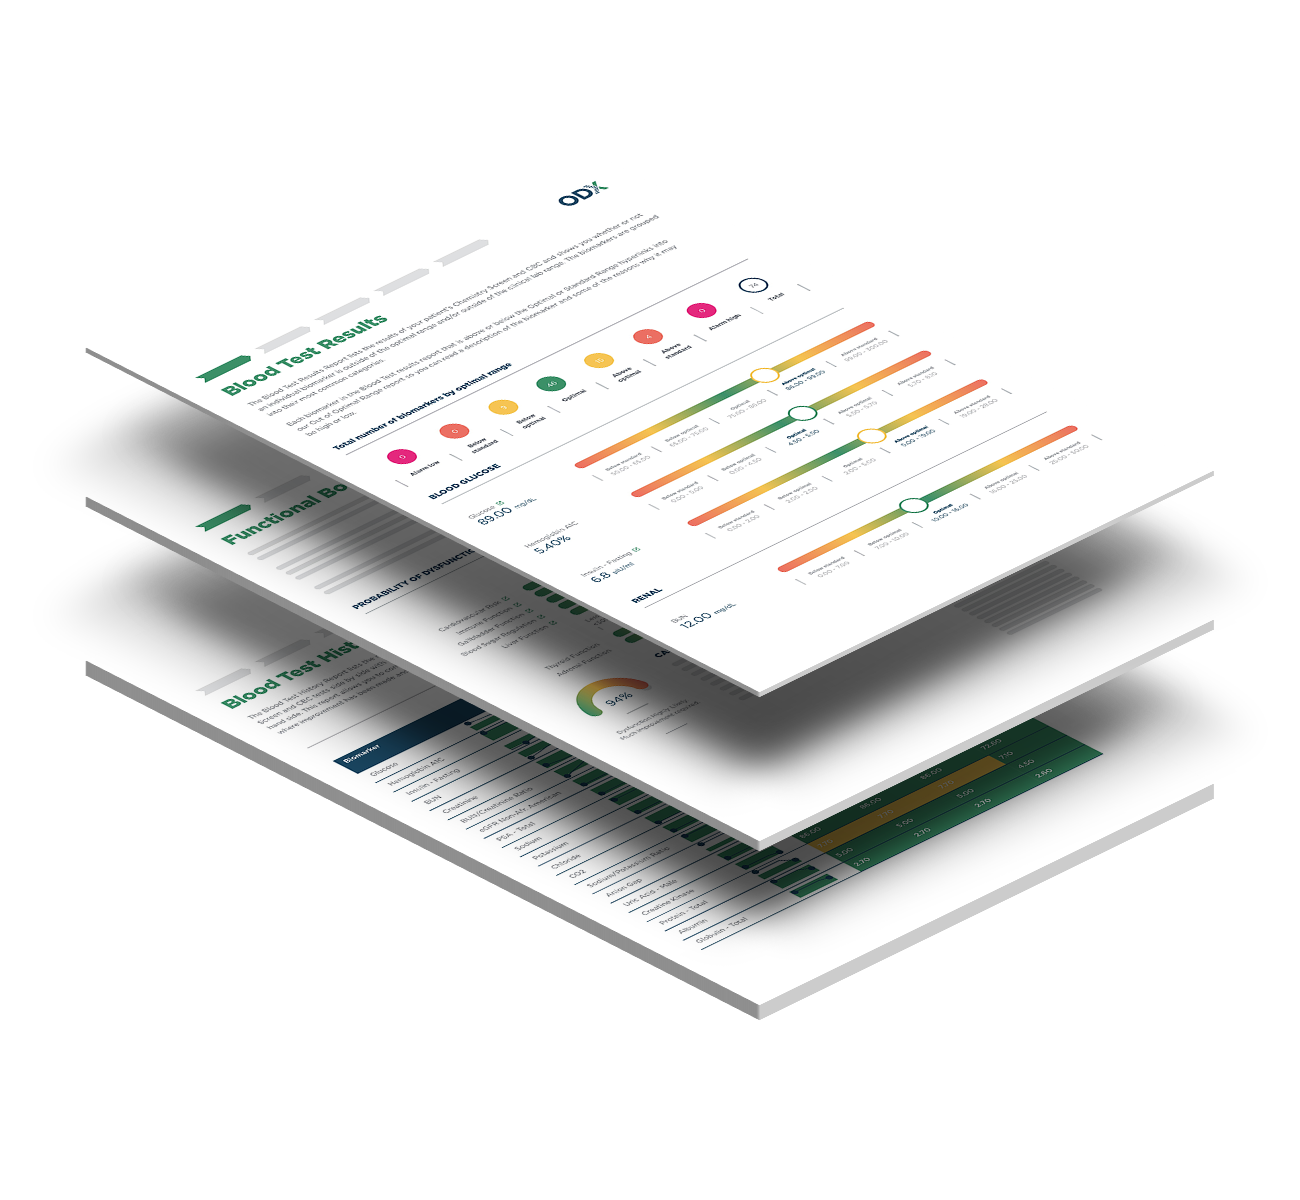
Optimal DX produces each Functional Health Report in 2 versions: one for the practitioner and one for the patient. The sample reports analyze 105 biomarkers from a single Quest panel.
Both versions include:
The practitioner version adds:
The Functional Body Systems, Accessory Systems and Clinical Dysfunctions results use the same likelihood scale: 90% to 100% is Dysfunction Highly Likely, 70% to 90% is Dysfunction Likely, 50% to 70% is Dysfunction Possible, and below 50% is Less Likely.
Blood Test Comparative and Blood Test History show how each biomarker has changed since earlier tests, so you and the patient can see progress. Each Functional Health Report also comes with the Treatment Plan Builder, and the plan carries into the patient's Health Improvement Plan (HIP).
A thin panel limits what any interpretation can find. Optimal DX publishes 3 suggested panels.[16]
View a sample Functional Health Report
Optimal DX sees 4 causes: standard reference intervals designed to detect disease, reading biomarkers one at a time, slow manual review, and limited formal training in functional interpretation. The Optimal DX Functional Health Report addresses them with optimal ranges, pattern scoring by body system, and PDF import from more than 100 labs.
Optimal DX defines an optimal range as a narrow band of upper and lower limits that correspond to optimally healthy levels of a biomarker. For fasting glucose, the Optimal DX optimal range is 75 to 86 mg/dL, against a standard range of 65 to 99 mg/dL.
Optimal DX optimal ranges come from Dr. Dicken Weatherby's research and clinical experience in Functional Blood Chemistry Analysis since 1998. The research behind each range is published with references in the online ODX Biomarker Guide, and the white paper What Is Optimal? sets out the rationale.
Optimal DX takes its standard ranges mainly from Quest Diagnostics. It adds or adjusts standard ranges where appropriate, such as Labcorp ranges for practitioners who test through Labcorp.
No. Optimal DX presents FBCA as an assessment tool to be used with the patient's clinical presentation, history, symptoms and blood chemistry changes over time.