


This post focuses on how Functional Blood Chemistry Analysis can support not only licensed practitioners but also the growing field of allied healthcare professionals.
This post will serve as a complement to FBCA Outside of the Doctor's Office: Improving Clients' Quality of Life, which describes how FBCA can support a non-licensed practitioner's practice, this post will describe that same topic from the licensed professional's perspective. With a licensed healthcare practitioner, we can assume a higher level of understanding and familiarity with blood chemistry analysis, describe the functional approach to this diagnostic technique, and explain how practitioners can use FBCA to build treatment plans and generate follow-up visits.
Blood chemistry analysis is a clinician’s journey inside a patient’s physiology. It reflects organ function, electrolyte balance, metabolic efficiency, and more. It is an indispensable tool for assessing a patient’s health and is done at least once per year in a healthy individual.
Results may come back “within normal range” but can fail to indicate if a patient’s physiology is trending toward dysfunction. Clues to early dysfunction are easily missed because standard reference ranges are wide, usually reflecting 2 standard deviations from the mean.
Statistically speaking, 95.4% of the distribution falls between 2 standard deviations above and below the mean.[1] Utilizing tighter reference ranges allows the clinician to address early signs of dysfunction before results progress into the overt disease range and early damage has already been done.
Functional blood chemistry analysis (FBCA) provides a more targeted and comprehensive assessment. The FBCA compares results to tighter optimal ranges that better reflect where a patient may lie on the spectrum of physiological function. Many optimal ranges are based on research that demonstrates an increased risk of disease when biomarkers reach a certain level, even if results are within standard reference range. In some cases, optimal values represent a range closer to 1 standard deviation from the mean.
A functional approach to blood chemistry analysis can also provide clues to why a patient may feel unwell despite available blood chemistries coming back “completely normal.” It can reveal early trends in blood sugar dysfunction, inflammation, hormone imbalance, nutrient insufficiency, etc.
The FBCA incorporates a wide range of biomarkers compared to the basic markers available in the 1960s (e.g., glucose, urea, creatinine, electrolytes, total protein, albumin, globulin, cholesterol, and basic enzymes).[2]
Biomarkers evaluated by FBCA include basic biomarkers and beyond, including 1,5- anhydroglucitol, apolipoproteins, C-peptide, fibrinogen, fructosamine, homocysteine, hs-CRP, HOMA2 calculations, Lp-PLA2 activity, and a wide array of hormones, enzymes, and nutrients.
The more sophisticated biomarkers begin to look at early signs of dysfunction, providing more detailed information about an individual’s underlying physiology and biochemistry. Ratio calculations are also available to assess relationships between biomarkers.
The research often says much more than just what is revealed in the abstract and discussion. Data will often reveal biomarker ranges that are most compatible with health versus disease, even if not the primary focus of a particular study. Or, in some cases, an optimal range is revealed in accordance with the objective, but those results aren’t translated into practice guidelines in a timely manner. Evaluations of blood glucose and serum vitamin D levels provide good examples.
Research shows us that “normal” isn’t always optimal, a realization reflected in the updating of reference ranges for fasting plasma glucose (FPG). In the 1970s, up to 140 mg/dL (7.7 mmol/L) was considered “normal” while in the 2020s, 100-125 mg/dL (5.6-6.9 mmol/L) is considered “prediabetes” and 126 mg/dL (7 mmol/L) and above meets the criteria for a diagnosis of diabetes.[3] [4] [5]
Digging further into the research, a comparative study of 46, 578 individuals found that an FPG of 90-99 mg/dL (5-5.5 mmol/L) represents a significantly greater risk of progression to diabetes. In this study, an FBG of less than 85 mg/dL (4.7 mmol/L) was associated with the least risk of diabetes. The risk was found to increase by 6% for each mg/dL (0.56 mmol/L) rise in FPG.[6]
The nature of the FBCA is to look at the relationship between physiological systems. Therefore, an above optimal FPG will also trigger a cardiovascular evaluation. The past and present research has defined an optimal glucose range for reduced cardiovascular risk even though this clinical pearl has been overlooked by standard blood chemistry analysis.
Assessing vitamin D through an optimal lens is imperative to the early identification of disease risk. Traditionally, vitamin D deficiency wasn’t diagnosed until serum 25-hydroxyvitamin D (25(OH)D) fell below 12 ng/mL (30 nmol/L). Insufficiency was defined as 12-20 ng/mL (30-50 nmol/L), and levels above 20 ng/mL (50 nmol/L) were accepted as “normal.”[10]
However, research revealed that minimum sufficiency wasn’t reached until 25(OH)D rose above 30 ng/mL (75 nmol/L),[11] [12] while levels of 40 ng/mL (100 nmol/L) or greater were associated with a reduction in all-cause mortality.[13] Corroborating these findings, research during the COVID-19 pandemic revealed that a 25(OH)D level of 30 ng/mL (75 nmol/L) or greater was associated with reduced disease severity and mortality.[14]
So, here we see that standard lab ranges did not identify vitamin D insufficiency or the complications associated with it including bone disease, cancer, cardiovascular disease, diabetes, and hypertension. Serum levels of 55-70 ng/mL better reflect vitamin D sufficiency and decreased risk of disease and all-cause mortality. If vitamin D is insufficient, supplementation of 2000-7000 IU vitamin D3 per day can be initiated until levels reach optimal levels.[15]
Researchers note an observed inverse relationship between serum 25(OH)D and risk of breast, colon, and ovarian cancer. Researchers recommend timely assessment of 25(OH)D status with a goal of achieving and maintaining 55-90 ng/mL Levels may be achieved with daily sun exposure of 40% of body surface area for 3-15 minutes within 1 hour of noon, depending on age and skin pigmentation. Individuals with darker skin need more exposure to promote vitamin D synthesis. In those who are already vitamin D sufficient, intake of 1000-2000 IU/day of vitamin D3 would be prudent to ensure maintenance of optimal levels.[16]
Disease prevention is the goal of functional blood chemistry analysis and implementation. This approach relies on early detection of dysfunction and early intervention that often incorporates nutrition, lifestyle, and stress management protocols.
These changes need to address the system as a whole and adjustments in one area often result in benefits throughout the body.
The FBCA incorporates the most pertinent research into algorithms that assess an array of biomarkers related to a particular system instead of evaluating just one marker at a time.
For example, in assessing inflammation, the FBCA takes into consideration hs-CRP, ferritin, homocysteine, fibrinogen, neutrophil: lymphocyte ratio, etc. Optimal ranges are used to reveal early progression toward an inflammatory state in order to address the imbalance before tissue damage and disease ensue.
Using the FBCA results and clinical reference guides, individualized protocols can be developed to target early dysfunction.
This approach was notably successful in a 70-person cohort comprehensive study of lifestyle and diet intervention. Chronic disease biomarkers as well as defined disease assessment scores significantly improved during the 9-month intervention with many health issues resolving within 5-6 months.[17]
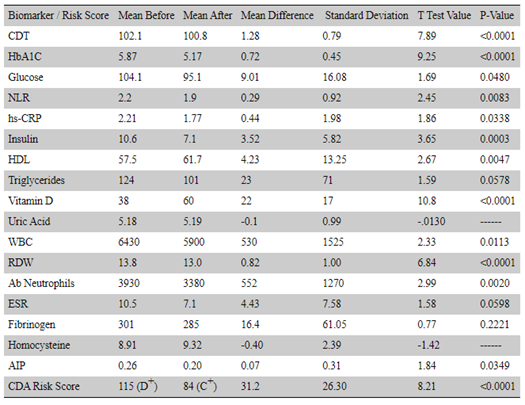 Source: Lewis, Thomas J et al. “Reduction in Chronic Disease Risk and Burden in a 70-Individual Cohort Through Modification of Health Behaviors.” Cureus vol. 12,8 e10039. 26 Aug. 2020, doi:10.7759/cureus.10039 This is an open access article distributed under the terms of the Creative Commons Attribution License, which permits unrestricted use, distribution, and reproduction in any medium, provided the original author and source are credited.
[1] Whitley, Elise, and Jonathan Ball. “Statistics review 2: samples and populations.” Critical care (London, England) vol. 6,2 (2002): 143-8. doi:10.1186/cc1473
[2] Kricka, Larry J., and John Savory. "International year of chemistry 2011: a guide to the history of clinical chemistry." Clinical chemistry 57.8 (2011): 1118-1126.
[3] Pape J. Diabetes Self-management. (2011). Diagnosing Diabetes.
[4] “Classification and diagnosis of diabetes mellitus and other categories of glucose intolerance. National Diabetes Data Group.” Diabetes vol. 28,12 (1979): 1039-57. doi:10.2337/diab.28.12.1039
[5] American Diabetes Association. "6. Glycemic Targets: Standards of Medical Care in Diabetes—2021." Diabetes Care 44.Supplement 1 (2021): S73-S84.
[6] Nichols, Gregory A et al. “Normal fasting plasma glucose and risk of type 2 diabetes diagnosis.” The American journal of medicine vol. 121,6 (2008): 519-24. doi:10.1016/j.amjmed.2008.02.026
[7] Bjørnholt, J V et al. “Fasting blood glucose: an underestimated risk factor for cardiovascular death. Results from a 22-year follow-up of healthy nondiabetic men.” Diabetes care vol. 22,1 (1999): 45-9. doi:10.2337/diacare.22.1.45
[8] Bancks, Michael P et al. “Long-term Absolute Risk for Cardiovascular Disease Stratified by Fasting Glucose Level.” Diabetes care vol. 42,3 (2019): 457-465. doi:10.2337/dc18-1773
[9] Batty, G D et al. “Post-challenge blood glucose concentration and stroke mortality rates in non-diabetic men in London: 38-year follow-up of the original Whitehall prospective cohort study.” Diabetologia vol. 51,7 (2008): 1123-6. doi:10.1007/s00125-008-1005-0
[10] NIH Office of Dietary Supplements Vitamin D Fact Sheet for Professionals.
[11] Holick, Michael F et al. “Evaluation, treatment, and prevention of vitamin D deficiency: an Endocrine Society clinical practice guideline.” The Journal of clinical endocrinology and metabolism vol. 96,7 (2011): 1911-30. doi:10.1210/jc.2011-0385
[12] Papadimitriou, Dimitrios T. “The Big Vitamin D Mistake.” Journal of preventive medicine and public health = Yebang Uihakhoe chi vol. 50,4 (2017): 278-281. doi:10.3961/jpmph.16.111 This is an Open Access article distributed under the terms of the Creative Commons Attribution Non-Commercial License ()
[13] Papadimitriou, Dimitrios T. “The Big Vitamin D Mistake.” Journal of preventive medicine and public health = Yebang Uihakhoe chi vol. 50,4 (2017): 278-281. doi:10.3961/jpmph.16.111
[14] Maghbooli, Zhila et al. “Vitamin D sufficiency, a serum 25-hydroxyvitamin D at least 30 ng/mL reduced risk for adverse clinical outcomes in patients with COVID-19 infection.” PloS one vol. 15,9 e0239799. 25 Sep. 2020, doi:10.1371/journal.pone.0239799
[15] Cannell, John J, and Bruce W Hollis. “Use of vitamin D in clinical practice.” Alternative medicine review : a journal of clinical therapeutic vol. 13,1 (2008): 6-20.
[16] Garland, Cedric F et al. “What is the dose-response relationship between vitamin D and cancer risk?.” Nutrition reviews vol. 65,8 Pt 2 (2007): S91-5. doi:10.1111/j.1753-4887.2007.tb00349.x
[17] Lewis, Thomas J et al. “Reduction in Chronic Disease Risk and Burden in a 70-Individual Cohort Through Modification of Health Behaviors.” Cureus vol. 12,8 e10039. 26 Aug. 2020, doi:10.7759/cureus.10039 This is an open access article distributed under the terms of the Creative Commons Attribution License, which permits unrestricted use, distribution, and reproduction in any medium, provided the original author and source are credited.