

Optimal Takeaways
The free T3 to free T4 ratio provides information about thyroid hormone metabolism and the degree of conversion of T4 to T3, a process influenced by nutrient availability and hormonal factors. A low FT3:FT4 ratio can be associated with low T3 syndrome, T4 monotherapy, cardiovascular risk, acute and chronic disease, stress adaptation, and increased mortality risk. An elevated FT3:FT4 ratio may be associated with arterial stiffness, insulin resistance, metabolic syndrome, cardiometabolic dysfunction, and hyperthyroidism.
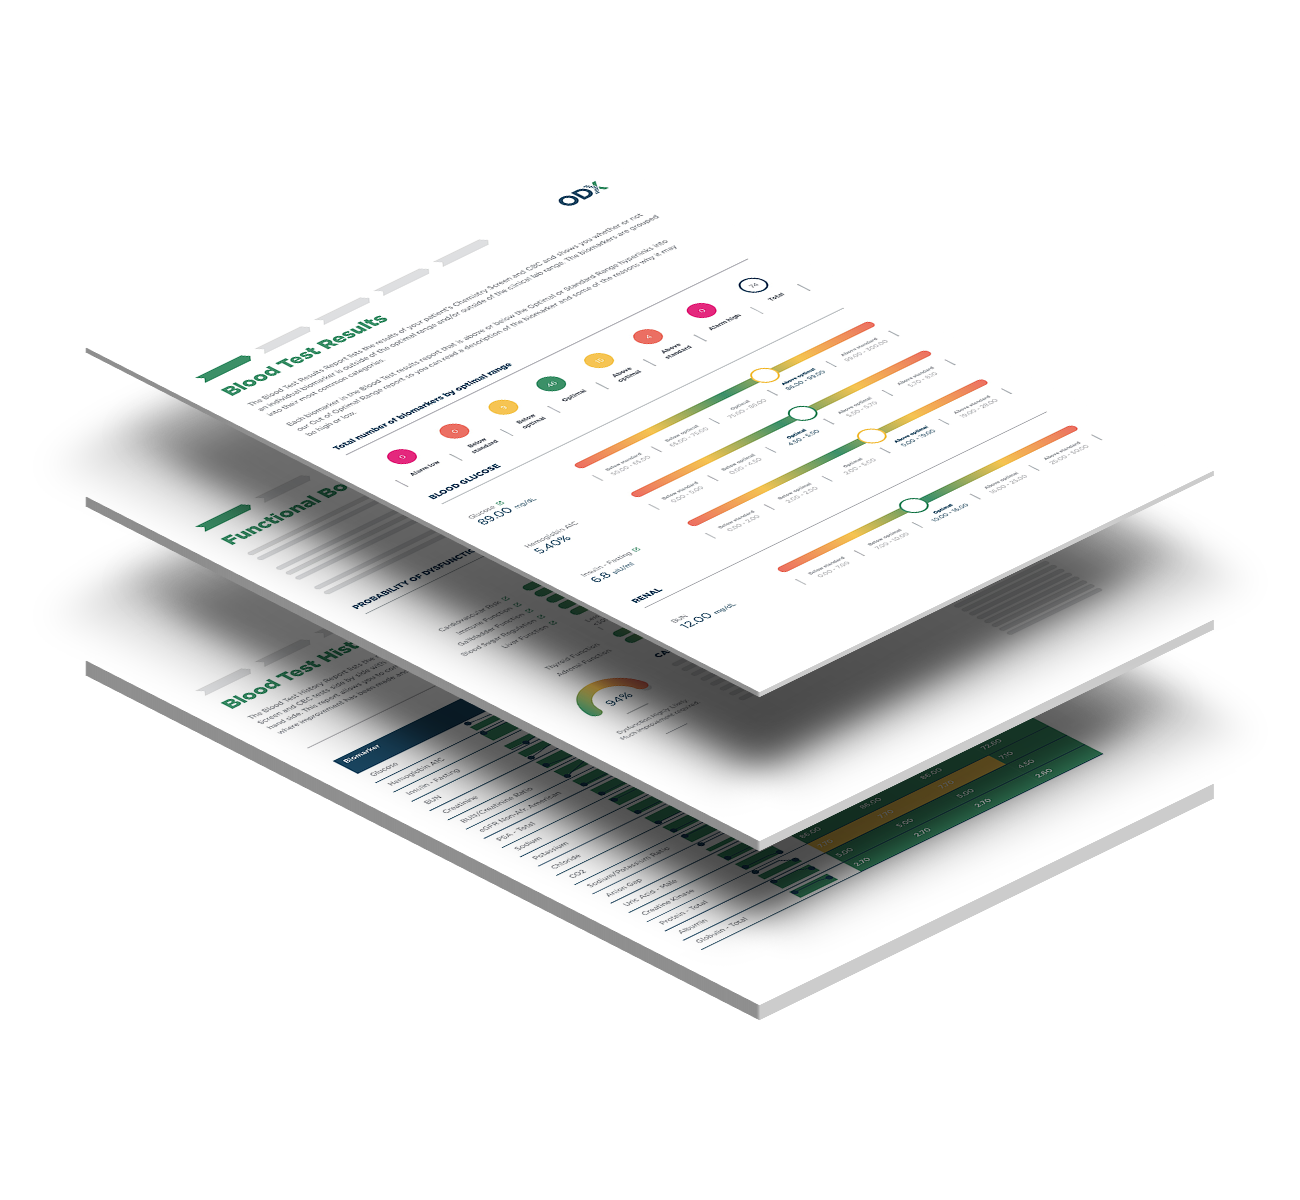
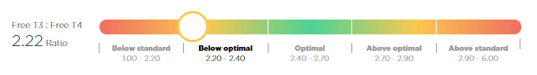
Standard Range: 2.2 – 2.9 Ratio (FT3 in pg/mL and FT4 in ng/dL)
The ODX Range: 2.4 – 2.7 Ratio (FT3 in pg/mL and FT4 in ng/dL)
Low FT3:FT4 ratio can be associated with T4-only therapy, decreased conversion of T4 to T3, low T3 syndrome (Nomura 2017), selenium deficiency, disrupted deiodinase activity (Sesmilo 2011), low muscle mass (Kong 2020), decreased muscle strength, and impaired physical performance (Wang 2022). A low FT3:FT4 ratio may be associated with worse outcomes following MI, especially below 2.1 (Yu 2018), and may be an independent risk factor for major cardiovascular and cerebrovascular events, especially below 2.2 (Yuan 2021).
High FT3:FT4 ratio is associated with hyperthyroidism, fatty liver (Gokmen 2016, Sriphrapradang 2016, Van den Berg 2017), Graves’ disease (Baral 2017, Chen 2018), metabolic syndrome and associated components (Wolffenbuttel 2017), insulin resistance (Park 2017), arterial stiffness, and increased cardiovascular risk (Roef 2014). An elevated ratio may also be associated with emerging hypothyroidism (Abbey 2022).
Overview
The free T3 to free T4 ratio (FT3:FT4) reflects the conversion of T4 to T3, which occurs outside the thyroid—primarily in the liver and kidneys (Sesmilo 2011). An elevated FT3:FT4 ratio, reflecting increased free T3 and/or decreased free T4, can be associated with a variety of conditions, including Graves’ disease, metabolic syndrome, insulin resistance, and fatty liver (Gokmen 2016, Sriphrapradang 2016, Van den Berg 2017). The FT3:FT4 will be higher in Graves versus destruction-induced thyrotoxicosis and may assist in clinical diagnosis (Baral 2017, Chen 2018).
Evaluating the FT3:FT4 ratio is helpful in several non-thyroidal conditions. A large population-based study of 26,719 individuals found that an elevated FT3:FT4 was associated with four of the five components that characterize metabolic syndrome: elevated blood pressure, triglycerides, waist circumference, and low HDL-cholesterol. Those in the highest quartile of FT3:FT4 had a 50-80% greater risk of metabolic syndrome compared to the lowest quartile (Wolffenbuttel 2017).
A cross-sectional study of 132,345 euthyroid subjects found a positive association between elevated FT3:FT4 and insulin resistance (HOMA-IR), triglycerides, waist circumference, systolic blood pressure, and fasting blood glucose. The highest observed values for FT3:FT4 were 2.98 or above for men and 2.89 or higher for women (Park 2017).
An increasing FT3:FT4 ratio is also associated with increased cardiovascular risk. In one study of 2,315 euthyroid individuals, a higher FT3:FT4 was associated with arterial stiffness, inflammatory markers hs-CRP and IL-6, and markers of metabolic syndrome (Roef 2014).
However, a low FT3:FT4 ratio can also be associated with cardiovascular disease, considering both the heart and cardiovascular system are influenced by thyroid hormone balance. One study of individuals undergoing percutaneous coronary intervention following acute MI found that 1-year mortality increased significantly with a decreasing FT3:FT4 ratio, especially below 2.17 (Yu 2018).
A study of 2,106 euthyroid patients with severe coronary artery disease found that low FT3:FT4 was an independent risk factor for major adverse cardiac and cerebrovascular events (MACCE). In this cohort, those with the lowest FT3:FT4, i.e., below 2.2, were more likely to be female, older, diabetic, and have a higher BMI and T4, reduced creatinine clearance, and significantly increased risk of MACCE and mortality (Yuan 2021).
A low free T3 can be a sensitive marker of ill health. Both decreased FT3 and increased FT4 correlate with acute and chronic disease and can help predict long-term mortality risk. Results from a retrospective cohort analysis of 1,164 hospitalized patients revealed that those with a lower FT3:FT4 ratio of 2.1 were at increased risk of mortality during a follow-up period of 36 months. It was noted that CRP, sedimentation rate, ferritin, and LDH were also elevated in the mortality group (Ataoglu 2018).
A reduced FT3:FT4 ratio may indicate T4-only therapy, selenium deficiency, disrupted deiodinase activity, and reduced T3 and free T3 production. A ratio of less than 2 suggests the presence of low T3 syndrome versus central hypothyroidism (Nomura 2017). One cross-sectional study revealed a median FT3:FT4 ratio of 2.21 in primary hypothyroidism treated with T4 alone, 2.28 in central hypothyroidism treated with T4 alone, and 2.62 in controls. Researchers note that central hypothyroidism is a remarkably complex disorder likely to be affected by the deficiency or replacement of other hormones that influence thyroid hormone metabolism, including the FT3:FT4 ratio. For example, cortisol inhibits the conversion of T4 to T3, and growth hormone stimulates the conversion of T4 to T3 (Sesmilo 2011).
Assessing FT3:FT4 may help differentiate emerging hypothyroidism from a hypothalamic-pituitary-thyroid axis response to stress. The FT3:FT4 can be higher in hypothyroidism than in stress adaptation. Evaluation of data from the Baltimore Longitudinal Study of Aging suggested that TSH of 5.2 mIU/L with an FT4 of 0.86 ng/dL (11.07 pmol/L) and FT3:FT4 ratio of 3.15 was likely associated with hypothyroidism. However, a TSH of 5.5 with a higher FT4 of 1.01 ng/dL (13 pmol/L) and a lower FT3:FT4 ratio of 2.77 or below was more likely associated with an adaptive stress response characterized by reduced deiodination of T4 to T3 (Abbey 2022).
Assessing the ratio can also help identify the cause of thyrotoxicosis when evaluating Graves’ disease versus subacute thyroiditis. In one study of 548 newly diagnosed thyrotoxicosis patients, those diagnosed with Graves’ had a significantly higher FT3:FT4 of 4.62 compared to subacute thyroiditis (2.73) or toxic adenoma/multinodular goiter (2.67). Researchers suggest a cutoff above 4.4 for differentiating Graves’ disease. Calculations were completed with FT3 in pg/mL and FT4 in ng/dL (Sriphrapradang 2016).
Calculating The Ratio - Let ODX Do The Work!
Good news! The Free T3: Free T4 ratio is now being automatically calculated by the Optimal DX software if both the Free T3 and Free T4 are added into the system. No need to do any conversions as the software will do this for you and will now show the result in the Blood Test Results Report:
However, if you simply want to do the calculation manually then please follow these instructions:
-
- First off, the Free T3 must be in the pg/ml unit, which is the unit used in the ODX Software
- If the Free T3 is in the pg/dl unit, you must divide the result by 100 to convert pg/dl into pg/ml i.e 325 pg/dl = 3.25 pg/dl
- The Free T4 must be in ng/dl (normal unit in U.S.) i.e. 1.0 ng/dl
- The ratio is calculated by dividing the Free T3 result by the Free T4 result, i.e. 3.25 / 1. = 3.25
References
Abbey, Enoch J et al. “Free Thyroxine Distinguishes Subclinical Hypothyroidism From Other Aging-Related Changes in Those With Isolated Elevated Thyrotropin.” Frontiers in endocrinology vol. 13 858332. 4 Mar. 2022, doi:10.3389/fendo.2022.858332
Ataoglu HE, Ahbab S, Serez MK, et al. Prognostic significance of high free T4 and low free T3 levels in non-thyroidal illness syndrome. Eur J Intern Med. 2018 Nov;57:91-95.
Chen, Xinxin et al. “Diagnostic Values of Free Triiodothyronine and Free Thyroxine and the Ratio of Free Triiodothyronine to Free Thyroxine in Thyrotoxicosis.” International journal of endocrinology vol. 2018 4836736. 4 Jun. 2018, doi:10.1155/2018/483673
Gokmen FY, Ahbab S, Ataoglu HE, et al. FT3/FT4 ratio predicts non-alcoholic fatty liver disease independent of metabolic parameters in patients with euthyroidism and hypothyroidism. Clinics (Sao Paulo). 2016 Apr;71(4):221-5. doi: 10.6061/clinics/2016(04)08.
Kong, S H et al. “Low free T3 to free T4 ratio was associated with low muscle mass and impaired physical performance in community-dwelling aged population.” Osteoporosis international : a journal established as result of cooperation between the European Foundation for Osteoporosis and the National Osteoporosis Foundation of the USA vol. 31,3 (2020): 525-531. doi:10.1007/s00198-019-05137-w
Nomura, Risa et al. “Free T3 to free T4 ratio less than 2.0 suggests low T3 syndrome rather than central hypothyroidism from the age of two to eighteen years.” Endocrine journal vol. 64,2 (2017): 213-219. doi:10.1507/endocrj.EJ16-0169
Park SY, Park SE, Jung SW, et al. Free triiodothyronine/free thyroxine ratio rather than thyrotropin is more associated with metabolic parameters in healthy euthyroid adult subjects. Clin Endocrinol (Oxf). 2017 Jul;87(1):87-96. doi: 10.1111/cen.13345. Epub 2017 May 3
Roef, Greet L et al. “Triiodothyronine and free thyroxine levels are differentially associated with metabolic profile and adiposity-related cardiovascular risk markers in euthyroid middle-aged subjects.” Thyroid : official journal of the American Thyroid Association vol. 24,2 (2014): 223-31. doi:10.1089/thy.2013.0314
Sesmilo, Gemma et al. “Serum free triiodothyronine (T3) to free thyroxine (T4) ratio in treated central hypothyroidism compared with primary hypothyroidism and euthyroidism.” Endocrinologia y nutricion : organo de la Sociedad Espanola de Endocrinologia y Nutricion vol. 58,1 (2011): 9-15. doi:10.1016/j.endonu.2010.09.006
Sriphrapradang C, Bhasipol A. Differentiating Graves' disease from subacute thyroiditis using ratio of serum free triiodothyronine to free thyroxine. Ann Med Surg (Lond). 2016 Aug 8;10:69-72. doi: 10.1016/j.amsu.2016.07.024. eCollection 2016 Sep.
van den Berg EH, van Tienhoven-Wind LJ, Amini M, et al. Higher free triiodothyronine is associated with non-alcoholic fatty liver disease in euthyroid subjects: the Lifelines Cohort Study. Metabolism. 2017 Feb;67:62-71. doi: 10.1016/j.metabol.2016.11.002. Epub 2016 Nov 6
Wang, Kewei et al. “A Low Free T3 to Free T4 Ratio Is Associated with Sarcopenia in Euthyroid Patients with Type 2 Diabetes Mellitus.” Journal of diabetes research vol. 2022 2305156. 17 Aug. 2022, doi:10.1155/2022/2305156
Wolffenbuttel BHR, Wouters HJCM, Slagter SN, et al Thyroid function and metabolic syndrome in the population-based LifeLines cohort study. BMC Endocr Disord. 2017 Oct 16;17(1):65. doi: 10.1186/s12902-017-0215-1
Yu T, Tian C, Song J, et al. Value of the fT3/fT4 ratio and its combination with the GRACE risk score in predicting the prognosis in euthyroid patients with acute myocardial infarction undergoing percutaneous coronary intervention: a prospective cohort study. BMC Cardiovasc Disord. 2018 Sep 10;18(1):181.
Yuan, Deshan et al. “Predictive value of free triiodothyronine (FT3) to free thyroxine (FT4) ratio in long-term outcomes of euthyroid patients with three-vessel coronary artery disease.” Nutrition, metabolism, and cardiovascular diseases : NMCD vol. 31,2 (2021): 579-586. doi:10.1016/j.numecd.2020.10.011