


Standard reference ranges may vary slightly for older versus younger adults, depending on the biomarker and, in some cases, the lab. Pediatric ranges are completely separate for many biomarkers and should be assessed separately as they reflect growth and development as well as potential pathological changes.
An in-depth Canadian Health Measures Survey (CHMS) of reference ranges for 24 biomarkers from 12,000 apparently healthy individuals 3-79 of age was conducted. Adulthood was defined as 18-49 years and geriatric was defined as 50-79 years. In general, the analysis found (Adeli 2015 Biochemical marker):
- Albumin, total protein, total calcium, sodium, and chloride had some relatively minor variations occur with age and gender.
- Total bilirubin increases with age from childhood to adulthood.
- Phosphate, alkaline phosphatase, LDH, and AST decrease as children transition to puberty and adulthood.
- Creatinine, total cholesterol, LDL cholesterol, triglycerides, uric acid, and urea levels are higher in adulthood than in childhood.
- HDL in adults tended to decline with age in men but increased with age in females.
- GGT, ALT, and glucose had upper limits that increased with aging in adulthood for most participants.
- The increase in ALT and GGT may reflect a trend toward metabolic syndrome, fatty liver, and inflammation.
- The increase in glucose levels seen with aging may reflect a trend toward increased adiposity and insulin resistance.
- Electrolytes remained relatively stable throughout the lifespan due to robust biological feedback mechanisms. However, slight increases were noted with aging, likely due to declining kidney function and hormonal regulation.
- Bicarbonate remained the most stable throughout the lifespan.
- Some biomarker ranges varied by gender.
- In general, more biomarker levels increased and results became “outliers” as age increased, likely reflecting declining health status in an aging population.
Additional evaluation of CHMS data for 13 additional, more specialized biomarkers revealed (Adeli 2015 Complex reference):
- Ferritin and homocysteine were higher in males than females.
The upper and lower ranges for homocysteine increased during puberty, and then again at age 25. - The upper range for ferritin increased after puberty and again at age 40.
- Insulin increased slightly with puberty onset while both serum folate and insulin increased slightly with adulthood.
- hs-CRP peaked at 17-39 years of age but then remained fairly constant through adulthood.
- Vitamin D and RBC folate remained consistent after age six.
- Hemoglobin A1C ranges increased slightly at age 40 but were mostly consistent across the lifespan.
- ApoB and parathyroid hormone increased slightly after puberty onset but remained constant after age 30.
- ApoA1 levels remained relatively stable through adulthood until an increase at the age of 40.
- Vitamin B12 levels decrease in childhood until stabilizing at age 12 and remaining constant into adulthood and the geriatric period.
- RBC folate remained constant throughout the lifespan after increasing slightly after age six. However, there is a discrepancy between the Institute of Medicine’s cutoff for defining folate deficiency, and the optimal level for minimizing neural tube defect risk, i.e., below 134.6 ng/mL to determine deficiency and above 399.8 ng/mL for minimizing risk (305.00 versus 905.95 nmol/L).
- The geriatric population had the greatest number of outliers in this set of biomarkers as well.
However, the issue is more complex than just measuring chronological age, as one’s “phenotypic” or biological age may be different than one’s fixed chronological age. Susceptibility to age-related disease and mortality can vary significantly between individuals of the same chronological age depending on diet, lifestyle, and epigenetics. Biological age can be evaluated using blood biomarkers, including albumin, creatinine, glucose, CRP, WBC count, lymphocyte percentage, MCV, RDW, and alkaline phosphatase. Acceleration in biological age ultimately correlates with increases in CRP, insulin, glucose, triglyceride, and waist-to-hip ratio (Levine 2018).
Measuring biological age may more accurately assess an individual's actual risk of adverse outcomes. Research suggests that measuring frailty can help evaluate biological age and identify accelerated aging. Frailty results from multilevel deterioration of physiological systems in the body. Phenotypic frailty includes at least one of the following three criteria: weight loss, low physical activity, exhaustion, weak grip, and/or slow gait.
A second model of frailty, the deficit accumulation model, implies that the accumulation of health deficits at any age increases the range and occurrence of adverse outcomes. Health deficits can be associated with laboratory biomarkers, signs and symptoms, functional impairments, and disease states. The degree of frailty can help predict morbidity and mortality from a specific disease state or condition. The Clinical Frailty Scale (CFS) reflects the cumulative impact of health deficits associated with cognitive impairment, comorbidities, disability, mobility, and physical activity. The CFS has been validated in individuals over the age of 65. The CFS can be improved with nutrition and exercise programs, as well as positive interventions in the medical, psychological, functional, and social needs of an individual. Nutrition and lifestyle facilitate epigenetic changes to DNA, i.e., changes that modify DNA but don’t change its sequencing. DNA methylation is an example of an epigenetic change that is influenced by both environmental and genetic factors. Epigenetic “age” is directly related to social and lifestyle behaviors, including high fish intake, moderation in alcohol consumption, and higher education (Diebel 2021).
The European MARK-AGE population study of 3,200 subjects suggests a comprehensive set of biomarkers that may help evaluate biological age, including (Burkle 2015):
Systemic metabolism and toxicity parameters
- Blood urea nitrogen and creatinine
- Metal-binding proteins including transferrin, ferritin, α2-macroglobulin, and ceruloplasmin
- Fasting glucose and fasting insulin as a measure for glucose homeostasis, insulin resistance, and diabetic conditions.
- Glycosylated hemoglobin (A1C) as a measure for the long-term systemic glucose load, in order to detect (pre) diabetic conditions.
- Some basic/reference parameters, including albumin and serum protein concentration.
Fatty acid and cholesterol metabolism parameters
- Fasting triglycerides and free fatty acids were measured to detect metabolic disorders in lipid metabolism.
- Total cholesterol, HDL, and LDL-cholesterol were measured (together with triglycerides) for risk assessment of cardiovascular diseases.
- Concentrations of lipoprotein particle size classes by NMR.
Systemic inflammation parameters
- C-reactive protein (CRP), homocysteine, uric acid, and fibrinogen are inflammatory markers associated with cardiovascular disease and hypertension.
- Serum amyloid A and P, and pentraxin 3 were amongst the acute phase proteins studied.
- Adiponectin is correlated with an anti-inflammatory state and suppresses metabolic derangements that may result in type II diabetes, obesity, atherosclerosis, and non-alcoholic fatty liver disease.
Additional candidate biomarkers
- Testosterone, the principal male sex hormone, is known to decline gradually with age in males.
- Prostate-specific antigen (PSA) was measured for the detection of (pre) neoplastic processes in the prostate and prostate cancer in particular.
- Vitamin D, a recently identified promising candidate related to aging and several chronic diseases, was also studied.
- Dehydroepiandrosterone sulfate (DHEAS) is known to decline with age and is a classical candidate biomarker of human aging
Novel biomarkers to be derived from metabonomics analysis
- Nuclear Magnetic Resonance (NMR)-based metabolic profiling of serum/plasma samples and urine samples from probands. NMR profiles display a set of resonances arising from major low-molecular weight molecules, such as ketone bodies, organic acids, amino acids, and aromatic metabolites
Oxidative stress markers
- Malondialdehyde
- Carbonylated and nitrated proteins
- Oxidation of LDL.
- NO metabolic-pathway products
- Isoprostanes
- Cellular glutathione
- Vitamin content (α-tocopherol, α-carotene, and ascorbate) of serum and buccal mucosal cells
- Trace elements (Zn, Cu, Se, and Fe) in blood/serum
Interrelationships within and among biological processes
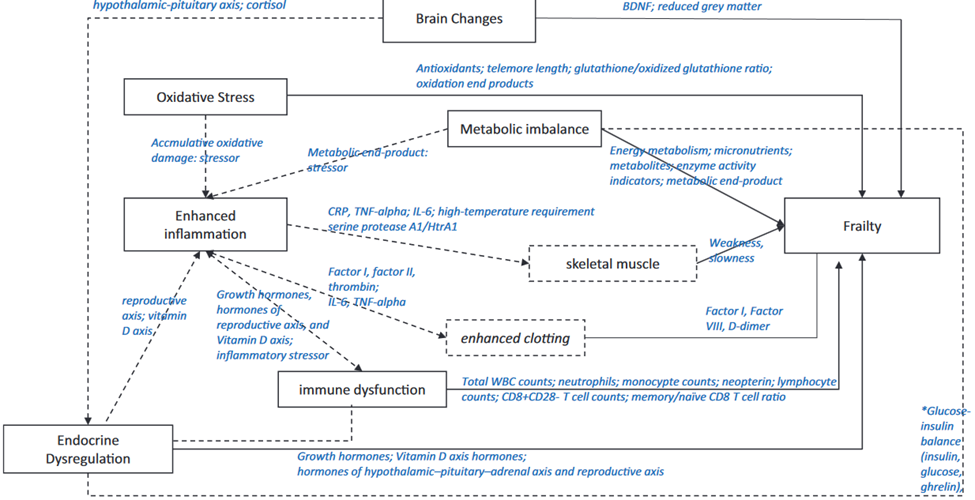
BDNF = brain-derived neurotrophic factor; CRP = C-reactive protein; TNF-a = tumor necrosis factor-a; IL-6 = interleukin-6; WBC = white blood cell
Source: Wang, Jinjiao et al. “Biological Processes and Biomarkers Related to Frailty in Older Adults: A State-of-the-Science Literature Review.” Biological research for nursing vol. 21,1 (2019): 80-106. doi:10.1177/1099800418798047
Additional factors
Malnutrition can be a factor in biological aging and is associated with significantly decreased albumin, prealbumin, total protein, hemoglobin, total cholesterol, and BMI (Zhang 2017). Additional factors can contribute to biological aging and health status and should be considered in a comprehensive assessment, including biomarkers of endocrine function, immune function, cognitive function, and physical capability (Lara 2015).
A proposed panel of biomarkers of healthy aging
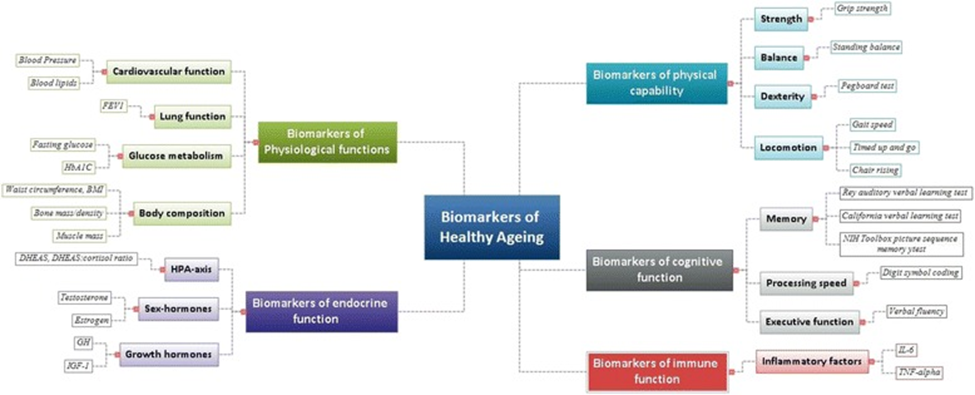
Source: Lara, Jose et al. “A proposed panel of biomarkers of healthy ageing.” BMC medicine vol. 13 222. 15 Sep. 2015, doi:10.1186/s12916-015-0470-9 This article is distributed under the terms of the Creative Commons Attribution 4.0 International License (http://creativecommons.org/licenses/by/4.0/),
Optimal Takeaways
Although there are no currently defined optimal biomarker ranges for the age group designated as “geriatric,” there are a number of biomarkers that can help evaluate someone’s “biological” age and disease risk, regardless of their fixed chronological age.
Evaluating these biomarkers within a functional matrix range can help identify accelerated aging, advanced biological age, and trends toward dysfunction:
- BUN, creatinine
- Metal binding proteins including transferrin, ferritin, α2-macroglobulin and ceruloplasmin
- Fasting glucose, fasting insulin, HbA1C
- Albumin, prealbumin, total protein
- Fasting triglycerides and free fatty acids
- Total cholesterol, HDL and LDL-cholesterol
- Lipoprotein subfractionation/particle size classes by NMR (or ION)
- CRP, homocysteine, uric acid, fibrinogen
- Serum amyloid A and P, pentraxin 3
- Adiponectin
- Testosterone, PSA
- Vitamins A, C, D
- Zinc, copper, selenium, iron
- DHEAS
- Malondialdehyde
- Carbonylated and nitrated proteins
- Oxidation of LDL.
- NO metabolic-pathway products
- Isoprostanes
- Electrolytes
- ALT, AST, GGT, alkaline phosphatase
- Endocrine hormone markers
References
Adeli, Khosrow et al. “Biochemical marker reference values across pediatric, adult, and geriatric ages: establishment of robust pediatric and adult reference intervals on the basis of the Canadian Health Measures Survey.” Clinical chemistry vol. 61,8 (2015): 1049-62. doi:10.1373/clinchem.2015.240515
Adeli, Khosrow et al. “Complex reference values for endocrine and special chemistry biomarkers across pediatric, adult, and geriatric ages: establishment of robust pediatric and adult reference intervals on the basis of the Canadian Health Measures Survey.” Clinical chemistry vol. 61,8 (2015): 1063-74. doi:10.1373/clinchem.2015.240523
Burkle, Alexander et al. “MARK-AGE biomarkers of ageing.” Mechanisms of ageing and development vol. 151 (2015): 2-12. doi:10.1016/j.mad.2015.03.006
Diebel, Lucas W M, and Kenneth Rockwood. “Determination of Biological Age: Geriatric Assessment vs Biological Biomarkers.” Current oncology reports vol. 23,9 104. 16 Jul. 2021, doi:10.1007/s11912-021-01097-9
Lara, Jose et al. “A proposed panel of biomarkers of healthy ageing.” BMC medicine vol. 13 222. 15 Sep. 2015, doi:10.1186/s12916-015-0470-9
This article is distributed under the terms of the Creative Commons Attribution 4.0 International License (
Levine, Morgan E et al. “An epigenetic biomarker of aging for lifespan and healthspan.” Aging vol. 10,4 (2018): 573-591. doi:10.18632/aging.101414
Wang, Jinjiao et al. “Biological Processes and Biomarkers Related to Frailty in Older Adults: A State-of-the-Science Literature Review.” Biological research for nursing vol. 21,1 (2019): 80-106. doi:10.1177/1099800418798047
Zhang, Zhiying et al. “Evaluation of Blood Biomarkers Associated with Risk of Malnutrition in Older Adults: A Systematic Review and Meta-Analysis.” Nutrients vol. 9,8 829. 3 Aug. 2017, doi:10.3390/nu9080829