

Blood chemistry panels contain a wealth of clinical information, yet many functional medicine practitioners still struggle to translate raw lab data into consistent, actionable insights. Inconsistent interpretation standards, wide conventional reference intervals, and the sheer volume of biomarkers create bottlenecks that slow clinical workflows and reduce patient-facing clarity.
This guide from Optimal DX walks you through the root causes of these interpretation challenges, the frameworks that solve them, and the tools that bring speed and consistency to every blood panel you review.
Functional blood chemistry interpretation is the process of evaluating standard laboratory biomarkers through a clinical lens that prioritizes optimal physiological function over the mere absence of disease. Rather than asking whether a value falls inside a broad conventional range, practitioners assess whether each biomarker reflects the conditions associated with long-term health and resilience.
This approach uses narrower, evidence-informed reference intervals derived from research on healthy populations. A fasting glucose of 95 mg/dL, for instance, sits within most standard ranges but may signal early insulin resistance when evaluated alongside elevated fasting insulin and triglycerides.
Conventional laboratory reporting was designed to flag overt pathology. Functional blood chemistry analysis extends that utility by detecting the subclinical shifts in metabolism, inflammation, and nutrient status that precede disease.
For practitioners in integrative and functional medicine, this expanded interpretive framework is how lab data becomes a meaningful clinical tool rather than a binary pass-fail report.
Several interconnected factors make blood chemistry interpretation one of the most time-consuming and inconsistent tasks in a functional medicine practice. Understanding these root causes is the first step toward solving them.
Standard laboratory reference intervals are built from population-level statistical distributions. These populations may include individuals with chronic conditions, medications, or subclinical disease, all of which skew the range wider. A result flagged as "normal" under these conditions may still reflect clinically meaningful dysfunction.
A 2026 study published in The Journal of Applied Laboratory Medicine confirmed that common reference intervals may be inadequate when the sampled population is skewed, underscoring the need for more precise interpretive frameworks.
This is a foundational problem. When the benchmark itself is too broad, the data it produces lacks the resolution needed for early detection. Functional practitioners who rely solely on standard flags risk overlooking the very imbalances their patients present with: fatigue, hormonal shifts, metabolic stress, and nutrient depletion that do not yet meet conventional diagnostic thresholds.
A single biomarker rarely tells a complete clinical story. Yet many practitioners still evaluate results one line at a time, without connecting related markers across metabolic, endocrine, and immune pathways. Elevated alkaline phosphatase, for example, takes on different clinical significance depending on whether gamma-glutamyl transferase, vitamin D, and parathyroid hormone are also outside their optimal ranges.
Pattern recognition across biomarkers is what transforms a list of numbers into a clinical narrative. Without it, practitioners may address surface-level findings while missing the upstream driver. The challenge is that pattern-based interpretation requires both deep biomarker knowledge and a structured workflow, and many clinicians lack one or both.
The typical manual interpretation workflow involves reviewing a PDF lab report, transcribing values into a spreadsheet or chart, cross-referencing each result against functional ranges, and then compiling findings into a patient-facing summary. For a comprehensive panel, this process can take 25 to 40 minutes per patient.
At that pace, a practitioner seeing 10 to 15 patients per day spends a significant portion of the day on data handling rather than clinical reasoning. The result is a bottleneck that limits patient volume, increases administrative fatigue, and raises the risk of transcription errors that compromise accuracy.
Most clinical education programs cover laboratory medicine from a conventional diagnostic perspective. Functional blood chemistry analysis, with its emphasis on optimal ranges, biomarker patterns, and systems-based thinking, is rarely taught in standard curricula.
Practitioners who adopt this approach often do so through self-study, continuing education, or mentorship. This leads to significant variability in how lab results are interpreted across practices.
This training gap means that two practitioners reviewing the same panel may reach different conclusions, not because the data is ambiguous, but because their interpretive frameworks differ. Standardized education pathways help close that gap and bring consistency to clinical decision-making.
The distinction between optimal and standard ranges is central to understanding why functional blood chemistry analysis yields different clinical conclusions than conventional lab review. Each type of range serves a different purpose, and knowing when and how to apply them determines the quality of your interpretation.
Standard reference intervals are calculated by sampling a population that typically includes both healthy individuals and those with undetected illness. The central 95% of results is defined as "normal," while the remaining 5% is flagged as abnormal.
This statistical approach identifies outliers but does not differentiate between adequate function and early imbalance within the middle of the distribution.
Each laboratory may also establish its own intervals based on equipment, methodology, and the demographics of its patient population. This means that valid reference intervals for a given biomarker may differ from one facility to another, adding a layer of interpretive complexity that is often invisible to the ordering clinician.
Optimal ranges are narrower intervals derived from research on healthy populations and clinical experience indicating where physiological function is most robust. They are not diagnostic thresholds. Instead, they serve as early-warning boundaries that help practitioners detect when a biomarker is trending away from ideal function, even if it has not yet crossed a conventional cutoff.
For example, a TSH of 4.0 mIU/L falls within most standard ranges but sits above the optimal range used in functional practice. In context with free T3, free T4, and thyroid antibody levels, that TSH value may reveal subclinical thyroid underperformance that warrants monitoring or early intervention.
Relying exclusively on standard ranges delays intervention until dysfunction has progressed far enough to exceed a wide statistical boundary. Optimal ranges shift the clinical window earlier, allowing practitioners to address metabolic, hormonal, and nutritional imbalances while they are still reversible through dietary, lifestyle, and supplemental strategies.
This earlier window of detection is particularly relevant in functional medicine, where the clinical philosophy centers on identifying and correcting the upstream drivers of disease rather than managing downstream symptoms. The range you choose to interpret against directly shapes the interventions you offer and the outcomes your patients experience.
A structured interpretation workflow reduces variability, shortens analysis time, and ensures that no clinically relevant pattern is overlooked. The following framework organizes the interpretation process into repeatable steps that you can apply to any comprehensive blood panel.
Confirm that all ordered biomarkers are present on the report and that units are consistent with your interpretive framework. U.S. conventional units (mg/dL, mIU/L) and SI units (mmol/L, nmol/L) can coexist on the same report depending on the lab.
Converting units manually introduces error risk. Automated import tools that parse PDF lab reports and standardize units eliminate this step entirely.
Also verify the patient's fasting status, collection time, and any medications that may influence results. Cortisol, glucose, and insulin values, for example, vary significantly based on time of draw and fasting duration.
Evaluate every biomarker against both standard and optimal reference intervals. Flag values that fall within the standard range but outside the optimal range as "functionally significant." These are the results that conventional reporting misses and that functional interpretation is specifically designed to catch.
A systematic approach here is critical. Working through the panel organ system by organ system, or metabolic pathway by metabolic pathway, ensures that you do not skip markers or lose the interpretive thread.
Look for co-occurring findings that point to a shared upstream mechanism. Elevated fasting insulin paired with high triglycerides and low HDL cholesterol, for instance, suggests insulin resistance and metabolic stress, even if fasting glucose remains within range.
Similarly, low ferritin combined with elevated total iron-binding capacity and low mean corpuscular volume forms a recognizable iron-deficiency pattern.
These clinical clusters are where interpretation moves from data review to clinical insight. Recognizing them requires either deep biomarker knowledge or an analytical system that surfaces the patterns automatically. Optimal DX Functional Health Reports score and flag these multi-marker patterns, giving you a prioritized view of each patient's areas of imbalance.
Not every out-of-range finding requires immediate action. Prioritize based on the severity of the deviation, the number of related markers involved, and the patient's symptom presentation. A cluster involving glucose regulation, insulin, and lipid markers may take precedence over a mildly suboptimal vitamin D level, depending on the clinical context.
Structured prioritization prevents the common trap of addressing every finding with equal urgency, which can overwhelm both the practitioner and the patient. Focus on the two to three highest-impact areas first and address secondary findings in follow-up visits.
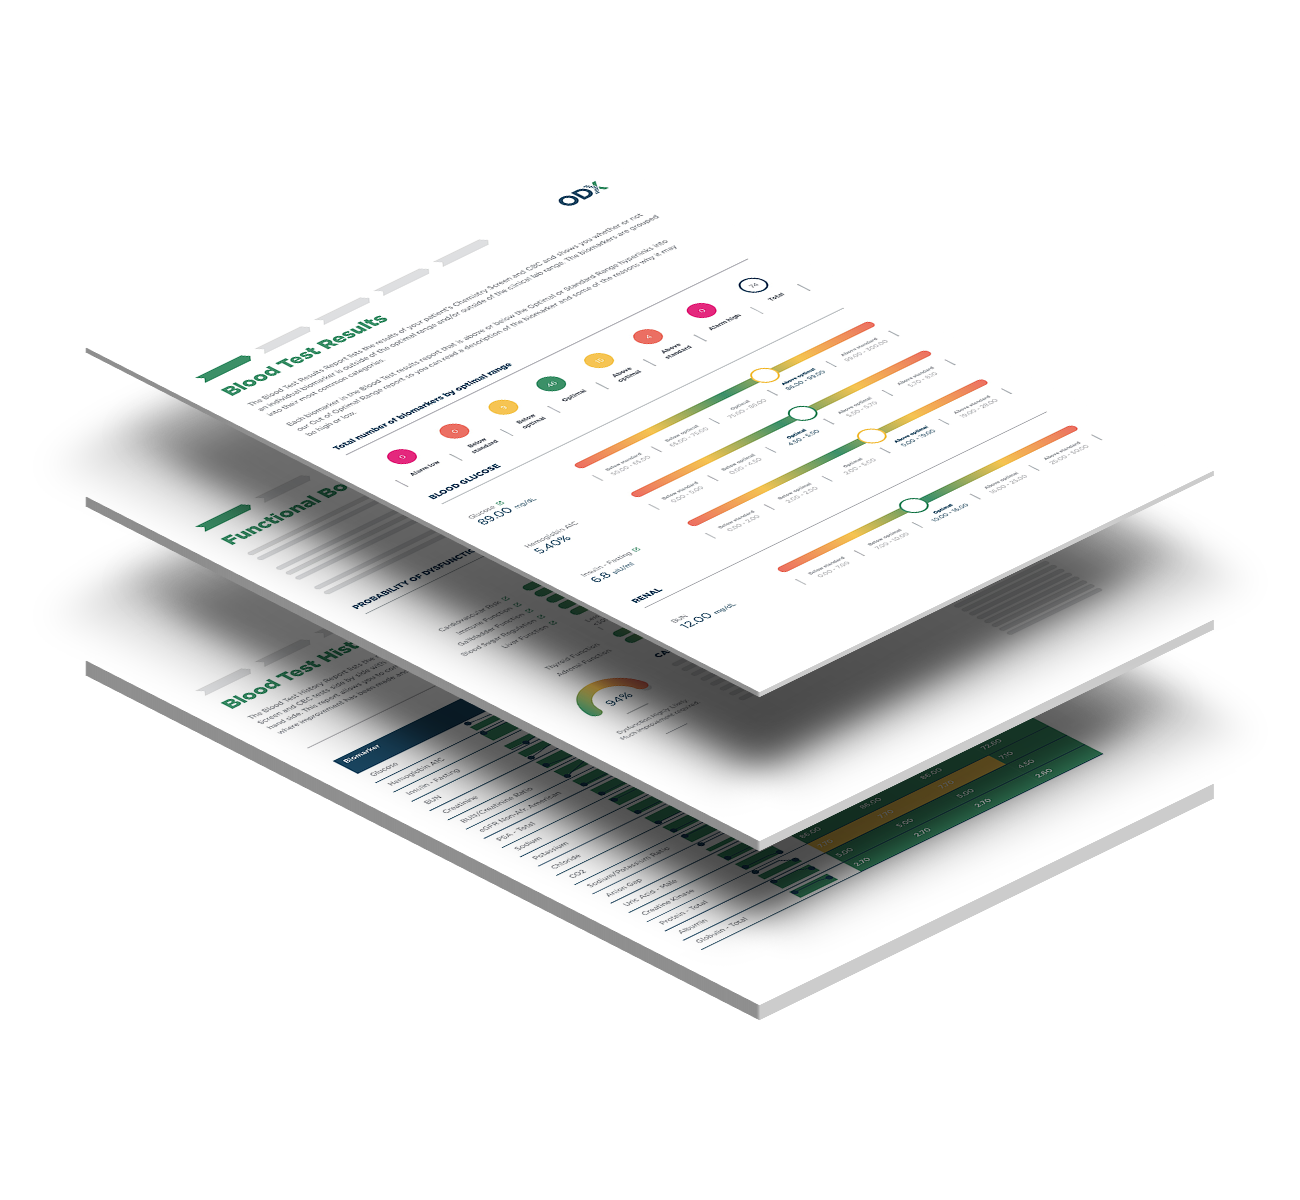
Clinical insight only becomes clinically useful when the patient understands it. Translate your prioritized findings into a clear, visual report that explains what each result means, why it matters, and what steps come next. Color-coded scoring, simplified language, and visual trend comparisons help patients engage with their data rather than feeling overwhelmed by it.
Effective patient reports also serve as retention tools. When patients can see their progress across serial blood tests, they gain a tangible connection to the care plan, which strengthens adherence and follow-through.
CLICK HERE to view a sample Functional Health Report
Even experienced clinicians miss patterns when they evaluate markers in isolation or rely solely on conventional flagging. The following patterns are among the most frequently overlooked in routine blood chemistry review.
A TSH within the standard range paired with low free T3 and elevated reverse T3 suggests impaired T4-to-T3 conversion. This pattern often correlates with fatigue, weight gain, and cognitive sluggishness, yet it rarely triggers a conventional flag. Evaluating the full thyroid biomarker panel against functional ranges reveals these imbalances before overt hypothyroidism develops.
Fasting glucose may remain within range for years while fasting insulin steadily climbs. Chronically elevated insulin triggers a cascade of metabolic consequences: increased cortisol output, hormonal imbalance, visceral fat accumulation, and eventually diminished muscle energy utilization. Identifying elevated insulin alongside rising triglycerides and declining HDL cholesterol catches this trajectory early.
Serum nutrient levels do not always reflect tissue-level status. Under conditions of inflammation, infection, or metabolic stress, the body redistributes or sequesters nutrients in ways that make serum measurements appear adequate when cellular demand is high.
Micronutrient pattern recognition that integrates direct testing with physiological proxy markers, such as mean corpuscular volume, alkaline phosphatase, and homocysteine, provides a more complete picture of nutritional status.
Mildly elevated high-sensitivity C-reactive protein (hs-CRP) and homocysteine may signal chronic low-grade inflammation and cardiovascular risk. Standard panels do not flag these until values reach overtly abnormal levels.
In functional interpretation, these markers are evaluated together with ferritin, fibrinogen, and erythrocyte sedimentation rate to assess the inflammatory burden as a system-level finding rather than an isolated lab result.
Interpretation challenges are not only clinical. They are operational. Slow analysis workflows, inconsistent reporting, and manual data handling affect scheduling, revenue, and practitioner burnout. Addressing these operational bottlenecks is as important as improving the clinical interpretation itself.
The Optimal DX platform automates the most time-intensive steps of blood chemistry analysis. Once lab data is imported through the PDF parser, HL7 integration, or manual entry, the platform scores each biomarker against optimal ranges and identifies multi-marker patterns.
From there, it generates a comprehensive Functional Health Report. What previously took 25 to 40 minutes of manual work now takes a fraction of that time.
This time savings compounds across your patient panel. Practitioners who automate their analysis workflow report the ability to handle higher patient volumes without proportionally increasing administrative hours, which directly supports practice sustainability.
When multiple practitioners work within the same clinic, interpretation consistency becomes a clinical priority. Variation in how individual clinicians define "functionally significant" or prioritize findings can lead to contradictory patient experiences.
A shared analytical platform that applies the same evidence-based biomarker scoring algorithms across every report ensures that interpretation quality does not depend on who reviews the panel.
Clear, professional reports that patients can understand improve engagement and adherence to care plans. When lab findings are presented visually, with optimal range indicators and trend comparisons across serial tests, patients develop a tangible connection to their health data.
This connection drives follow-up visits, supports compliance with care plans, and differentiates your practice from clinics that hand patients a standard lab printout without context.
Closing the interpretation gap requires more than software. It requires structured education that builds a consistent, evidence-based foundation for evaluating lab data from a functional perspective.
Self-directed study introduces variability. Different textbooks, online resources, and mentors may define optimal ranges differently or emphasize different interpretive approaches. A structured certification program creates a shared clinical vocabulary and interpretive framework that practitioners can apply consistently across patients and over time.
The FBCA Mastery Course from Optimal DX offers a 35-hour, self-paced training program covering the interpretation of over 100 biomarkers. The curriculum includes quizzes, case studies, and CE-eligible training that complements the Optimal DX software platform.
This gives practitioners both the knowledge and the tools to implement functional blood chemistry analysis in their daily workflow.
Training is most effective when it connects directly to the tools you use in practice. Practitioners who learn functional interpretation within the same analytical environment they use for patient reports can immediately apply new knowledge to real cases. This integration shortens the learning curve and reinforces retention through repeated clinical application.
Biomarker science advances continuously. New studies refine optimal ranges, introduce novel markers, and update the clinical significance of established ones. The Optimal DX Practitioner Resource Center provides ongoing access to clinical guides, biomarker monographs, and research updates that keep your interpretive framework aligned with current evidence.
Accurate interpretation begins with ordering the right tests. An incomplete panel produces gaps in the data that limit your ability to recognize patterns and assess system-level function.
A comprehensive functional panel covers glucose regulation (fasting glucose, fasting insulin, HbA1c), kidney function (BUN, creatinine, eGFR), electrolytes, liver enzymes (AST, ALT, GGT, ALP), and a full lipid panel. It also includes iron studies (serum iron, ferritin, TIBC, transferrin saturation), thyroid markers (TSH, free T4, free T3), inflammatory markers (hs-CRP, ESR, homocysteine), key nutrients (vitamin D, magnesium, vitamin B12), and a complete blood count with differential.
This core set of biomarkers provides the data needed to generate a comprehensive Functional Health Report and identify the most common patterns of dysfunction seen in functional medicine practice.
Clinical context determines whether additional markers are warranted. A patient presenting with chronic fatigue and suspected adrenal imbalance may benefit from DHEA-S and cortisol testing. Cardiovascular risk assessment may call for ApoB, Lp(a), and LDL particle size. Suspected autoimmune activity may require TPO and thyroglobulin antibody testing.
The key is to let the clinical picture guide the panel rather than ordering every available test. Targeted expansion produces actionable data without unnecessary cost or complexity.
The challenges that make blood chemistry interpretation slow, inconsistent, or incomplete are not inevitable. They stem from specific, identifiable gaps: reliance on broad conventional ranges, isolated marker evaluation, manual workflows, and inconsistent training. Each of these gaps has a corresponding solution.
Adopting optimal reference intervals gives you the resolution to detect early dysfunction. Pattern-based interpretation connects individual findings into a coherent clinical picture. Automated analysis platforms compress a 40-minute manual process into minutes. And structured certification programs ensure that every practitioner in your clinic applies the same evidence-based interpretive framework.
Optimal DX brings these solutions together in a single platform, combining automated biomarker scoring, multi-marker pattern recognition, and practitioner-facing Functional Health Reports with the educational resources needed to build lasting clinical expertise. The result is faster analysis, more consistent interpretation, and clearer patient communication across every blood panel you review.
Functional blood chemistry analysis evaluates standard lab biomarkers against narrower optimal ranges to identify dysfunction before it progresses to disease. Optimal DX automates this process by scoring each biomarker, flagging multi-marker patterns, and generating evidence-based Functional Health Reports that practitioners can share directly with patients.
Standard reference intervals are derived from broad population averages that include individuals with undetected illness. A result labeled "normal" may still reflect early metabolic, hormonal, or nutritional imbalance. Functional interpretation using optimal ranges catches these subclinical shifts that conventional reporting overlooks.
Manual interpretation of a comprehensive blood panel typically takes 25 to 40 minutes per patient. The Optimal DX platform reduces that time to minutes by automating data import, biomarker scoring against optimal ranges, pattern recognition, and report generation.
A standard functional panel covers glucose regulation, kidney function, electrolytes, liver enzymes, lipids, iron studies, thyroid markers, inflammatory markers, key nutrients, and a complete blood count. Optimal DX provides suggested panel configurations, including ODX Vital, ODX Max, and ODX Ultimate, to help practitioners select the right level of depth.
Optimal ranges shift the detection window earlier in the disease progression timeline. Identifying imbalances while they are still reversible through dietary, lifestyle, and supplemental interventions allows practitioners to correct dysfunction before it advances to a formal clinical condition. This proactive approach aligns with the core mission of functional medicine.
A shared analytical platform applies the same evidence-based scoring algorithms to every panel, regardless of which practitioner reviews it. Optimal DX supports multi-user workspaces, reusable protocol templates, and standardized Functional Health Reports that ensure interpretation consistency across your entire clinical team.