Using an in-depth and interactive report that clearly communicates changes in patient blood test results is crucial for practitioners and their patients to understand the implications of the data over time. Optimal DX's Comparative Report serves this purpose by presenting an innovative approach to tracking and analyzing these changes.
Here's a detailed explanation of this reporting methodology designed for practitioners:
Overview of the Comparative Report
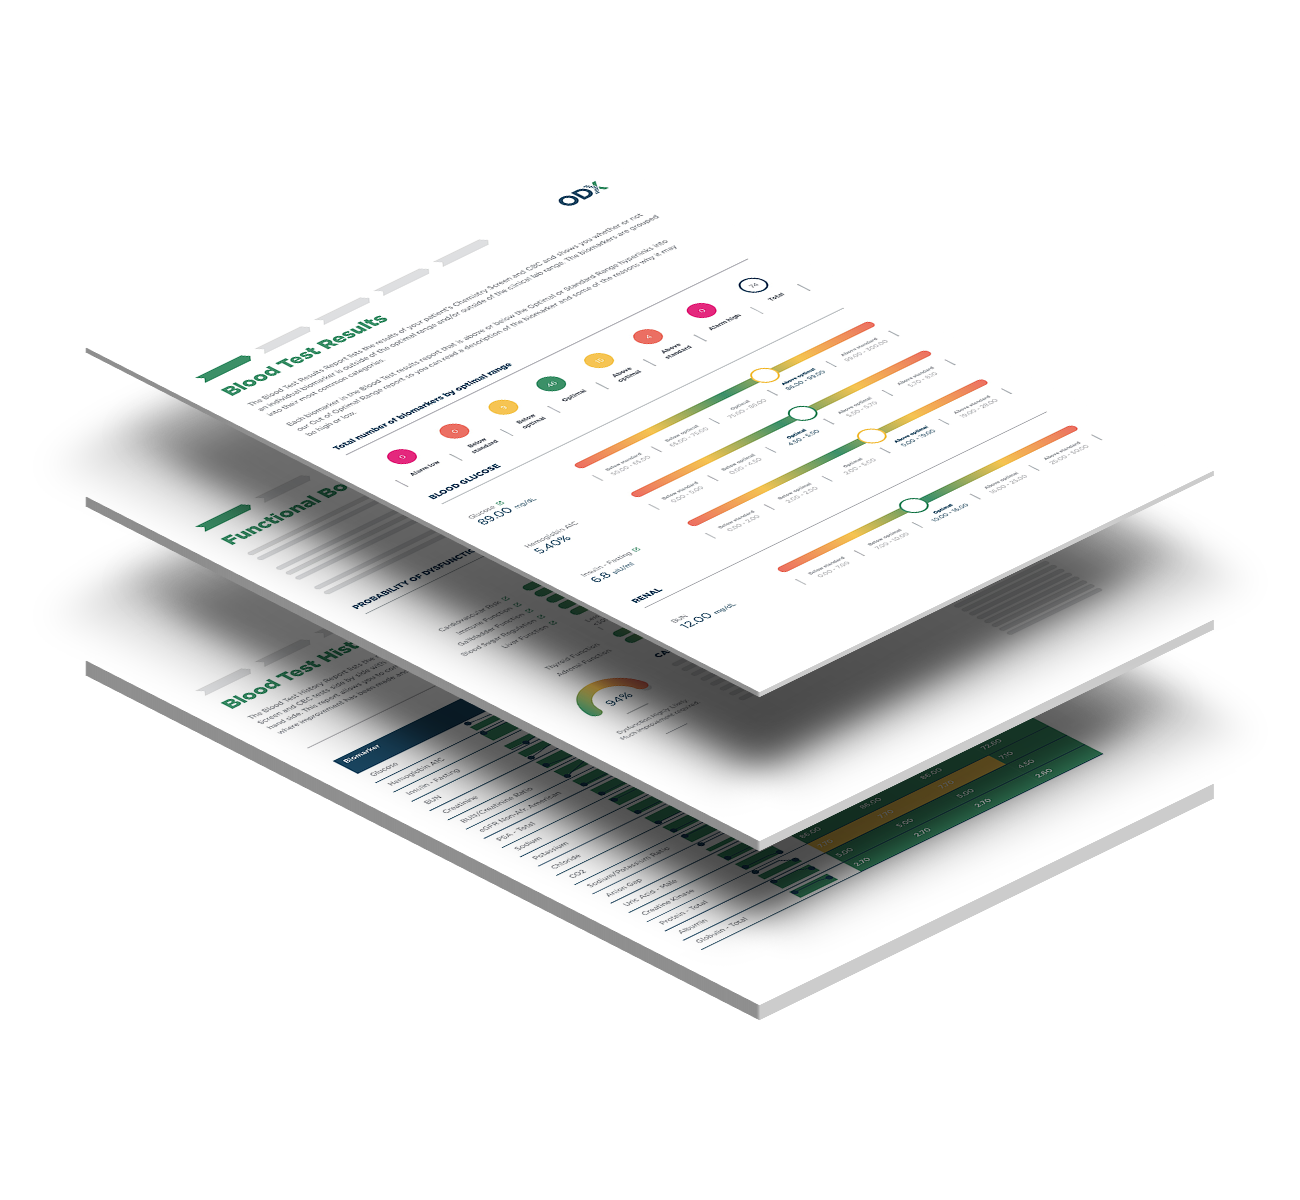
Optimal DX’s Comparative Report is designed to enhance the analysis of blood test results by providing a visual and interactive comparison between a patient's current and previous test results. This comparison facilitates a deeper understanding of a patient's health trends over time, offering insights into whether their condition is improving, remaining stable, or showing signs of potential health issues.
Thumbs Up and Thumbs Down Icons: Interpretation
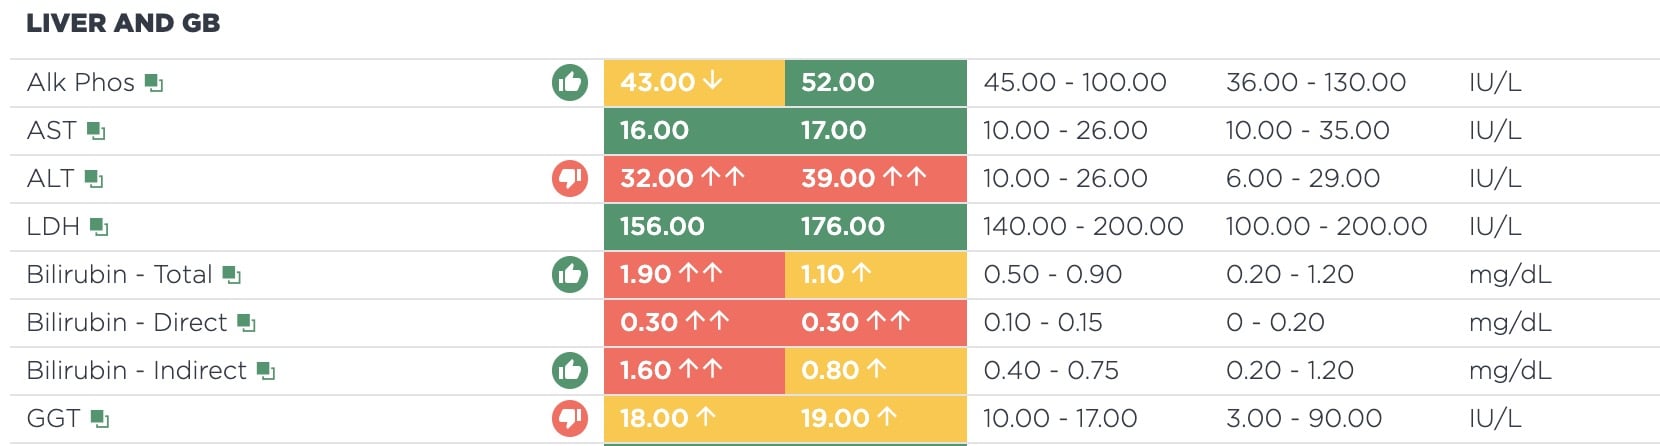
In the Comparative Report, we use two primary symbols to indicate changes in biomarker levels:
- Thumbs Up Icon: This icon signifies that a biomarker has shown improvement since the last test. Improvement is defined as movement towards or within the optimal range for that specific biomarker. It's important to note that an improvement does not necessarily mean the biomarker is within the ideal range but is moving in a positive direction. For instance, a biomarker that is out of range but has shown progress toward the target range will receive a thumbs-up.
- Thumbs Down Icon: Conversely, this icon indicates that a biomarker has moved in an unfavorable direction, either further away from the optimal range or from within the range to outside. This movement suggests that the patient's condition in relation to that specific biomarker may require attention or intervention.
Significance of Trend Analysis
The primary aim of using these icons is not to label biomarker levels as inherently "good" or "bad" but to provide a clear, at-a-glance understanding of the direction of change. This trend analysis is crucial because:
- Contextual Insight: It offers practitioners a quick way to identify which areas are improving and which are deteriorating, enabling a more focused discussion on lifestyle, medication, or dietary adjustments.
- Patient Engagement: Using intuitive icons like thumbs up and thumbs down can help patients better understand their health progress, fostering a sense of involvement and motivation in their health journey.
- Strategic Health Management: It allows for strategic health management by highlighting areas of improvement and concern, aiding in personalized health planning.
Application in Clinical Practice
In clinical practice, the Comparative Report serves as a powerful tool for practitioners to:
- Engage in meaningful conversations with their patients about their health trajectory.
- Make informed decisions on treatment plans based on trends rather than single-point-in-time values.
- Educate patients on the significance of each biomarker and the impact of lifestyle choices on their health.
Conclusion
Optimal DX's Comparative Report methodology, with its thumbs-up and thumbs-down icons, provides a user-friendly way to convey complex information about changes in blood test results. By focusing on trends and improvements, it encourages a more nuanced approach to health monitoring and management, empowering practitioners and patients alike to pursue optimal health outcomes.