


Explore over 200 essential biomarkers and their role in major body systems. Understand the significance of each marker, access optimal ranges, dive into detailed blog posts, and review the research that powers this comprehensive guide.
In our role as healthcare practitioners, we provide insights into the overall health of our patients, potential health risks they may face, and actionable measures to guide them toward optimal well-being. Central to this approach is the philosophy of Functional Medicine. A powerful tool to embody the principles of Functional Medicine is the assessment of blood biomarkers in our patients. These biomarkers offer a glimpse into the intricate operations of the body. When interpreted through functional analysis, they furnish a detailed and context-rich view of an individual's health trajectory. Monitoring these biomarker fluctuations over time allows us to offer profound insights, empowering our patients to lead healthier lives. Refer to this guide to become acquainted with every biomarker featured on the ODX Platform.
Want to see the impact Optimal DX Software’s analytical, interpretive, and tracking functionality can have on your practice? Sign up for an ODX Account and find out for yourself.

Elevated blood glucose levels are indicative of metabolic disturbances. Such elevations are not only linked to diabetes but also to other cardiometabolic risk factors, including visceral obesity, metabolic syndrome, hypertension, dyslipidemia, and cardiovascular disease. There are multiple biomarkers that signify the body's capacity to maintain blood glucose balance. It's imperative that these levels remain within the precise range to ensure appropriate glucose distribution to tissues and the brain without an excess accumulation. Monitoring these markers longitudinally facilitates early identification of potential disruptions in glucose homeostasis. Prompt interventions can mitigate the risk of evolving into pronounced chronic conditions like diabetes and cardiovascular diseases. It's important to note that disruptions in blood glucose regulation don't manifest abruptly but progress gradually. Hence, a thorough blood test analysis can offer vital indications of any underlying dysregulation and its specific nature.
Glucose, Fasting, Plasma
Measuring blood glucose levels while fasting can help detect abnormalities in glucose regulation, such as hyperglycemia (high blood glucose levels) and hypoglycemia (low blood glucose levels). Glucose, a simple sugar, plays a crucial role in providing energy to our cells, especially the brain and muscles cells. Glucose can be immediately used or stored as glycogen for later use. However, if glucose levels remain elevated in the blood, it can lead to damaging effects on proteins, cells, tissues, and blood vessels, ultimately resulting in chronic diseases like diabetes mellitus, cardiovascular disease, and kidney failure. Hence, it is vital to address high blood glucose levels early on by making lifestyle and nutritional changes.
Standard Range: 65-99 mg/dL (3.6 -5.5 mmol/L)
OPTIMAL DX MEMBERS CLICK HERE for more information on Blood Glucose, Fasting
References
American Diabetes Association. “2. Classification and Diagnosis of Diabetes: Standards of Medical Care in Diabetes-2020.” Diabetes care vol. 43,Suppl 1 (2020): S14-S31. doi:10.2337/dc20-S002
American Diabetes Association. “2. Classification and Diagnosis of Diabetes: Standards of Medical Care in Diabetes-2021.” Diabetes care vol. 44,Suppl 1 (2021): S15-S33. doi:10.2337/dc21-S002
Bancks, Michael P et al. “Long-term Absolute Risk for Cardiovascular Disease Stratified by Fasting Glucose Level.” Diabetes care vol. 42,3 (2019): 457-465. doi:10.2337/dc18-1773
Bjornholt, J V et al. “Fasting blood glucose: an underestimated risk factor for cardiovascular death. Results from a 22-year follow-up of healthy nondiabetic men.” Diabetes care vol. 22,1 (1999): 45-9. doi:10.2337/diacare.22.1.45
Bowen, Michael E et al. “Random blood glucose: a robust risk factor for type 2 diabetes.” The Journal of clinical endocrinology and metabolism vol. 100,4 (2015): 1503-10. doi:10.1210/jc.2014-4116
Gerstein, H C et al. “Relationship of glucose and insulin levels to the risk of myocardial infarction: a case-control study.” Journal of the American College of Cardiology vol. 33,3 (1999): 612-9. doi:10.1016/s0735-1097(98)00637-8
Fernandez-Friera, Leticia et al. “Normal LDL-Cholesterol Levels Are Associated With Subclinical Atherosclerosis in the Absence of Risk Factors.” Journal of the American College of Cardiology vol. 70,24 (2017): 2979-2991. doi:10.1016/j.jacc.2017.10.024
Mayans, Laura. “Metabolic Syndrome: Insulin Resistance and Prediabetes.” FP essentials vol. 435 (2015): 11-6.
Nichols, Gregory A et al. “Normal fasting plasma glucose and risk of type 2 diabetes diagnosis.” The American journal of medicine vol. 121,6 (2008): 519-24. doi:10.1016/j.amjmed.2008.02.026
Pagana, Kathleen Deska; Pagana, Timothy J.; Pagana, Theresa N. Mosby's Diagnostic and Laboratory Test Reference. Elsevier Health Sciences. 2019.
Park, Chanshin et al. “Fasting glucose level and the risk of incident atherosclerotic cardiovascular diseases.” Diabetes care vol. 36,7 (2013): 1988-93. doi:10.2337/dc12-1577
Shaye, Kivity et al. “Fasting glucose levels within the high normal range predict cardiovascular outcome.” American heart journal vol. 164,1 (2012): 111-6. doi:10.1016/j.ahj.2012.03.023
Glucose, Non-Fasting
Non-fasting "postprandial" glucose refers to the glucose levels reached after a meal. If blood glucose levels fail to return to premeal levels within 2 hours, it may indicate glucose dysregulation. It's worth noting that postprandial glucose levels cannot be detected through fasting glucose or HbA1C tests. However, it's essential to identify and address any significant postprandial variations or "excursions" in blood glucose as they can be harmful to overall glycemic control. One useful guideline is to limit postprandial glucose increases to no more than 40 mg/dL (2.22 mmol/L) above fasting levels.
OPTIMAL DX MEMBERS CLICK HERE for more information on Non-fasting Blood Glucose
References
Bonora, E et al. “Prevalence and correlates of post-prandial hyperglycemia in a large sample of patients with type 2 diabetes mellitus.” Diabetologia vol. 49,5 (2006): 846-54. doi:10.1007/s00125-006-0203-x
Bowen, Michael E et al. “Random blood glucose: a robust risk factor for type 2 diabetes.” The Journal of clinical endocrinology and metabolism vol. 100,4 (2015): 1503-10. doi:10.1210/jc.2014-4116
Bergman, Michael et al. “Review of methods for detecting glycemic disorders.” Diabetes research and clinical practice vol. 165 (2020): 108233. doi:10.1016/j.diabres.2020.108233
Cassidy, Yvonne M., Emeir M. McSorley, and Philip J. Allsopp. "Effect of soluble dietary fiber on postprandial blood glucose response and its potential as a functional food ingredient." Journal of functional foods (2018).
Dunstan, David W et al. “Breaking up prolonged sitting reduces postprandial glucose and insulin responses.” Diabetes care vol. 35,5 (2012): 976-83. doi:10.2337/dc11-1931 Leung, Gloria K W et al. “Time of day difference in postprandial glucose and insulin responses: Systematic review and meta-analysis of acute postprandial studies.” Chronobiology international vol. 37,3 (2020): 311-326. doi:10.1080/07420528.2019.1683856
Madsbad, Sten. “Impact of postprandial glucose control on diabetes-related complications: How is the evidence evolving?.” Journal of diabetes and its complications vol. 30,2 (2016): 374-85. doi:10.1016/j.jdiacomp.2015.09.019
Pagana, Kathleen Deska; Pagana, Timothy J.; Pagana, Theresa N. Mosby's Diagnostic and Laboratory Test Reference. Elsevier Health Sciences. 2019.
Shukla, Alpana P et al. “Food Order Has a Significant Impact on Postprandial Glucose and Insulin Levels.” Diabetes care vol. 38,7 (2015): e98-9. doi:10.2337/dc15-0429
Hemoglobin A1C
Hemoglobin A1C (HbA1C) levels indicate the percentage of hemoglobin that has become glycosylated over time, affecting its ability to oxygenate tissues. Low HbA1C levels may indicate chronic hypoglycemia or other issues, while high levels are associated with diabetes, cardiovascular disease risk, and other conditions.
The HbA1C test is used to diagnose prediabetes and diabetes, monitor blood glucose control, and evaluate treatment efficacy. Maintaining a lower HbA1C can help reduce the risk of blood glucose dysregulation.
Evaluating HbA1C along with other glucose regulation biomarkers can provide a clearer clinical picture of diabetes risk and control, as well as overall cardiovascular risk.
References
Adamska, E et al. “The usefulness of glycated hemoglobin A1c (HbA1c) for identifying dysglycemic states in individuals without previously diagnosed diabetes.” Advances in medical sciences vol. 57,2 (2012): 296-301. doi:10.2478/v10039-012-0030-x
American Diabetes Association. “2. Classification and Diagnosis of Diabetes: Standards of Medical Care in Diabetes-2021.” Diabetes care vol. 44,Suppl 1 (2021): S15-S33. doi:10.2337/dc21-S002
Bonora, E et al. “Prevalence and correlates of post-prandial hyperglycaemia in a large sample of patients with type 2 diabetes mellitus.” Diabetologia vol. 49,5 (2006): 846-54. doi:10.1007/s00125-006-0203-x
Bowen, Michael E et al. “Random blood glucose: a robust risk factor for type 2 diabetes.” The Journal of clinical endocrinology and metabolism vol. 100,4 (2015): 1503-10. doi:10.1210/jc.2014-4116
Fernandez-Friera, Leticia et al. “Normal LDL-Cholesterol Levels Are Associated With Subclinical Atherosclerosis in the Absence of Risk Factors.” Journal of the American College of Cardiology vol. 70,24 (2017): 2979-2991. doi:10.1016/j.jacc.2017.10.024
Harrington, Jennifer et al. “Aortic intima media thickness is an early marker of atherosclerosis in children with type 1 diabetes mellitus.” The Journal of pediatrics vol. 156,2 (2010): 237-41. doi:10.1016/j.jpeds.2009.08.036
Khaw, Kay-Tee et al. “Association of hemoglobin A1c with cardiovascular disease and mortality in adults: the European prospective investigation into cancer in Norfolk.” Annals of internal medicine vol. 141,6 (2004): 413-20. doi:10.7326/0003-4819-141-6-200409210-00006
Lee, Ji-Eun. “Alternative biomarkers for assessing glycemic control in diabetes: fructosamine, glycated albumin, and 1,5-anhydroglucitol.” Annals of pediatric endocrinology & metabolism vol. 20,2 (2015): 74-8. doi:10.6065/apem.2015.20.2.74
Pagana, Kathleen Deska; Pagana, Timothy J.; Pagana, Theresa N. Mosby's Diagnostic and Laboratory Test Reference. Elsevier Health Sciences. 2019.
Vistisen, Dorte et al. “Risk of Cardiovascular Disease and Death in Individuals With Prediabetes Defined by Different Criteria: The Whitehall II Study.” Diabetes care vol. 41,4 (2018): 899-906. doi:10.2337/dc17-2530
Estimated Average Glucose (eAG)
Estimated average glucose is a useful tool for evaluating blood glucose control over time. It's based on HbA1C results and reflects the average daily glucose levels for the past three months. Patients may find it easier to understand as it's expressed in the same units as glucose, unlike HbA1C, which is expressed as a percentage. It's worth noting that estimated average glucose considers the variability in glucose levels, whereas fasting glucose provides a single "snapshot" of glucose control. Although fasting glucose and eAG may trend in the same direction, they cannot be used interchangeably.
OPTIMAL DX MEMBERS CLICK HERE for more information on Estimated Average Glucose (eAG)
References
Alzahrani, Nabeel et al. “Can Fasting Blood Sugar be Used as an Indicator of Long-Term Diabetic Control Instead of Estimated Average Glucose?.” Clinical laboratory vol. 66,12 (2020): 10.7754/Clin.Lab.2020.200324. doi:10.7754/Clin.Lab.2020.200324
American Diabetes Association Estimated Average Glucose/A1C conversion calculator. https://professional.diabetes.org/diapro/glucose_calc
Bozkaya, Giray et al. “The association between estimated average glucose levels and fasting plasma glucose levels.” Clinics (Sao Paulo, Brazil) vol. 65,11 (2010): 1077-80. doi:10.1590/s1807-59322010001100003
Bowen, Michael E et al. “Random blood glucose: a robust risk factor for type 2 diabetes.” The Journal of clinical endocrinology and metabolism vol. 100,4 (2015): 1503-10. doi:10.1210/jc.2014-4116
Nathan, David M et al. “Translating the A1C assay into estimated average glucose values.” Diabetes care vol. 31,8 (2008): 1473-8. doi:10.2337/dc08-0545
Ram, Nanik et al. “Relationship Between Estimated Average Glucose (eAG) and Fasting Plasma Glucose in a Cohort of Pakistani Diabetic Subjects.” Cureus vol. 13,10 e18435. 2 Oct. 2021, doi:10.7759/cureus.18435
Insulin
Insulin is a pancreatic hormone that helps regulate blood glucose levels by promoting glucose absorption into cells, among other functions. Elevated insulin levels are associated with hypertension, type 2 diabetes, and obesity. Measuring fasting insulin, along with fasting glucose, can help identify insulin resistance and predict the risk of type 2 diabetes. However, it is also important to assess C-peptide levels when evaluating insulin status, as serum insulin levels may not fully reflect pancreatic insulin production.
References
Chen, Hui et al. “Assessing the predictive accuracy of QUICKI as a surrogate index for insulin sensitivity using a calibration model.” Diabetes vol. 54,7 (2005): 1914-25. doi:10.2337/diabetes.54.7.1914
Ghasemi, Asghar et al. “Cut-off points of homeostasis model assessment of insulin resistance, beta-cell function, and fasting serum insulin to identify future type 2 diabetes: Tehran Lipid and Glucose Study.” Acta diabetologica vol. 52,5 (2015): 905-15. doi:10.1007/s00592-015-0730-3
Johnson, Linda S B et al. “Low fasting plasma insulin is associated atrial fibrillation in men from a cohort study--the Malmö preventive project.” BMC cardiovascular disorders vol. 14 107. 24 Aug. 2014, doi:10.1186/1471-2261-14-107
Katz, A et al. “Quantitative insulin sensitivity check index: a simple, accurate method for assessing insulin sensitivity in humans.” The Journal of clinical endocrinology and metabolism vol. 85,7 (2000): 2402-10. doi:10.1210/jcem.85.7.6661
Newsholme, E A, and G Dimitriadis. “Integration of biochemical and physiologic effects of insulin on glucose metabolism.” Experimental and clinical endocrinology & diabetes : official journal, German Society of Endocrinology [and] German Diabetes Association vol. 109 Suppl 2 (2001): S122-34. doi:10.1055/s-2001-18575
Newsholme, Philip, and Mauricio Krause. “Nutritional regulation of insulin secretion: implications for diabetes.” The Clinical biochemist. Reviews vol. 33,2 (2012): 35-47.
Novac, Carmen et al. “Short Update on C-Peptide and its Clinical Value.” Maedica vol. 14,1 (2019): 53-58. doi:10.26574/maedica.2019.14.1.53
Pagana, Kathleen Deska, et al. Mosby's Diagnostic and Laboratory Test Reference. 16th ed., Mosby, 2022.
Vargas, Elizabeth, et al. “Biochemistry, Insulin Metabolic Effects.” StatPearls, StatPearls Publishing, 1 February 2021.
Wang, Xu et al. “Associations between serum total, free and bioavailable testosterone and non-alcoholic fatty liver disease in community-dwelling middle-aged and elderly women.” Diabetes & metabolism vol. 47,3 (2021): 101199. doi:10.1016/j.diabet.2020.09.007
Yang, Chen Die et al. “Insulin resistance and dysglycemia are associated with left ventricular remodeling after myocardial infarction in non-diabetic patients.” Cardiovascular diabetology vol. 18,1 100. 7 Aug. 2019, doi:10.1186/s12933-019-0904-3
C-Peptide
C-peptide, a crucial blood biomarker, provides valuable insights into the pancreatic function and insulin production. Derived from the cleavage of proinsulin within the pancreas' beta cells, C-peptide is vital in assessing diabetes management and diagnosing various endocrine disorders. Interestingly, it has also been found to possess therapeutic properties, including promoting blood flow, oxygenation, vasodilation, and supporting nerve and kidney functions.
References
Novac, Carmen et al. “Short Update on C-Peptide and its Clinical Value.” Maedica vol. 14,1 (2019): 53-58. doi:10.26574/maedica.2019.14.1.53
Pagana, Kathleen Deska; Pagana, Timothy J.; Pagana, Theresa N. Mosby's Diagnostic and Laboratory Test Reference. Elsevier Health Sciences. 2019.
Patel, Nileshkumar et al. “Fasting serum C-peptide levels predict cardiovascular and overall death in nondiabetic adults.” Journal of the American Heart Association vol. 1,6 (2012): e003152. doi:10.1161/JAHA.112.003152
Venugopal, Senthil K., et al. “C Peptide.” StatPearls, StatPearls Publishing, 29 May 2021.
Yosten, Gina L C et al. “Physiological effects and therapeutic potential of proinsulin C-peptide.” American journal of physiology. Endocrinology and metabolism vol. 307,11 (2014): E955-68. doi:10.1152/ajpendo.00130.2014
HOMA2-IR
Insulin sensitivity refers to the ability of tissues to respond to insulin and take up circulating glucose. Homeostatic Model Assessment (HOMA) calculations are utilized to evaluate insulin resistance, sensitivity, and diabetes risk, with updated HOMA2 calculations being better at predicting diabetes progression. Increasing HOMA2-IR values indicate worsening insulin resistance and sensitivity, which can lead to metabolic syndrome and type 2 diabetes.
Healthy individuals typically have a HOMA2-IR of 1.2, while values of 1.4 or greater suggest insulin resistance and metabolic syndrome. HOMA2-IR has an inverse correlation with serum 25(OH) vitamin D levels, and vitamin D supplementation can significantly improve insulin resistance in vitamin D-deficient individuals, particularly when daily doses are used instead of large bolus doses.
OPTIMAL DX MEMBERS CLICK HERE for more information on HOMA2-IR
References
Demir, Ayşe Kevser et al. “Prevalence of insulin resistance and identifying HOMA1-IR and HOMA2-IR indexes in the Middle Black Sea region of Turkey.” African health sciences vol. 20,1 (2020): 277-286. doi:10.4314/ahs.v20i1.33
Dutta, Deep et al. “Serum vitamin-D predicts insulin resistance in individuals with prediabetes.” The Indian journal of medical research vol. 138,6 (2013): 853-60.
Elsafty, Ahmed, et al. "Specific Cutoffs for HOMA1-IR, HOMA2-IR, HOMA1-% B, and HOMA2-% B in Adult Egyptian Patients." American Journal of Clinical Pathology 150.suppl_1 (2018): S66-S66.
Exebio, Joel C et al. “Use of Homeostatic Model Assessment Indexes for the Identification of Metabolic Syndrome and Insulin Resistance among Cuban-Americans: A Cross Sectional Study.” British journal of medicine and medical research vol. 4,29 (2014): 4824-4833. doi:10.9734/BJMMR/2014/8988
Ghasemi, Asghar et al. “Cut-off points of homeostasis model assessment of insulin resistance, beta-cell function, and fasting serum insulin to identify future type 2 diabetes: Tehran Lipid and Glucose Study.” Acta diabetologica vol. 52,5 (2015): 905-15. doi:10.1007/s00592-015-0730-3
Liu, Yingshan et al. “Insulin resistance is independently associated with cardiovascular autonomic neuropathy in type 2 diabetes.” Journal of diabetes investigation vol. 12,9 (2021): 1651-1662. doi:10.1111/jdi.13507
Mojiminiyi, Olusegun A, and Nabila A Abdella. “Effect of homeostasis model assessment computational method on the definition and associations of insulin resistance.” Clinical chemistry and laboratory medicine vol. 48,11 (2010): 1629-34. doi:10.1515/CCLM.2010.303
Song, Young Seok et al. “Comparison of the Usefulness of the Updated Homeostasis Model Assessment (HOMA2) with the Original HOMA1 in the Prediction of Type 2 Diabetes Mellitus in Koreans.” Diabetes & metabolism journal vol. 40,4 (2016): 318-25. doi:10.4093/dmj.2016.40.4.318
Tohidi, Maryam et al. “Fasting plasma glucose is a stronger predictor of diabetes than triglyceride-glucose index, triglycerides/high-density lipoprotein cholesterol, and homeostasis model assessment of insulin resistance: Tehran Lipid and Glucose Study.” Acta diabetologica vol. 55,10 (2018): 1067-1074. doi:10.1007/s00592-018-1195-y
von Hurst, Pamela R et al. “Vitamin D supplementation reduces insulin resistance in South Asian women living in New Zealand who are insulin resistant and vitamin D deficient - a randomised, placebo-controlled trial.” The British journal of nutrition vol. 103,4 (2010): 549-55. doi:10.1017/S0007114509992017
Wamil M, Coleman RL, Adler AI, McMurray JJV, Holman RR. Increased Risk of Incident Heart Failure and Death Is Associated With Insulin Resistance in People With Newly Diagnosed Type 2 Diabetes: UKPDS 89. Diabetes Care. 2021;44(8):1877-1884. doi:10.2337/dc21-0429
HOMA2-%B
HOMA2-%B represents beta cell function and insulin production. It may increase with persistent insulin resistance as the pancreas tries to compensate by producing more insulin to maintain normal glucose levels. However, as beta cells start to fail, HOMA2-%B declines, signaling progression toward diabetes. Insulin resistance is an important risk factor for metabolic syndrome, type 2 diabetes, and cardiovascular disease. It is essential to evaluate HOMA2-%B alongside insulin sensitivity using HOMA2-%S to get a clearer picture of glucose tolerance and diabetes risk.
OPTIMAL DX MEMBERS CLICK HERE for more information on HOMA2-%B
References
Caumo, Andrea et al. “New insights on the simultaneous assessment of insulin sensitivity and beta-cell function with the HOMA2 method.” Diabetes care vol. 29,12 (2006): 2733-4. doi:10.2337/dc06-0070
Elsafty, Ahmed, et al. "Specific Cutoffs for HOMA1-IR, HOMA2-IR, HOMA1-% B, and HOMA2-% B in Adult Egyptian Patients." American Journal of Clinical Pathology 150.suppl_1 (2018): S66-S66.
Endukuru, Chiranjeevi Kumar et al. “Cut-off Values and Clinical Utility of Surrogate Markers for Insulin Resistance and Beta-Cell Function to Identify Metabolic Syndrome and Its Components among Southern Indian Adults.” Journal of obesity & metabolic syndrome vol. 29,4 (2020): 281-291. doi:10.7570/jomes20071
Ghasemi, Asghar et al. “Cut-off points of homeostasis model assessment of insulin resistance, beta-cell function, and fasting serum insulin to identify future type 2 diabetes: Tehran Lipid and Glucose Study.” Acta diabetologica vol. 52,5 (2015): 905-15. doi:10.1007/s00592-015-0730-3
Hill, Nathan R et al. “Expansion of the homeostasis model assessment of β-cell function and insulin resistance to enable clinical trial outcome modeling through the interactive adjustment of physiology and treatment effects: iHOMA2.” Diabetes care vol. 36,8 (2013): 2324-30. doi:10.2337/dc12-0607
HOMA2-%S
HOMA2-%S represents the sensitivity of peripheral tissues to insulin, reflecting their ability to take up glucose from the bloodstream. Higher values indicate greater responsiveness to insulin. However, when insulin is chronically elevated due to persistently high glucose levels, tissue insulin sensitivity, and HOMA2-%S values decrease. It is important to evaluate all HOMA2 values (HOMA2-IR, -%B, and %S) to determine an individual's position on the blood sugar dysregulation spectrum. Prediabetes and early stages of type 2 diabetes are characterized by decreased HOMA2-%S, elevated HOMA2-IR, and elevated HOMA2-%B. Eventually, as beta cells fail, both HOMA2-%S and HOMA2-%B decrease while HOMA2-IR increases.
OPTIMAL DX MEMBERS CLICK HERE for more information on HOMA2-%S
References
Caumo, Andrea et al. “New insights on the simultaneous assessment of insulin sensitivity and beta-cell function with the HOMA2 method.” Diabetes care vol. 29,12 (2006): 2733-4. doi:10.2337/dc06-0070
Ghasemi, Asghar et al. “Cut-off points of homeostasis model assessment of insulin resistance, beta-cell function, and fasting serum insulin to identify future type 2 diabetes: Tehran Lipid and Glucose Study.” Acta diabetologica vol. 52,5 (2015): 905-15. doi:10.1007/s00592-015-0730-3
Raverdy, Violeta et al. “Incidence and Predictive Factors of Postprandial Hyperinsulinemic Hypoglycemia After Roux-en-Y Gastric Bypass: A Five year Longitudinal Study.” Annals of surgery vol. 264,5 (2016): 878-885. doi:10.1097/SLA.0000000000001915
QUICKI
The Quantitative Insulin Sensitivity Check Index (QUICKI) values are calculated using fasting glucose and insulin levels to generate a value that assesses insulin sensitivity. These values indicate insulin sensitivity, with lower values indicating reduced insulin sensitivity and increased insulin resistance, while higher values indicate better insulin sensitivity. Essentially, the higher the QUICKI, the better the insulin sensitivity and metabolic control.
OPTIMAL DX MEMBERS CLICK HERE for more information on QUICKI
References
Chen, Hui et al. “Assessing the predictive accuracy of QUICKI as a surrogate index for insulin sensitivity using a calibration model.” Diabetes vol. 54,7 (2005): 1914-25. doi:10.2337/diabetes.54.7.1914
Endukuru, Chiranjeevi Kumar et al. “Cut-off Values and Clinical Utility of Surrogate Markers for Insulin Resistance and Beta-Cell Function to Identify Metabolic Syndrome and Its Components among Southern Indian Adults.” Journal of obesity & metabolic syndrome vol. 29,4 (2020): 281-291. doi:10.7570/jomes20071
Hauache, Omar M, and José G H Vieira. “Fasting insulin concentration is highly correlated with quantitative insulin sensitivity check index.” Endocrine vol. 21,2 (2003): 137-8. doi:10.1385/ENDO:21:2:137
Katz, A et al. “Quantitative insulin sensitivity check index: a simple, accurate method for assessing insulin sensitivity in humans.” The Journal of clinical endocrinology and metabolism vol. 85,7 (2000): 2402-10. doi:10.1210/jcem.85.7.6661
Fructosamine
Fructosamine is a blood biomarker that is used to monitor glucose control over a shorter period than hemoglobin A1C (HbA1C). This biomarker measures the level of glycated serum proteins, specifically albumin, which reflects blood glucose levels over the past two to three weeks. Fructosamine is particularly useful for people with diabetes, as it provides a more accurate reflection of recent blood glucose control compared to HbA1C, which reflects average blood glucose levels over a longer period of time. By measuring fructosamine levels, healthcare providers can adjust treatment plans and help individuals maintain better glucose control.
OPTIMAL DX MEMBERS CLICK HERE for more information on Fructosamine
References
Barakatun Nisak, M Y et al. “Medical nutrition therapy administered by a dietitian yields favourable diabetes outcomes in individual with type 2 diabetes mellitus.” The Medical journal of Malaysia vol. 68,1 (2013): 18-23.
Bergman, Michael et al. “Review of methods for detecting glycemic disorders.” Diabetes research and clinical practice vol. 165 (2020): 108233. doi:10.1016/j.diabres.2020.108233
Doumatey, Ayo P et al. “Serum fructosamine and glycemic status in the presence of the sickle cell mutation.” Diabetes research and clinical practice vol. 177 (2021): 108918. doi:10.1016/j.diabres.2021.108918
Gounden, Verena, et al. “Fructosamine.” StatPearls, StatPearls Publishing, 11 August 2021.
Lee, Ji-Eun. “Alternative biomarkers for assessing glycemic control in diabetes: fructosamine, glycated albumin, and 1,5-anhydroglucitol.” Annals of pediatric endocrinology & metabolism vol. 20,2 (2015): 74-8. doi:10.6065/apem.2015.20.2.74
Pagana, Kathleen Deska; Pagana, Timothy J.; Pagana, Theresa N. Mosby's Diagnostic and Laboratory Test Reference. Elsevier Health Sciences. 2019.
Selvin, Elizabeth et al. “Nontraditional markers of glycemia: associations with microvascular conditions.” Diabetes care vol. 34,4 (2011): 960-7. doi:10.2337/dc10-1945
Selvin, Elizabeth et al. “Establishment of Community-Based Reference Intervals for Fructosamine, Glycated Albumin, and 1,5-Anhydroglucitol.” Clinical chemistry vol. 64,5 (2018): 843-850. doi:10.1373/clinchem.2017.285742
Adiponectin
Adiponectin is a hormone that is produced by adipose tissue or fat cells, and it can positively impact our health by reducing inflammation and oxidative stress while also improving insulin sensitivity. The adiponectin level in our blood is often used to indicate metabolic health. Low levels have been associated with several health conditions, including obesity, insulin resistance, diabetes, cardiovascular disease, and cancer.
OPTIMAL DX MEMBERS CLICK HERE for more information on Adiponectin
References
Abdella, Nabila A, and Olusegun A Mojiminiyi. “Clinical Applications of Adiponectin Measurements in Type 2 Diabetes Mellitus: Screening, Diagnosis, and Marker of Diabetes Control.” Disease markers vol. 2018 5187940. 5 Jul. 2018, doi:10.1155/2018/5187940
Achari, Arunkumar E, and Sushil K Jain. “Adiponectin, a Therapeutic Target for Obesity, Diabetes, and Endothelial Dysfunction.” International journal of molecular sciences vol. 18,6 1321. 21 Jun. 2017, doi:10.3390/ijms18061321
Aleidi S, Issa A, Bustanji H, Khalil M, Bustanji Y. Adiponectin serum levels correlate with insulin resistance in type 2 diabetic patients. Saudi Pharm J. 2015;23(3):250-256. doi:10.1016/j.jsps.2014.11.011
Bluher, M et al. “Association of interleukin-6, C-reactive protein, interleukin-10 and adiponectin plasma concentrations with measures of obesity, insulin sensitivity and glucose metabolism.” Experimental and clinical endocrinology & diabetes : official journal, German Society of Endocrinology [and] German Diabetes Association vol. 113,9 (2005): 534-7. doi:10.1055/s-2005-872851
Gatselis, Nikolaos K et al. “Adiponectin: a key playmaker adipocytokine in non-alcoholic fatty liver disease.” Clinical and experimental medicine vol. 14,2 (2014): 121-31. doi:10.1007/s10238-012-0227-0
Liu, Zhengtao et al. “Meta-Analysis of Adiponectin as a Biomarker for the Detection of Metabolic Syndrome.” Frontiers in physiology vol. 9 1238. 19 Sep. 2018, doi:10.3389/fphys.2018.01238
Patel, Dharmik S., et al. "Leptin, adiponectin and its molar ratio as a biomarker in the diagnosis of metabolic syndrome." Indian J. Physiol. Pharmacol 59 (2015): 290-297.
Schulze, Matthias B et al. “Relationship between adiponectin and glycemic control, blood lipids, and inflammatory markers in men with type 2 diabetes.” Diabetes care vol. 27,7 (2004): 1680-7. doi:10.2337/diacare.27.7.1680
Stern, Jennifer H et al. “Adiponectin, Leptin, and Fatty Acids in the Maintenance of Metabolic Homeostasis through Adipose Tissue Crosstalk.” Cell metabolism vol. 23,5 (2016): 770-84. doi:10.1016/j.cmet.2016.04.011
Straub, Leon G., and Philipp E. Scherer. "Metabolic messengers: adiponectin." Nature Metabolism 1.3 (2019): 334-339.
Wang, Zhao V, and Philipp E Scherer. “Adiponectin, the past two decades.” Journal of molecular cell biology vol. 8,2 (2016): 93-100. doi:10.1093/jmcb/mjw011
ALT:AST Ratio
ALT and AST are enzymes involved in gluconeogenesis, the production of “new” glucose from the amino acids alanine and aspartate. The ALT:AST ratio is a biomarker that can help assess metabolic dysfunction. When the ratio of ALT to AST increases, it can suggest poor blood glucose regulation, insulin resistance, metabolic syndrome, undiagnosed diabetes, or non-alcoholic fatty liver disease. Additionally, an elevated ALT:AST ratio has been linked to an increased risk of cardiovascular disease.
OPTIMAL DX MEMBERS CLICK HERE for more information on ALT:AST Ratio
References
Kawamoto R, Kohara K, Kusunoki T, et al. Alanine aminotransferase/aspartate aminotransferase ratio is the best surrogate marker for insulin resistance in non-obese Japanese adults. Cardiovasc Diabetol. 2012 Oct 1;11:117,
Kwon SS, Lee SG. A High Alanine Aminotransferase/Aspartate Aminotransferase Ratio Determines Insulin Resistance and Metabolically Healthy/Unhealthy Obesity in a General Adult Population in Korea: The Korean National Health and Nutritional Examination Survey 2007-2010. Exp Clin Endocrinol Diabetes. 2019 Oct;127(10):677-684.
Lala V, Goyal A, Bansal P, Minter DA. Liver Function Tests. 2020 Mar 27. StatPearls [Internet]. Treasure Island (FL): StatPearls Publishing; 2020
Liu Z, Que S, Xu J, Peng T. Alanine aminotransferase-old biomarker and new concept: a review. Int J Med Sci. 2014 Jun 26;11(9):925-35.
Sg, R., Dhamija, R., Gurtoo, A., & Singh, R. (2017). Correlation Of Alt/ast Ratio With Insulin Resistance In Metabolic Syndrome. International Journal of Advanced Research, 5(3), 1677-1684.
Vonbank, Alexander, et al. "The alanine aminotransferase/aspartate aminotransferase ratio predicts future cardiovascular events in patients with established coronary artery disease and homa insulin resistance." Atherosclerosis 252 (2016): e64-e65.
Zhao L, Cheng J, Chen Y, et al. Serum alanine aminotransferase/aspartate aminotransferase ratio is one of the best markers of insulin resistance in the Chinese population. Nutr Metab (Lond). 2017 Oct 10;14:64.
1,5 Anhydroglucitol Glycomark®
1,5-anhydroglucitol (1,5-AG) is a monosaccharide resembling glucose, found in many foods and blood. Blood levels reflect postprandial glucose, with low levels indicating hyperglycemic postprandial spikes. A 1,5-AG level below 11.18 ug/mL can be a diagnostic cut-off for diabetes with greater sensitivity than hemoglobin A1C. Low 1,5-AG levels may reflect the presence of atherosclerosis and are associated with an increased risk of heart failure, coronary heart disease, stroke, and death. Manipulation of dietary carbohydrates can alter 1,5-AG levels, with reducing glycemic index and limiting carbohydrate intake having the greatest effect.
OPTIMAL DX MEMBERS CLICK HERE for more information on 1,5 Anhydroglucitol Glycomark
References
Bergman, Michael et al. “Review of methods for detecting glycemic disorders.” Diabetes research and clinical practice vol. 165 (2020): 108233. doi:10.1016/j.diabres.2020.108233
Juraschek, S P et al. “Effects of dietary carbohydrate on 1,5-anhydroglucitol in a population without diabetes: results from the OmniCarb trial.” Diabetic medicine : a journal of the British Diabetic Association vol. 34,10 (2017): 1407-1413. doi:10.1111/dme.13391
Ouchi, Shohei et al. “Low 1,5-anhydroglucitol levels are associated with long-term cardiac mortality in acute coronary syndrome patients with hemoglobin A1c levels less than 7.0.” Cardiovascular diabetology vol. 16,1 151. 21 Nov. 2017, doi:10.1186/s12933-017-0636-1
Selvin, Elizabeth et al. “Establishment of Community-Based Reference Intervals for Fructosamine, Glycated Albumin, and 1,5-Anhydroglucitol.” Clinical chemistry vol. 64,5 (2018): 843-850. doi:10.1373/clinchem.2017.285742
Su, Gong et al. “Effect of 1,5-anhydroglucitol levels on culprit plaque rupture in diabetic patients with acute coronary syndrome.” Cardiovascular diabetology vol. 19,1 71. 30 May. 2020, doi:10.1186/s12933-020-01045-0
Wang, Y et al. “A study on the association of serum 1,5-anhydroglucitol levels and the hyperglycaemic excursions as measured by continuous glucose monitoring system among people with type 2 diabetes in China.” Diabetes/metabolism research and reviews vol. 28,4 (2012): 357-62. doi:10.1002/dmrr.2278
Wang, Yao et al. “Serum 1,5-anhydroglucitol level as a screening tool for diabetes mellitus in a community-based population at high risk of diabetes.” Acta diabetologica vol. 54,5 (2017): 425-431. doi:10.1007/s00592-016-0944-z
Triglyceride-Glucose Index TyG Index
The Triglyceride-Glucose (TyG) Index is a clinical tool used to identify insulin resistance and forecast the likelihood of related health issues such as diabetes, cardiovascular diseases, and metabolic syndrome. An elevated TyG Index signals metabolic dysfunction and a higher risk of these disorders, highlighting the importance of early detection and intervention. This index is influenced by factors such as diet and lifestyle, and managing these can positively affect the TyG Index, improving overall metabolic health. Furthermore, the TyG Index has proven to be a more reliable predictor of insulin resistance and diabetes risk than traditional measures like fasting glucose levels, making it a significant marker in metabolic health assessments.
Below 4.4 calculated with the modified formula
Ln [fasting triglycerides (mg/dL) x fasting blood glucose (mg/dL)]/2
OPTIMAL DX MEMBERS CLICK HERE for more information on TyG Index
References
Beran, Azizullah et al. “Triglyceride-Glucose Index for Early Prediction of Nonalcoholic Fatty Liver Disease: A Meta-Analysis of 121,975 Individuals.” Journal of clinical medicine vol. 11,9 2666. 9 May. 2022, doi:10.3390/jcm11092666
Chamroonkiadtikun, Panya et al. “The triglyceride-glucose index, a predictor of type 2 diabetes development: A retrospective cohort study.” Primary care diabetes vol. 14,2 (2020): 161-167. doi:10.1016/j.pcd.2019.08.004
Guerrero-Romero, Fernando et al. “The product of triglycerides and glucose, a simple measure of insulin sensitivity. Comparison with the euglycemic-hyperinsulinemic clamp.” The Journal of clinical endocrinology and metabolism vol. 95,7 (2010): 3347-51. doi:10.1210/jc.2010-0288
Hosseini, S. Mehran. "Triglyceride-glucose index simulation." Journal of Clinical and Basic Research 1.1 (2017): 11-16.
Jin, Jing-Lu et al. “Triglyceride glucose index for predicting cardiovascular outcomes in patients with coronary artery disease.” Journal of thoracic disease vol. 10,11 (2018): 6137-6146. doi:10.21037/jtd.2018.10.79
Khan, Sikandar Hayat et al. “Metabolic clustering of risk factors: evaluation of Triglyceride-glucose index (TyG index) for evaluation of insulin resistance.” Diabetology & metabolic syndrome vol. 10 74. 5 Oct. 2018, doi:10.1186/s13098-018-0376-8
Kim, Min Kyung et al. “Relationship between the triglyceride glucose index and coronary artery calcification in Korean adults.” Cardiovascular diabetology vol. 16,1 108. 23 Aug. 2017, doi:10.1186/s12933-017-0589-4
Li, Haibin et al. “Triglyceride-glucose index variability and incident cardiovascular disease: a prospective cohort study.” Cardiovascular diabetology vol. 21,1 105. 10 Jun. 2022, doi:10.1186/s12933-022-01541-5
Liu, Xiao-Cong et al. “The Triglyceride-Glucose Index, an Insulin Resistance Marker, Was Non-linear Associated With All-Cause and Cardiovascular Mortality in the General Population.” Frontiers in cardiovascular medicine vol. 7 628109. 14 Jan. 2021, doi:10.3389/fcvm.2020.628109
Low, Serena et al. “The role of triglyceride glucose index in development of Type 2 diabetes mellitus.” Diabetes research and clinical practice vol. 143 (2018): 43-49. doi:10.1016/j.diabres.2018.06.006
Navarro-González, David et al. “Triglyceride-glucose index (TyG index) in comparison with fasting plasma glucose improved diabetes prediction in patients with normal fasting glucose: The Vascular-Metabolic CUN cohort.” Preventive medicine vol. 86 (2016): 99-105. doi:10.1016/j.ypmed.2016.01.022
Neglia, Danilo et al. “Triglyceride-glucose index predicts outcome in patients with chronic coronary syndrome independently of other risk factors and myocardial ischaemia.” European heart journal open vol. 1,1 oeab004. 24 Jul. 2021, doi:10.1093/ehjopen/oeab004
Salazar, Juan et al. “Optimal cutoff for the evaluation of insulin resistance through triglyceride-glucose index: A cross-sectional study in a Venezuelan population.” F1000Research vol. 6 1337. 7 Aug. 2017, doi:10.12688/f1000research.12170.3
Shi, Wenrui et al. “Value of triglyceride-glucose index for the estimation of ischemic stroke risk: Insights from a general population.” Nutrition, metabolism, and cardiovascular diseases : NMCD vol. 30,2 (2020): 245-253. doi:10.1016/j.numecd.2019.09.015
Su, Wei-Yu et al. “Comparison of the Effects of Fasting Glucose, Hemoglobin A1c, and Triglyceride-Glucose Index on Cardiovascular Events in Type 2 Diabetes Mellitus.” Nutrients vol. 11,11 2838. 19 Nov. 2019, doi:10.3390/nu11112838
Tian, Xue et al. “Triglyceride-glucose index is associated with the risk of myocardial infarction: an 11-year prospective study in the Kailuan cohort.” Cardiovascular diabetology vol. 20,1 19. 12 Jan. 2021, doi:10.1186/s12933-020-01210-5
Tohidi, Maryam et al. “Fasting plasma glucose is a stronger predictor of diabetes than triglyceride-glucose index, triglycerides/high-density lipoprotein cholesterol, and homeostasis model assessment of insulin resistance: Tehran Lipid and Glucose Study.” Acta diabetologica vol. 55,10 (2018): 1067-1074. doi:10.1007/s00592-018-1195-y
Zhang, Shujun et al. “The triglyceride and glucose index (TyG) is an effective biomarker to identify nonalcoholic fatty liver disease.” Lipids in health and disease vol. 16,1 15. 19 Jan. 2017, doi:10.1186/s12944-017-0409-6
Lipoprotein Insulin Resistance Index LP-IR
Insulin resistance (IR) is a metabolic condition where the body's cells become less responsive to insulin, leading to higher blood glucose and insulin levels, which can progress to type 2 diabetes (T2DM) and increase cardiovascular risk.
The Lipoprotein Insulin Resistance Index (LP-IR) is a valuable tool for assessing IR by analyzing lipoprotein particle sizes and concentrations, offering early detection even in those at low risk. Lifestyle interventions like diet changes and exercise can significantly improve insulin sensitivity and lower LP-IR scores, reducing the risk of T2DM and cardiovascular complications.
OPTIMAL DX MEMBERS CLICK HERE for more information on the LP-IR
References
Dugani, Sagar B et al. “Association of Lipoproteins, Insulin Resistance, and Rosuvastatin With Incident Type 2 Diabetes Mellitus : Secondary Analysis of a Randomized Clinical Trial.” JAMA cardiology vol. 1,2 (2016): 136-45. doi:10.1001/jamacardio.2016.0096
Ellsworth, D L et al. “Lifestyle modification interventions differing in intensity and dietary stringency improve insulin resistance through changes in lipoprotein profiles.” Obesity science & practice vol. 2,3 (2016): 282-292. doi:10.1002/osp4.54
Flores-Guerrero, Jose L et al. “Lipoprotein insulin resistance index, a high-throughput measure of insulin resistance, is associated with incident type II diabetes mellitus in the Prevention of Renal and Vascular End-Stage Disease study.” Journal of clinical lipidology vol. 13,1 (2019): 129-137.e1. doi:10.1016/j.jacl.2018.11.009
Fosam, Andin et al. “Lipoprotein Insulin Resistance Index: A Simple, Accurate Method for Assessing Insulin Resistance in South Asians.” Journal of the Endocrine Society vol. 7,3 bvac189. 10 Dec. 2022, doi:10.1210/jendso/bvac189
Harada, Paulo H N et al. “Lipoprotein insulin resistance score and risk of incident diabetes during extended follow-up of 20 years: The Women's Health Study.” Journal of clinical lipidology vol. 11,5 (2017): 1257-1267.e2. doi:10.1016/j.jacl.2017.06.008
Mackey, Rachel H et al. “Lipoprotein particles and incident type 2 diabetes in the multi-ethnic study of atherosclerosis.” Diabetes care vol. 38,4 (2015): 628-36. doi:10.2337/dc14-0645
Shalaurova, Irina et al. “Lipoprotein insulin resistance index: a lipoprotein particle-derived measure of insulin resistance.” Metabolic syndrome and related disorders vol. 12,8 (2014): 422-9. doi:10.1089/met.2014.0050
Sharma, Vandhna Rani et al. “Lipoprotein Insulin Resistance Score: Validation and Utility in African Ancestry Populations.” Journal of the Endocrine Society vol. 5,Suppl 1 A291–A292. 3 May. 2021, doi:10.1210/jendso/bvab048.593
Turecamo, Sarah et al. “Lipoprotein Insulin Resistance Score and Mortality Risk Stratification in Heart Failure.” The American journal of medicine vol. 137,7 (2024): 640-648. doi:10.1016/j.amjmed.2024.03.033
Vittal, Anusha et al. “Lipoprotein Insulin Resistance Index Reflects Liver Fat Content in Patients With Nonalcoholic Fatty Liver Disease.” Hepatology communications vol. 5,4 589-597. 29 Dec. 2020, doi:10.1002/hep4.1658
The biomarkers of bone metabolism reflect the dynamic nature of bone as well as its strengths and vulnerabilities. Measuring biomarkers that reflect bone turnover, collagen metabolism, and bone-rebuilding activity enhances clinical assessment and helps guide therapeutic interventions. Monitoring biomarkers over time is preferred in order to best assess bone metabolism and integrity.
Collagen Cross-Linked NTx (urine)
N-telopeptide (NTx) is a protein fragment found in type 1 collagen, the type of collagen that makes up 90% of bone matrix. Bone breakdown will cause a release of NTx which is then excreted in the urine. Urinary levels are found to correlate well with serum levels and can be used for monitoring bone health and integrity.
OPTIMAL DX MEMBERS CLICK HERE for more information on Collagen Cross-Linked NTx
References
Baxter, I et al. “Evaluation of urinary N-telopeptide of type I collagen measurements in the management of osteoporosis in clinical practice.” Osteoporosis international : a journal established as result of cooperation between the European Foundation for Osteoporosis and the National Osteoporosis Foundation of the USA vol. 24,3 (2013): 941-7. doi:10.1007/s00198-012-2097-4
Gossiel, Fatma et al. “Establishing reference intervals for bone turnover markers in healthy postmenopausal women in a nonfasting state.” BoneKEy reports vol. 3 573. 3 Sep. 2014, doi:10.1038/bonekey.2014.68
Pagana, Kathleen Deska; Pagana, Timothy J.; Pagana, Theresa N. Mosby's Diagnostic and Laboratory Test Reference. Elsevier Health Sciences. 2019.
Shetty, Sahana et al. “Bone turnover markers: Emerging tool in the management of osteoporosis.” Indian journal of endocrinology and metabolism vol. 20,6 (2016): 846-852. doi:10.4103/2230-8210.192914
Sowers, MaryFran R et al. “Changes in bone resorption across the menopause transition: effects of reproductive hormones, body size, and ethnicity.” The Journal of clinical endocrinology and metabolism vol. 98,7 (2013): 2854-63. doi:10.1210/jc.2012-4113
Osteocalcin
Osteocalcin is a protein that is highly present in bones. It plays a crucial role in both the formation and maintenance of bone structure, as well as controlling the actions of bone-building cells (osteoblasts) and bone-resorbing cells (osteoclasts). Additionally, osteocalcin impacts the creation of neurotransmitters and testosterone and also influences insulin production and its functioning. High osteocalcin levels indicate bone growth or turnover, whereas low levels could be linked to issues related to heart and metabolic health.
OPTIMAL DX MEMBERS CLICK HERE for more information on Osteocalcin
References
Garcia-Martín, Antonia et al. “Osteocalcin as a marker of metabolic risk in healthy postmenopausal women.” Menopause (New York, N.Y.) vol. 18,5 (2011): 537-41. doi:10.1097/gme.0b013e3181f8565e
Gossiel, Fatma et al. “Establishing reference intervals for bone turnover markers in healthy postmenopausal women in a nonfasting state.” BoneKEy reports vol. 3 573. 3 Sep. 2014, doi:10.1038/bonekey.2014.68
Kanbur, Nuray O et al. “Osteocalcin. A biochemical marker of bone turnover during puberty.” International journal of adolescent medicine and health vol. 14,3 (2002): 235-44. doi:10.1515/ijamh.2002.14.3.235
Neve, Anna et al. “Osteocalcin: skeletal and extra-skeletal effects.” Journal of cellular physiology vol. 228,6 (2013): 1149-53. doi:10.1002/jcp.24278
Pagana, Kathleen Deska; Pagana, Timothy J.; Pagana, Theresa N. Mosby's Diagnostic and Laboratory Test Reference. Elsevier Health Sciences. 2019.
Pittas, Anastassios G et al. “Association between serum osteocalcin and markers of metabolic phenotype.” The Journal of clinical endocrinology and metabolism vol. 94,3 (2009): 827-32. doi:10.1210/jc.2008-1422
The Hematology aspect of the Complete Blood Count primarily focuses on red blood cells and platelets. An in-depth functional assessment of these components in the blood offers crucial insights into potential dysfunction and the possibility of upcoming diseases. This evaluation is particularly important for those identified with risk factors for chronic illnesses. By measuring red blood cell biomarkers, it becomes feasible to identify and monitor various anemias, myeloproliferative disorders, overall oxygen-carrying capacity, blood loss, nutrient deficiencies, and hydration levels. On the other hand, monitoring platelets is instrumental in evaluating blood clotting abilities and understanding both vascular integrity and function within the body.
Red Blood Cell (RBC) Count
Red blood cells (RBCs) play a crucial role in transporting oxygen to cells and tissues and removing carbon dioxide. Depletion or destruction of RBCs can lead to anemia, which impairs tissue oxygenation and raises the risk of cardiovascular disease and mortality.
OPTIMAL DX MEMBERS CLICK HERE for more information on Red Blood Cell Count (RBC)
References
Anderson, Jeffrey L et al. “Usefulness of a complete blood count-derived risk score to predict incident mortality in patients with suspected cardiovascular disease.” The American journal of cardiology vol. 99,2 (2007): 169-74. doi:10.1016/j.amjcard.2006.08.015
da Silva Lopes, Katharina et al. “Nutrition-specific interventions for preventing and controlling anaemia throughout the life cycle: an Overview of systematic reviews.” The Cochrane database of systematic reviews vol. 9,9 CD013092. 26 Sep. 2021, doi:10.1002/14651858.CD013092.pub2
Hatamian, Hamidreza et al. “The relationship between stroke mortality and red blood cell parameters.” Iranian journal of neurology vol. 13,4 (2014): 237-40.
Kim, Yong Chul et al. “The low number of red blood cells is an important risk factor for all-cause mortality in the general population.” The Tohoku journal of experimental medicine vol. 227,2 (2012): 149-59. doi:10.1620/tjem.227.149
Pagana, Kathleen Deska; Pagana, Timothy J.; Pagana, Theresa N. Mosby's Diagnostic and Laboratory Test Reference. Elsevier Health Sciences. 2019.
Pretini, Virginia et al. “Red Blood Cells: Chasing Interactions.” Frontiers in physiology vol. 10 945. 31 Jul. 2019, doi:10.3389/fphys.2019.00945
Vasanthi, B., and T. Goldlin. "Efficacy of Vitamin C and Vitamin E as an add on therapy in diabetic foot ulcer and red blood cell morphology as a biomarker of oxidative stress: a randomized, open label, comparative pilot study." Int J Basic Clin Pharmacol 7.3 (2018): 548-555.
Reticulocyte Count
Reticulocytes are immature red blood cells that reflect bone marrow function. Low reticulocyte levels can be associated with bone marrow failure, chronic infection, certain anemias, and other conditions, while high reticulocyte levels can be linked to blood loss, pregnancy, leukemia, and hemolytic anemias. Reticulocyte concentration can help indicate increased production in response to anemia or the need for red blood cell replacement. Most healthy individuals maintain a reticulocyte level between 0.5-2.5%.
OPTIMAL DX MEMBERS CLICK HERE for more information on Reticulocytes
References
Gaur, Malvika, and Tushar Sehgal. “Reticulocyte count: a simple test but tricky interpretation!.” The Pan African medical journal vol. 40 3. 2 Sep. 2021, doi:10.11604/pamj.2021.40.3.31316
Pagana, Kathleen Deska; Pagana, Timothy J.; Pagana, Theresa N. Mosby's Diagnostic and Laboratory Test Reference. Elsevier Health Sciences. 2019.
Rai, Dipti, et al. “Histology, Reticulocytes.” StatPearls, StatPearls Publishing, 17 February 2022.
Riley, R S et al. “Reticulocytes and reticulocyte enumeration.” Journal of clinical laboratory analysis vol. 15,5 (2001): 267-94. doi:10.1002/jcla.1039
Turner, Jake, et al. “Anemia.” StatPearls, StatPearls Publishing, 9 January 2022.
Hemoglobin
Hemoglobin is a protein found in red blood cells responsible for carrying oxygen throughout the body. Normal hemoglobin levels differ between men and women, and low levels can indicate anemia, blood loss, or nutrient deficiencies. High hemoglobin levels can be associated with dehydration, chronic disease, or testosterone therapy. Both low and high hemoglobin levels are linked to increased mortality and other health risks, such as end-stage renal disease or systemic thrombosis. It is important to monitor hemoglobin levels to maintain optimal health and identify potential underlying health issues.
OPTIMAL DX MEMBERS CLICK HERE for more information on Hemoglobin
References
Elsamadicy, Aladine A et al. “Preoperative Hemoglobin Level is Associated with Increased Health Care Use After Elective Spinal Fusion (≥3 Levels) in Elderly Male Patients with Spine Deformity.” World neurosurgery vol. 112 (2018): e348-e354. doi:10.1016/j.wneu.2018.01.046
Fulks, Michael et al. “Hemoglobin Screening Independently Predicts All-Cause Mortality.” Journal of insurance medicine (New York, N.Y.) vol. 45,2 (2015): 75-80. doi:10.17849/insm-45-02-075-080.1
Kabat, Geoffrey C et al. “Association of Hemoglobin Concentration With Total and Cause-Specific Mortality in a Cohort of Postmenopausal Women.” American journal of epidemiology vol. 183,10 (2016): 911-9. doi:10.1093/aje/kwv332
Kuno, Toshiki et al. “U shape association of hemoglobin level with in-hospital mortality for COVID-19 patients.” Journal of thrombosis and thrombolysis, 1–5. 2 Jul. 2021, doi:10.1007/s11239-021-02516-1
Northrop-Clewes, Christine A, and David I Thurnham. “Biomarkers for the differentiation of anemia and their clinical usefulness.” Journal of blood medicine vol. 4 11-22. 20 Mar. 2013, doi:10.2147/JBM.S29212
Pagana, Kathleen Deska, et al. Mosby’s Diagnostic and Laboratory Test Reference. 16th ed., Mosby, 2022.
Patel, Kushang V. 2008. “Epidemiology of Anemia in Older Adults.” Seminars in Hematology 45 (4): 210–17.
Rhodes, Carl E., et al. “Physiology, Oxygen Transport.” StatPearls, StatPearls Publishing, 19 November 2021.
Sreenivasan, Jayakumar et al. “Anemia (Hemoglobin ≤ 13 g/dL) as a Risk Factor for Contrast-Induced Acute Kidney Injury Following Coronary Angiography.” The American journal of cardiology vol. 122,6 (2018): 961-965. doi:10.1016/j.amjcard.2018.06.012
Yi, Sang-Wook et al. “Low-normal hemoglobin levels and anemia are associated with increased risk of end-stage renal disease in general populations: A prospective cohort study.” PloS one vol. 14,4 e0215920. 25 Apr. 2019, doi:10.1371/journal.pone.0215920
WHO. Haemoglobin concentrations for the diagnosis of anaemia and assessment of severity. Vitamin and Mineral Nutrition Information System. Geneva, World
Health Organization, 2011 (WHO/NMH/NHD/MNM/11.1)
Hematocrit
Hematocrit measures the percentage of blood made up of red blood cells, which influences various aspects of health. Low hematocrit levels can be associated with anemia, blood loss, nutrient deficiencies, and other conditions, while high levels can be linked to dehydration, COPD, and polycythemia vera. Both low and high hematocrit levels can impact overall mortality rates. Hematocrit values are affected by factors like hydration and red blood cell size and morphology, so it is important to monitor and maintain appropriate levels for optimal health.
OPTIMAL DX MEMBERS CLICK HERE for more information on Hematocrit
References
Boffetta, Paolo et al. “A U-shaped relationship between haematocrit and mortality in a large prospective cohort study.” International journal of epidemiology vol. 42,2 (2013): 601-15. doi:10.1093/ije/dyt013
Nikolsky, Eugenia et al. “Low hematocrit predicts contrast-induced nephropathy after percutaneous coronary interventions.” Kidney international vol. 67,2 (2005): 706-13. doi:10.1111/j.1523-1755.2005.67131.x
Pagana, Kathleen Deska, et al. Mosby's Diagnostic and Laboratory Test Reference. 15th ed., Mosby, 2021.
Paul, Laura et al. “Hematocrit predicts long-term mortality in a nonlinear and sex-specific manner in hypertensive adults.” Hypertension (Dallas, Tex. : 1979) vol. 60,3 (2012): 631-8. doi:10.1161/HYPERTENSIONAHA.112.191510
Mean Corpuscular Volume (MCV)
The mean corpuscular volume (MCV) indicates the average size of red blood cells and is used to classify anemias. Low MCV is associated with conditions like iron-deficiency anemia, sideroblastic anemia, and thalassemia, while high MCV is linked to megaloblastic anemia due to folate or B12 deficiency. MCV can be normal (normocytic) in cases of anemia of chronic disease, chronic kidney disease, or mixed nutrient deficiencies. Elevated MCV is associated with various dysfunctions, including cognitive decline and peripheral artery disease.
References
Anderson, Jeffrey L et al. “Usefulness of a complete blood count-derived risk score to predict incident mortality in patients with suspected cardiovascular disease.” The American journal of cardiology vol. 99,2 (2007): 169-74. doi:10.1016/j.amjcard.2006.08.015
Barton, J C et al. “Screening for hemochromatosis in routine medical care: an evaluation of mean corpuscular volume and mean corpuscular hemoglobin.” Genetic testing vol. 4,2 (2000): 103-10. doi:10.1089/10906570050114786
Cappellini, M Domenica, and Irene Motta. “Anemia in Clinical Practice-Definition and Classification: Does Hemoglobin Change With Aging?.” Seminars in hematology vol. 52,4 (2015): 261-9. doi:10.1053/j.seminhematol.2015.07.006
Gamaldo, Alyssa A et al. “Relationship between mean corpuscular volume and cognitive performance in older adults.” Journal of the American Geriatrics Society vol. 61,1 (2013): 84-9. doi:10.1111/jgs.12066
Maner, Brittany S. and Leila Moosavi. “Mean Corpuscular Volume.” StatPearls, StatPearls Publishing, 10 July 2021.
Mueller, T et al. “Association between erythrocyte mean corpuscular volume and peripheral arterial disease in male subjects: a case control study.” Angiology vol. 52,9 (2001): 605-13. doi:10.1177/000331970105200904
Nagao, Takayo, and Makoto Hirokawa. “Diagnosis and treatment of macrocytic anemias in adults.” Journal of general and family medicine vol. 18,5 200-204. 13 Apr. 2017, doi:10.1002/jgf2.31
Pagana, Kathleen Deska; Pagana, Timothy J.; Pagana, Theresa N. Mosby's Diagnostic and Laboratory Test Reference. Elsevier Health Sciences. 2019.
Wolffenbuttel, B H R et al. “Association of vitamin B12, methylmalonic acid, and functional parameters.” The Netherlands journal of medicine vol. 78,1 (2020): 10-24.
Mean Corpuscular Hemoglobin (MCH)
Mean corpuscular hemoglobin (MCH) represents the average amount of hemoglobin found in a red blood cell. It helps in categorizing anemias and RBC-related disorders. Low MCH is associated with microcytic anemia, hypochromic anemia, and thalassemia, while high MCH is linked to macrocytic anemia and hemochromatosis. Evaluating MCH alongside MCV and RDW can help determine the presence of conditions such as thalassemia or hemochromatosis.
References
Barton, J C et al. “Screening for hemochromatosis in routine medical care: an evaluation of mean corpuscular volume and mean corpuscular hemoglobin.” Genetic testing vol. 4,2 (2000): 103-10. doi:10.1089/10906570050114786
Pagana, Kathleen Deska; Pagana, Timothy J.; Pagana, Theresa N. Mosby's Diagnostic and Laboratory Test Reference. Elsevier Health Sciences. 2019.
Pranpanus, Savitree et al. “Sensitivity and specificity of mean corpuscular hemoglobin (MCH): for screening alpha-thalassemia-1 trait and beta-thalassemia trait.” Journal of the Medical Association of Thailand = Chotmaihet thangphaet vol. 92,6 (2009): 739-43.
Song, Qi-Ling et al. Zhongguo shi yan xue ye xue za zhi vol. 29,3 (2021): 847-852. doi:10.19746/j.cnki.issn.1009-2137.2021.03.030
Mean Corpuscular Hemoglobin Concentration (MCHC)
Mean corpuscular hemoglobin concentration (MCHC) measures the average concentration of hemoglobin in red blood cells. Low MCHC levels often indicate conditions like iron-deficiency anemia or thalassemia and can be linked to inflammation, increased heart disease risk, and depressive symptoms. High MCHC levels are generally due to factors like red blood cell damage (hemolysis), abnormal cell shapes (spherocytosis), or dehydration, but can sometimes be misleadingly high due to certain conditions or medications. Essentially, MCHC provides insights into the hemoglobin content in blood cells, influencing the diagnosis and management of various health conditions.
References
Anderson, Jeffrey L et al. “Usefulness of a complete blood count-derived risk score to predict incident mortality in patients with suspected cardiovascular disease.” The American journal of cardiology vol. 99,2 (2007): 169-74. doi:10.1016/j.amjcard.2006.08.015
Berda-Haddad, Y et al. “Increased mean corpuscular haemoglobin concentration: artefact or pathological condition?.” International journal of laboratory hematology vol. 39,1 (2017): 32-41. doi:10.1111/ijlh.12565
El Brihi, Jason. and Surabhi Pathak. “Normal and Abnormal Complete Blood Count With Differential.” StatPearls, StatPearls Publishing, 8 June 2024.
Huang, Yuan-Lan, and Zhi-De Hu. “Lower mean corpuscular hemoglobin concentration is associated with poorer outcomes in intensive care unit admitted patients with acute myocardial infarction.” Annals of translational medicine vol. 4,10 (2016): 190. doi:10.21037/atm.2016.03.42
Khan, Zahra, et al. "Hemoglobin, red blood cell count, hematocrit and derived parameters for diagnosing anemia in elderly males." Proceedings of the Pakistan Academy of sciences 50.3 (2013): 217-226.
Lee, Ju-Mi et al. “Association between Mean Corpuscular Hemoglobin Concentration and Future Depressive Symptoms in Women.” The Tohoku journal of experimental medicine vol. 241,3 (2017): 209-217. doi:10.1620/tjem.241.209
Li, Dan et al. “The relationship between mean corpuscular hemoglobin concentration and mortality in hypertensive individuals: A population-based cohort study.” PloS one vol. 19,5 e0301903. 9 May. 2024, doi:10.1371/journal.pone.0301903
Pagana, Kathleen Deska, et al. Mosby's Diagnostic and Laboratory Test Reference. 15th ed., Mosby, 2021.
Pagana, Kathleen Deska, et al. Mosby's Diagnostic and Laboratory Test Reference. 17th ed., Mosby, 2025.
Red Cell Distribution Width (RDW)
The red cell distribution width (RDW) measures the variation in size of red blood cells in circulation, assisting in assessing anemia, cancer prognosis, and other health conditions. A high RDW is associated with hemolytic anemias, nutritional deficiencies, and chronic diseases such as cardiovascular disease, diabetes, and cancer. Elevated RDW has been linked to inflammation and poorer prognosis in various health conditions.
References
Ai, L., Mu, S., & Hu, Y. (2018). Prognostic role of RDW in hematological malignancies: a systematic review and meta-analysis. Cancer cell international, 18, 61. https://doi.org/10.1186/s12935-018-0558-3
Anderson, Jeffrey L et al. “Usefulness of a complete blood count-derived risk score to predict incident mortality in patients with suspected cardiovascular disease.” The American journal of cardiology vol. 99,2 (2007): 169-74. doi:10.1016/j.amjcard.2006.08.015
Fava, Cristiano et al. “The role of red blood cell distribution width (RDW) in cardiovascular risk assessment: useful or hype?.” Annals of translational medicine vol. 7,20 (2019): 581. doi:10.21037/atm.2019.09.58
Gang, Li, and Wan Lifang. “Association of the Elevated Red Blood Cell Distribution Width with the Risk of Developing Diabetes Mellitus.” Internal medicine (Tokyo, Japan) vol. 55,15 (2016): 1959-65. doi:10.2169/internalmedicine.55.5956
Goyal, Hemant et al. “Prognostic significance of red blood cell distribution width in gastrointestinal disorders.” World journal of gastroenterology vol. 23,27 (2017): 4879-4891. doi:10.3748/wjg.v23.i27.4879
Gürel, Ozgul Malcok et al. “Association between Red Blood Cell Distribution Width and Coronary Artery Calcification in Patients Undergoing 64-Multidetector Computed Tomography.” Korean circulation journal vol. 45,5 (2015): 372-7. doi:10.4070/kcj.2015.45.5.372
Li, Ning et al. “Red Blood Cell Distribution Width: A Novel Predictive Indicator for Cardiovascular and Cerebrovascular Diseases.” Disease markers vol. 2017 (2017): 7089493. doi:10.1155/2017/7089493
Lippi, Giuseppe et al. “Relation between red blood cell distribution width and inflammatory biomarkers in a large cohort of unselected outpatients.” Archives of pathology & laboratory medicine vol. 133,4 (2009): 628-32. doi:10.5858/133.4.628
May, Jori E et al. “Three neglected numbers in the CBC: The RDW, MPV, and NRBC count.” Cleveland Clinic journal of medicine vol. 86,3 (2019): 167-172. doi:10.3949/ccjm.86a.18072
Patel, Kushang V et al. “Red blood cell distribution width and the risk of death in middle-aged and older adults.” Archives of internal medicine vol. 169,5 (2009): 515-23. doi:10.1001/archinternmed.2009.11
Skjelbakken, Tove et al. “Red cell distribution width is associated with incident myocardial infarction in a general population: the Tromsø Study.” Journal of the American Heart Association vol. 3,4 e001109. 18 Aug. 2014, doi:10.1161/JAHA.114.001109
Xanthopoulos, Andrew et al. “Red blood cell distribution width as a prognostic marker in patients with heart failure and diabetes mellitus.” Cardiovascular diabetology vol. 16,1 81. 6 Jul. 2017, doi:10.1186/s12933-017-0563-1
Platelets
Platelets are small cells crucial for blood clotting and maintaining blood volume during vascular injury. A healthy balance of mature platelets is essential for homeostasis. Low platelet count may be linked to bone marrow failure, certain anemias, lupus, leukemia, and increased mortality, while excessively high platelets can be associated with thrombosis, malignancy, rheumatoid arthritis, inflammation, iron-deficiency anemia, and increased mortality as well.
OPTIMAL DX MEMBERS CLICK HERE for more information on Platelets
References
Anderson, Jeffrey L et al. “Usefulness of a complete blood count-derived risk score to predict incident mortality in patients with suspected cardiovascular disease.” The American journal of cardiology vol. 99,2 (2007): 169-74. doi:10.1016/j.amjcard.2006.08.015
Badimon, Lina et al. “Atherosclerosis, platelets and thrombosis in acute ischaemic heart disease.” European heart journal. Acute cardiovascular care vol. 1,1 (2012): 60-74. doi:10.1177/2048872612441582
Cox, D et al. “Platelets and the innate immune system: mechanisms of bacterial-induced platelet activation.” Journal of thrombosis and haemostasis : JTH vol. 9,6 (2011): 1097-107. doi:10.1111/j.1538-7836.2011.04264.x
Fountain, J. H., & Lappin, S. L. (2021). Physiology, Platelet. In StatPearls. StatPearls Publishing.
Horne, Benjamin D et al. “Exceptional mortality prediction by risk scores from common laboratory tests.” The American journal of medicine vol. 122,6 (2009): 550-8. doi:10.1016/j.amjmed.2008.10.043
Kristjansdottir, H L et al. “High platelet count is associated with low bone mineral density: The MrOS Sweden cohort.” Osteoporosis international : a journal established as result of cooperation between the European Foundation for Osteoporosis and the National Osteoporosis Foundation of the USA vol. 32,5 (2021): 865-871. doi:10.1007/s00198-020-05766-6
Pagana, Kathleen Deska, et al. Mosby's Diagnostic and Laboratory Test Reference. 15th ed., Mosby, 2021.
Podda, Gian Marco et al. “Measurement of platelet count with different anticoagulants in thrombocytopenic patients and healthy subjects: accuracy and stability over time.” Haematologica vol. 104,12 (2019): e570-e572. doi:10.3324/haematol.2019.222265
Takajo, Y et al. “Augmented oxidative stress of platelets in chronic smokers. Mechanisms of impaired platelet-derived nitric oxide bioactivity and augmented platelet aggregability.” Journal of the American College of Cardiology vol. 38,5 (2001): 1320-7. doi:10.1016/s0735-1097(01)01583-2
Yoneda, Masato et al. “Platelet count for predicting fibrosis in nonalcoholic fatty liver disease.” Journal of gastroenterology vol. 46,11 (2011): 1300-6. doi:10.1007/s00535-011-0436-4
Mean Platelet Volume (MPV)
OPTIMAL DX MEMBERS CLICK HERE for more information on Mean Platelet Volume
References
Akboga, Mehmet Kadri et al. “Association of serum total bilirubin level with severity of coronary atherosclerosis is linked to systemic inflammation.” Atherosclerosis vol. 240,1 (2015): 110-4. doi:10.1016/j.atherosclerosis.2015.02.051
Elsayed, Amira M., and Ghada A. Mohamed. "Mean platelet volume and mean platelet volume/platelet count ratio as a risk stratification tool in the assessment of severity of acute ischemic stroke." Alexandria journal of medicine 53.1 (2017): 67-70.
Gasparyan, Armen Yuri et al. “Mean platelet volume: a link between thrombosis and inflammation?.” Current pharmaceutical design vol. 17,1 (2011): 47-58. doi:10.2174/138161211795049804
Han, Jin Soo et al. “Increased mean platelet volume and mean platelet volume/platelet count ratio in Korean patients with deep vein thrombosis.” Platelets vol. 24,8 (2013): 590-3. doi:10.3109/09537104.2012.748187
Khode, Vitthal et al. “Mean platelet volume and other platelet volume indices in patients with stable coronary artery disease and acute myocardial infarction: A case control study.” Journal of cardiovascular disease research vol. 3,4 (2012): 272-5. doi:10.4103/0975-3583.102694
Li, Na et al. “Elevated mean platelet volume predicts poor prognosis in colorectal cancer.” Scientific reports vol. 7,1 10261. 31 Aug. 2017, doi:10.1038/s41598-017-11053-y
Pagana, Kathleen Deska; Pagana, Timothy J.; Pagana, Theresa N. Mosby's Diagnostic and Laboratory Test Reference. Elsevier Health Sciences. 2019.
Sansanayudh, Nakarin et al. “Mean platelet volume and coronary artery disease: a systematic review and meta-analysis.” International journal of cardiology vol. 175,3 (2014): 433-40. doi:10.1016/j.ijcard.2014.06.028
Start creating true practice success. An Optimal DX account will help you deliver insights into your patient’s health and generate intuitive, comprehensive Functional Health Reports and customer blood test-specific treatment plans.
The White Blood Cell (WBC) Differential portion of the Complete Blood Count (CBC) places a significant emphasis on white blood cells (WBCs) and their various subtypes. White blood cells, also known as leukocytes, are essential components of the immune system that protect the body against infections, pathogens, and foreign substances. Produced in the bone marrow, these cells are prevalent in the bloodstream, lymphatic system, and various tissues. WBCs are involved in many functions, including phagocytosis, adaptive immunity, antigen presentation, defense against parasites, and allergic responses. There are five main types of white blood cells: neutrophils, lymphocytes, monocytes, eosinophils, and basophils, each with distinct roles and significance in human health. A comprehensive functional assessment of these components provides information about an individual's immune response, potential dysfunctions, and the likelihood of certain diseases. This evaluation is especially vital for individuals with risk factors for chronic conditions. By examining the distinct white blood cell types, you can gain valuable insights into infection presence, immune system efficiency, and inflammation levels, offering a clearer understanding of a patient's immune health and potential threats they may encounter.
White Blood Cell (WBC) Count, Total
White blood cells play a crucial role in defending against infections and responding to injuries. A sudden increase in their count often signifies an active infection, while a dramatic decrease may indicate bone marrow failure. However, if the inflammatory response involving WBCs becomes uncontrolled or prolonged, it can be harmful and is linked to an increased risk of cardiovascular disease and type 2 diabetes, both fundamentally inflammatory conditions. A higher WBC count is also associated with stress, metabolic acidosis, a pro-inflammatory diet, and exposure to pollution. A low WBC count indicates weakened immunity, potentially leading to systemic infection and increased susceptibility to disease.
OPTIMAL DX MEMBERS CLICK HERE for more information on Total White Blood Cell Count
References
Anderson, Jeffrey L et al. “Usefulness of a complete blood count-derived risk score to predict incident mortality in patients with suspected cardiovascular disease.” The American journal of cardiology vol. 99,2 (2007): 169-74. doi:10.1016/j.amjcard.2006.08.015
Danesh, J et al. “Association of fibrinogen, C-reactive protein, albumin, or leukocyte count with coronary heart disease: meta-analyses of prospective studies.” JAMA vol. 279,18 (1998): 1477-82. doi:10.1001/jama.279.18.1477
Farwell, Wildon R, and Eric N Taylor. “Serum anion gap, bicarbonate and biomarkers of inflammation in healthy individuals in a national survey.” CMAJ : Canadian Medical Association journal = journal de l'Association medicale canadienne vol. 182,2 (2010): 137-41. doi:10.1503/cmaj.090329
Gkrania-Klotsas, Effrossyni et al. “Differential white blood cell count and type 2 diabetes: systematic review and meta-analysis of cross-sectional and prospective studies.” PloS one vol. 5,10 e13405. 18 Oct. 2010, doi:10.1371/journal.pone.0013405
Horne, Benjamin D et al. “Which white blood cell subtypes predict increased cardiovascular risk?.” Journal of the American College of Cardiology vol. 45,10 (2005): 1638-43. doi:10.1016/j.jacc.2005.02.054
Huang, Zei-Shung et al. “Revision in reference ranges of peripheral total leukocyte count and differential leukocyte percentages based on a normal serum C-reactive protein level.” Journal of the Formosan Medical Association = Taiwan yi zhi vol. 106,8 (2007): 608-16. doi:10.1016/S0929-6646(08)60017-0
Kim, Dong-Jun et al. “The associations of total and differential white blood cell counts with obesity, hypertension, dyslipidemia and glucose intolerance in a Korean population.” Journal of Korean medical science vol. 23,2 (2008): 193-8. doi:10.3346/jkms.2008.23.2.193
Lee, Jihye, and Hee-Young Yoon. “The Association Between Air Pollution Exposure and White Blood Cell Counts: A Nationwide Cross-Sectional Survey in South Korea.” Journal of clinical medicine vol. 13,23 7402. 5 Dec. 2024, doi:10.3390/jcm13237402
Leng, Sean X et al. “Baseline total and specific differential white blood cell counts and 5-year all-cause mortality in community-dwelling older women.” Experimental gerontology vol. 40,12 (2005): 982-7. doi:10.1016/j.exger.2005.08.006
Pagana, Kathleen Deska, et al. Mosby's Diagnostic and Laboratory Test Reference. 15th ed., Mosby, 2021.
Ruggiero, Carmelinda et al. “White blood cell count and mortality in the Baltimore Longitudinal Study of Aging.” Journal of the American College of Cardiology vol. 49,18 (2007): 1841-50. doi:10.1016/j.jacc.2007.01.076
Sooriyaarachchi, Piumika et al. “Shift Work is Associated with an Elevated White Blood Cell Count: A Systematic Review and Meta-Analysis.” Indian journal of occupational and environmental medicine vol. 27,4 (2023): 278-285. doi:10.4103/ijoem.ijoem_326_22
Tigner, Alyssa, et al. “Histology, White Blood Cell.” StatPearls, StatPearls Publishing, 19 November 2021.
Touil, N et al. “Range-reference determination of lymphocyte subsets in Moroccan blood donors.” African health sciences vol. 12,3 (2012): 334-8. doi:10.4314/ahs.v12i3.14
Wirth, Michael D et al. “The Dietary Inflammatory Index is associated with elevated white blood cell counts in the National Health and Nutrition Examination Survey.” Brain, behavior, and immunity vol. 69 (2018): 296-303. doi:10.1016/j.bbi.2017.12.003
Lymphocytes
Lymphocytes, a type of white blood cell, are critical in defending against infections, regulating inflammation, and promoting adaptive immunity. These cells, comprising B cells, T cells, and natural killer cells, react to a range of antigens and can be influenced by factors like the human microbiota. Abnormally high or low lymphocyte levels can signal various health conditions - high levels may indicate chronic infections, leukemia, lymphoma, or metabolic disorders, while low levels might be associated with immune compromise, severe infections, malnutrition, and diseases like lupus and HIV. In particular, lymphocyte count has been associated with the severity of diseases such as COVID-19. Therefore, understanding lymphocyte count, either as a percentage of white blood cells or as an absolute number, is vital for evaluating a person's immune status and potential health risks.
Lymphocytes, Absolute
Lymphocytes, %
OPTIMAL DX MEMBERS CLICK HERE for more information on Lymphocytes
References
Afari, Maxwell E, and Tariq Bhat. “Neutrophil to lymphocyte ratio (NLR) and cardiovascular diseases: an update.” Expert review of cardiovascular therapy vol. 14,5 (2016): 573-7. doi:10.1586/14779072.2016.1154788
Bowen, Randy C et al. “Neutrophil-to-lymphocyte ratio as prognostic indicator in gastrointestinal cancers: a systematic review and meta-analysis.” Oncotarget vol. 8,19 (2017): 32171-32189. doi:10.18632/oncotarget.16291
Davis JL, Moutinho V Jr, Panageas KS, Coit DG. A peripheral blood biomarker estimates probability of survival: the neutrophil-lymphocyte ratio in noncancer patients. Biomark Med. 2016 Sep;10(9):953-7.
Faria, Sara Socorro et al. “The neutrophil-to-lymphocyte ratio: a narrative review.” Ecancermedicalscience vol. 10 702. 12 Dec. 2016, doi:10.3332/ecancer.2016.702
Farkas, Joshua David. “The complete blood count to diagnose septic shock.” Journal of thoracic disease vol. 12,Suppl 1 (2020): S16-S21. doi:10.21037/jtd.2019.12.63
Fest, Jesse et al. “Reference values for white blood-cell-based inflammatory markers in the Rotterdam Study: a population-based prospective cohort study.” Scientific reports vol. 8,1 10566. 12 Jul. 2018, doi:10.1038/s41598-018-28646-w
Forget P, Khalifa C, Defour JP, et al. What is the normal value of the neutrophil-to-lymphocyte ratio? BMC Res Notes. 2017 Jan 3;10(1):12.
Giynas Ayhan, Medine, et al. "Neutrophil/lymphocyte and platelet/lymphocyte ratios in all mood states of bipolar disorder." Psychiatry and Clinical Psychopharmacology 27.3 (2017): 278-282.
Guasti, Luigina et al. “Neutrophils and clinical outcomes in patients with acute coronary syndromes and/or cardiac revascularisation. A systematic review on more than 34,000 subjects.” Thrombosis and haemostasis vol. 106,4 (2011): 591-9. doi:10.1160/TH11-02-0096
Gürağaç, Ali, and Zafer Demirer. “The neutrophil-to-lymphocyte ratio in clinical practice.” Canadian Urological Association journal = Journal de l'Association des urologues du Canada vol. 10,3-4 (2016): 141. doi:10.5489/cuaj.3587
Gürel, Ozgul Malcok, et al. "Association between red blood cell distribution width and coronary artery calcification in patients undergoing 64-multidetector computed tomography." Korean circulation journal 45.5 (2015): 372-377.
Guthrie, Graeme J K et al. “The systemic inflammation-based neutrophil-lymphocyte ratio: experience in patients with cancer.” Critical reviews in oncology/hematology vol. 88,1 (2013): 218-30. doi:10.1016/j.critrevonc.2013.03.010
Halazun, Hadi J et al. “Neutrophil-lymphocyte ratio as a predictor of cognitive dysfunction in carotid endarterectomy patients.” Journal of vascular surgery vol. 59,3 (2014): 768-73. doi:10.1016/j.jvs.2013.08.095
Horne, Benjamin D et al. “Which white blood cell subtypes predict increased cardiovascular risk?.” Journal of the American College of Cardiology vol. 45,10 (2005): 1638-43. doi:10.1016/j.jacc.2005.02.054
Imtiaz, Fauzia et al. “Neutrophil lymphocyte ratio as a measure of systemic inflammation in prevalent chronic diseases in Asian population.” International archives of medicine vol. 5,1 2. 26 Jan. 2012, doi:10.1186/1755-7682-5-2
Kim, Stephanie et al. “Association of Neutrophil-to-Lymphocyte Ratio With Mortality and Cardiovascular Disease in the Jackson Heart Study and Modification by the Duffy Antigen Variant.” JAMA cardiology vol. 3,6 (2018): 455-462. doi:10.1001/jamacardio.2018.1042
Koc, Ibrahim, and Sevda Unalli Ozmen. “Eosinophil Levels, Neutrophil-Lymphocyte Ratio, and Platelet-Lymphocyte Ratio in the Cytokine Storm Period of Patients with COVID-19.” International journal of clinical practice vol. 2022 7450739. 3 Aug. 2022, doi:10.1155/2022/7450739
Kuyumcu, Mehmet Emin et al. “The evaluation of neutrophil-lymphocyte ratio in Alzheimer's disease.” Dementia and geriatric cognitive disorders vol. 34,2 (2012): 69-74. doi:10.1159/000341583
Lee, Jeong Soo et al. “Reference values of neutrophil-lymphocyte ratio, lymphocyte-monocyte ratio, platelet-lymphocyte ratio, and mean platelet volume in healthy adults in South Korea.” Medicine vol. 97,26 (2018): e11138. doi:10.1097/MD.0000000000011138
Martínez-Urbistondo, Diego et al. “The neutrophil-to-lymphocyte ratio as a marker of systemic endothelial dysfunction in asymptomatic subjects.” Nefrologia : publicacion oficial de la Sociedad Espanola Nefrologia vol. 36,4 (2016): 397-403. doi:10.1016/j.nefro.2015.10.018
Mazza, Mario Gennaro et al. “Neutrophil/lymphocyte ratio and platelet/lymphocyte ratio in mood disorders: A meta-analysis.” Progress in neuro-psychopharmacology & biological psychiatry vol. 84,Pt A (2018): 229-236. doi:10.1016/j.pnpbp.2018.03.012
McBurney, Michael I et al. “The omega-3 index is inversely associated with the neutrophil-lymphocyte ratio in adults'.” Prostaglandins, leukotrienes, and essential fatty acids vol. 177 (2022): 102397. doi:10.1016/j.plefa.2022.102397
McNamara, M G et al. “Neutrophil/lymphocyte ratio as a prognostic factor in biliary tract cancer.” European journal of cancer (Oxford, England : 1990) vol. 50,9 (2014): 1581-9. doi:10.1016/j.ejca.2014.02.015
Naess, Are et al. “Role of neutrophil to lymphocyte and monocyte to lymphocyte ratios in the diagnosis of bacterial infection in patients with fever.” Infection vol. 45,3 (2017): 299-307. doi:10.1007/s15010-016-0972-1
Rembach, Alan et al. “An increased neutrophil-lymphocyte ratio in Alzheimer's disease is a function of age and is weakly correlated with neocortical amyloid accumulation.” Journal of neuroimmunology vol. 273,1-2 (2014): 65-71. doi:10.1016/j.jneuroim.2014.05.005
Sahin, Azad Gazi et al. “Predictive Value of Preoperative Neutrophil Lymphocyte Ratio in Determining the Stage of Gastric Tumor.” Medical science monitor : international medical journal of experimental and clinical research vol. 23 1973-1979. 24 Apr. 2017, doi:10.12659/msm.900681
Uysal, Hilal Bektas et al. “Blood count parameters can predict the severity of coronary artery disease.” The Korean journal of internal medicine vol. 31,6 (2016): 1093-1100. doi:10.3904/kjim.2015.199
Venkatraghavan, Lashmi et al. “Neutrophil Lymphocyte Ratio as a predictor of systemic inflammation - A cross-sectional study in a pre-admission setting.” F1000Research vol. 4 123. 22 May. 2015, doi:10.12688/f1000research.6474.1
Wang, Huan et al. “The relationship between neutrophil to lymphocyte ratio and artery stiffness in subtypes of hypertension.” Journal of clinical hypertension (Greenwich, Conn.) vol. 19,8 (2017): 780-785. doi:10.1111/jch.13002
Wang, Yuchen et al. “Evaluation of the prognostic value of neutrophil to lymphocyte ratio in patients with hypertriglyceridemia-induced acute pancreatitis.” Pancreatology : official journal of the International Association of Pancreatology (IAP) ... [et al.] vol. 17,6 (2017): 893-897. doi:10.1016/j.pan.2017.10.001
Zahorec, R. “Ratio of neutrophil to lymphocyte counts--rapid and simple parameter of systemic inflammation and stress in critically ill.” Bratislavske lekarske listy vol. 102,1 (2001): 5-14.
Neutrophils
Neutrophils, the most prevalent white blood cells, are fundamental in defending against pathogens by releasing potent compounds and performing phagocytosis. High levels may signal infection, cardiovascular disease, metabolic syndrome, or emotional distress, while low counts might indicate bone marrow failure, radiation exposure, viral infections, or immune suppression. Particularly, higher neutrophil levels are associated with conditions like acute bacterial or fungal infections, tissue necrosis, or myocardial infarction, whereas lower counts may result from conditions like malnutrition or certain diseases. Therefore, assessing neutrophil count as a proportion of white blood cells or an absolute number is essential for evaluating a person's immune response and potential health issues.
Neutrophils, Absolute
Neutrophils, %
OPTIMAL DX MEMBERS CLICK HERE for more information on Neutrophils
References
Babio, Nancy et al. “White blood cell counts as risk markers of developing metabolic syndrome and its components in the PREDIMED study.” PloS one vol. 8,3 (2013): e58354. doi:10.1371/journal.pone.0058354
Deyrup, Andrea T et al. “Essential laboratory tests for medical education.” Academic pathology vol. 9,1 100046. 13 Sep. 2022, doi:10.1016/j.acpath.2022.100046
Guasti, Luigina et al. “Neutrophils and clinical outcomes in patients with acute coronary syndromes and/or cardiac revascularisation. A systematic review on more than 34,000 subjects.” Thrombosis and haemostasis vol. 106,4 (2011): 591-9. doi:10.1160/TH11-02-0096
Horne, Benjamin D et al. “Which white blood cell subtypes predict increased cardiovascular risk?.” Journal of the American College of Cardiology vol. 45,10 (2005): 1638-43. doi:10.1016/j.jacc.2005.02.054
Justiz Vaillant, Angel A., et al. “Physiology, Immune Response.” StatPearls, StatPearls Publishing, 26 September 2022.
Kim, Dong-Jun et al. “The associations of total and differential white blood cell counts with obesity, hypertension, dyslipidemia and glucose intolerance in a Korean population.” Journal of Korean medical science vol. 23,2 (2008): 193-8. doi:10.3346/jkms.2008.23.2.193
Leng, Sean X et al. “Baseline total and specific differential white blood cell counts and 5-year all-cause mortality in community-dwelling older women.” Experimental gerontology vol. 40,12 (2005): 982-7. doi:10.1016/j.exger.2005.08.006
Pagana, Kathleen Deska, et al. Mosby's Diagnostic and Laboratory Test Reference. 15th ed., Mosby, 2021.
Pahwa, Roma, et al. “Chronic Inflammation.” StatPearls, StatPearls Publishing, 8 August 2022.
Neutrophil:Lymphocyte Ratio (NLR)
The Neutrophil Lymphocyte Ratio (NLR) reflects the body's cell-mediated inflammatory response and is an indicator of systemic inflammation, regardless of total white blood cell count. Increased NLR can occur due to physiological stress such as trauma, surgery, shock, or sepsis and is often predictive of more severe disease and worse outcomes. Elevated NLR is associated with a variety of conditions, including cardiovascular disease, diabetes, renal or hepatic dysfunction, bacterial infection, and malignancy. On the other hand, decreased NLR may suggest viral infections or adrenal insufficiency. In older individuals and men, the NLR tends to be higher, and increased NLR is also associated with the cytokine storm seen in severe COVID-19 cases. Further, an elevated NLR may indicate an increased risk of hypertension and diabetes and is linked with various cardiometabolic disorders. Some studies also suggest a relationship between elevated NLR and worse cancer outcomes, mood disorders, and cognitive decline. However, these associations require further research.
References
Afari, Maxwell E, and Tariq Bhat. “Neutrophil to lymphocyte ratio (NLR) and cardiovascular diseases: an update.” Expert review of cardiovascular therapy vol. 14,5 (2016): 573-7. doi:10.1586/14779072.2016.1154788
Bowen, Randy C et al. “Neutrophil-to-lymphocyte ratio as prognostic indicator in gastrointestinal cancers: a systematic review and meta-analysis.” Oncotarget vol. 8,19 (2017): 32171-32189. doi:10.18632/oncotarget.16291
Davis JL, Moutinho V Jr, Panageas KS, Coit DG. A peripheral blood biomarker estimates probability of survival: the neutrophil-lymphocyte ratio in noncancer patients. Biomark Med. 2016 Sep;10(9):953-7.
Faria, Sara Socorro et al. “The neutrophil-to-lymphocyte ratio: a narrative review.” Ecancermedicalscience vol. 10 702. 12 Dec. 2016, doi:10.3332/ecancer.2016.702
Farkas, Joshua David. “The complete blood count to diagnose septic shock.” Journal of thoracic disease vol. 12,Suppl 1 (2020): S16-S21. doi:10.21037/jtd.2019.12.63
Fest, Jesse et al. “Reference values for white blood-cell-based inflammatory markers in the Rotterdam Study: a population-based prospective cohort study.” Scientific reports vol. 8,1 10566. 12 Jul. 2018, doi:10.1038/s41598-018-28646-w
Forget P, Khalifa C, Defour JP, et al. What is the normal value of the neutrophil-to-lymphocyte ratio? BMC Res Notes. 2017 Jan 3;10(1):12.
Giynas Ayhan, Medine, et al. "Neutrophil/lymphocyte and platelet/lymphocyte ratios in all mood states of bipolar disorder." Psychiatry and Clinical Psychopharmacology 27.3 (2017): 278-282.
Guasti, Luigina et al. “Neutrophils and clinical outcomes in patients with acute coronary syndromes and/or cardiac revascularisation. A systematic review on more than 34,000 subjects.” Thrombosis and haemostasis vol. 106,4 (2011): 591-9. doi:10.1160/TH11-02-0096
Gürağaç, Ali, and Zafer Demirer. “The neutrophil-to-lymphocyte ratio in clinical practice.” Canadian Urological Association journal = Journal de l'Association des urologues du Canada vol. 10,3-4 (2016): 141. doi:10.5489/cuaj.3587
Gürel, Ozgul Malcok, et al. "Association between red blood cell distribution width and coronary artery calcification in patients undergoing 64-multidetector computed tomography." Korean circulation journal 45.5 (2015): 372-377.
Guthrie, Graeme J K et al. “The systemic inflammation-based neutrophil-lymphocyte ratio: experience in patients with cancer.” Critical reviews in oncology/hematology vol. 88,1 (2013): 218-30. doi:10.1016/j.critrevonc.2013.03.010
Halazun, Hadi J et al. “Neutrophil-lymphocyte ratio as a predictor of cognitive dysfunction in carotid endarterectomy patients.” Journal of vascular surgery vol. 59,3 (2014): 768-73. doi:10.1016/j.jvs.2013.08.095
Horne, Benjamin D et al. “Which white blood cell subtypes predict increased cardiovascular risk?.” Journal of the American College of Cardiology vol. 45,10 (2005): 1638-43. doi:10.1016/j.jacc.2005.02.054
Imtiaz, Fauzia et al. “Neutrophil lymphocyte ratio as a measure of systemic inflammation in prevalent chronic diseases in Asian population.” International archives of medicine vol. 5,1 2. 26 Jan. 2012, doi:10.1186/1755-7682-5-2
Kim, Stephanie et al. “Association of Neutrophil-to-Lymphocyte Ratio With Mortality and Cardiovascular Disease in the Jackson Heart Study and Modification by the Duffy Antigen Variant.” JAMA cardiology vol. 3,6 (2018): 455-462. doi:10.1001/jamacardio.2018.1042
Koc, Ibrahim, and Sevda Unalli Ozmen. “Eosinophil Levels, Neutrophil-Lymphocyte Ratio, and Platelet-Lymphocyte Ratio in the Cytokine Storm Period of Patients with COVID-19.” International journal of clinical practice vol. 2022 7450739. 3 Aug. 2022, doi:10.1155/2022/7450739
Kuyumcu, Mehmet Emin et al. “The evaluation of neutrophil-lymphocyte ratio in Alzheimer's disease.” Dementia and geriatric cognitive disorders vol. 34,2 (2012): 69-74. doi:10.1159/000341583
Lee, Jeong Soo et al. “Reference values of neutrophil-lymphocyte ratio, lymphocyte-monocyte ratio, platelet-lymphocyte ratio, and mean platelet volume in healthy adults in South Korea.” Medicine vol. 97,26 (2018): e11138. doi:10.1097/MD.0000000000011138
Martínez-Urbistondo, Diego et al. “The neutrophil-to-lymphocyte ratio as a marker of systemic endothelial dysfunction in asymptomatic subjects.” Nefrologia : publicacion oficial de la Sociedad Espanola Nefrologia vol. 36,4 (2016): 397-403. doi:10.1016/j.nefro.2015.10.018
Mazza, Mario Gennaro et al. “Neutrophil/lymphocyte ratio and platelet/lymphocyte ratio in mood disorders: A meta-analysis.” Progress in neuro-psychopharmacology & biological psychiatry vol. 84,Pt A (2018): 229-236. doi:10.1016/j.pnpbp.2018.03.012
McBurney, Michael I et al. “The omega-3 index is inversely associated with the neutrophil-lymphocyte ratio in adults'.” Prostaglandins, leukotrienes, and essential fatty acids vol. 177 (2022): 102397. doi:10.1016/j.plefa.2022.102397
McNamara, M G et al. “Neutrophil/lymphocyte ratio as a prognostic factor in biliary tract cancer.” European journal of cancer (Oxford, England : 1990) vol. 50,9 (2014): 1581-9. doi:10.1016/j.ejca.2014.02.015
Naess, Are et al. “Role of neutrophil to lymphocyte and monocyte to lymphocyte ratios in the diagnosis of bacterial infection in patients with fever.” Infection vol. 45,3 (2017): 299-307. doi:10.1007/s15010-016-0972-1
Rembach, Alan et al. “An increased neutrophil-lymphocyte ratio in Alzheimer's disease is a function of age and is weakly correlated with neocortical amyloid accumulation.” Journal of neuroimmunology vol. 273,1-2 (2014): 65-71. doi:10.1016/j.jneuroim.2014.05.005
Sahin, Azad Gazi et al. “Predictive Value of Preoperative Neutrophil Lymphocyte Ratio in Determining the Stage of Gastric Tumor.” Medical science monitor : international medical journal of experimental and clinical research vol. 23 1973-1979. 24 Apr. 2017, doi:10.12659/msm.900681
Uysal, Hilal Bektas et al. “Blood count parameters can predict the severity of coronary artery disease.” The Korean journal of internal medicine vol. 31,6 (2016): 1093-1100. doi:10.3904/kjim.2015.199
Venkatraghavan, Lashmi et al. “Neutrophil Lymphocyte Ratio as a predictor of systemic inflammation - A cross-sectional study in a pre-admission setting.” F1000Research vol. 4 123. 22 May. 2015, doi:10.12688/f1000research.6474.1
Wang, Huan et al. “The relationship between neutrophil to lymphocyte ratio and artery stiffness in subtypes of hypertension.” Journal of clinical hypertension (Greenwich, Conn.) vol. 19,8 (2017): 780-785. doi:10.1111/jch.13002
Wang, Yuchen et al. “Evaluation of the prognostic value of neutrophil to lymphocyte ratio in patients with hypertriglyceridemia-induced acute pancreatitis.” Pancreatology : official journal of the International Association of Pancreatology (IAP) ... [et al.] vol. 17,6 (2017): 893-897. doi:10.1016/j.pan.2017.10.001
Zahorec, R. “Ratio of neutrophil to lymphocyte counts--rapid and simple parameter of systemic inflammation and stress in critically ill.” Bratislavske lekarske listy vol. 102,1 (2001): 5-14.
Monocytes
Monocytes are white blood cells with dual roles, serving as immune defenders but also potentially causing tissue damage and supporting tumor growth. These cells differentiate into macrophages, osteoclasts, and microglial cells. High monocyte counts may signal inflammatory conditions like cardiovascular disease and metabolic syndrome, as well as infections and autoimmune disorders. Conversely, low levels could indicate malignancies, immune disorders, and corticosteroid use. Optimal vitamin C intake can mitigate the negative effects of monocytes/macrophages, highlighting their multifaceted roles in body health and disease.
Monocytes, Absolute
Monocytes %
References
Babio, Nancy et al. “White blood cell counts as risk markers of developing metabolic syndrome and its components in the PREDIMED study.” PloS one vol. 8,3 (2013): e58354. doi:10.1371/journal.pone.0058354
Carlberg, Carsten. “Vitamin D Signaling in the Context of Innate Immunity: Focus on Human Monocytes.” Frontiers in immunology vol. 10 2211. 13 Sep. 2019, doi:10.3389/fimmu.2019.02211
Deneke, S M. “Thiol-based antioxidants.” Current topics in cellular regulation vol. 36 (2000): 151-80. doi:10.1016/s0070-2137(01)80007-8
Deyrup, Andrea T et al. “Essential laboratory tests for medical education.” Academic pathology vol. 9,1 100046. 13 Sep. 2022, doi:10.1016/j.acpath.2022.100046
Dutta, Partha, and Matthias Nahrendorf. “Monocytes in myocardial infarction.”Arteriosclerosis, thrombosis, and vascular biology vol. 35,5 (2015): 1066-70. doi:10.1161/ATVBAHA.114.304652
Frei, B. “On the role of vitamin C and other antioxidants in atherogenesis and vascular dysfunction.” Proceedings of the Society for Experimental Biology and Medicine. Society for Experimental Biology and Medicine (New York, N.Y.) vol. 222,3 (1999): 196-204. doi:10.1046/j.1525-1373.1999.d01-136.x
Ghattas, Angie et al. “Monocytes in coronary artery disease and atherosclerosis: where are we now?.” Journal of the American College of Cardiology vol. 62,17 (2013): 1541-51. doi:10.1016/j.jacc.2013.07.043
Horne, Benjamin D et al. “Which white blood cell subtypes predict increased cardiovascular risk?.” Journal of the American College of Cardiology vol. 45,10 (2005): 1638-43. doi:10.1016/j.jacc.2005.02.054
Kim, Dong-Jun et al. “The associations of total and differential white blood cell counts with obesity, hypertension, dyslipidemia and glucose intolerance in a Korean population.” Journal of Korean medical science vol. 23,2 (2008): 193-8. doi:10.3346/jkms.2008.23.2.193
Langlois, M et al. “Serum vitamin C concentration is low in peripheral arterial disease and is associated with inflammation and severity of atherosclerosis.” Circulation vol. 103,14 (2001): 1863-8. doi:10.1161/01.cir.103.14.1863
Murray, Peter J. “Immune regulation by monocytes.” Seminars in immunology vol. 35 (2018): 12-18. doi:10.1016/j.smim.2017.12.005
Narasimhan, Prakash Babu et al. “Nonclassical Monocytes in Health and Disease.” Annual review of immunology vol. 37 (2019): 439-456. doi:10.1146/annurev-immunol-042617-053119
Pagana, Kathleen Deska, et al. Mosby's Diagnostic and Laboratory Test Reference. 15th ed., Mosby, 2021.
Price, K D et al. “Hyperglycemia-induced ascorbic acid deficiency promotes endothelial dysfunction and the development of atherosclerosis.” Atherosclerosis vol. 158,1 (2001): 1-12. doi:10.1016/s0021-9150(01)00569-x
Tigner, Alyssa, et al. “Histology, White Blood Cell.” StatPearls, StatPearls Publishing, 19 November 2021.
Woollard, Kevin J et al. “Effects of oral vitamin C on monocyte: endothelial cell adhesion in healthy subjects.” Biochemical and biophysical research communications vol. 294,5 (2002): 1161-8. doi:10.1016/S0006-291X(02)00603-4
Woollard, Kevin J, and Frederic Geissmann. “Monocytes in atherosclerosis: subsets and functions.” Nature reviews. Cardiology vol. 7,2 (2010): 77-86. doi:10.1038/nrcardio.2009.228
Yu, Jeong Il et al. “Clinical importance of the absolute count of neutrophils, lymphocytes, monocytes, and platelets in newly diagnosed hepatocellular carcinoma.” Scientific reports vol. 11,1 2614. 28 Jan. 2021, doi:10.1038/s41598-021-82177-5
Zorrilla, E P et al. “The relationship of depression and stressors to immunological assays: a meta-analytic review.” Brain, behavior, and immunity vol. 15,3 (2001): 199-226. doi:10.1006/brbi.2000.0597
Eosinophils
Eosinophils, a subset of white blood cells, are crucial in allergic reactions, asthma, immune response to parasites, and maintaining immune balance. High eosinophil levels can indicate type-II immune responses, parasitic infections, certain cancers, and metabolic syndrome, while low levels may be due to corticosteroid therapy, bacterial and most viral infections, excluding HIV. Beyond their immune functions, eosinophils could be involved in metabolic and glucose homeostasis, tissue repair, and neuronal regulation. Their presence in mucosal tissues and adipose tissue might indicate a "surveillance" role. Additionally, absolute eosinophil counts were linked to better survival rates in some cancer patients.
Eosinophils, Absolute
Eosinophils %
References
Babio, Nancy et al. “White blood cell counts as risk markers of developing metabolic syndrome and its components in the PREDIMED study.” PloS one vol. 8,3 (2013): e58354. doi:10.1371/journal.pone.0058354
Deyrup, Andrea T et al. “Essential laboratory tests for medical education.” Academic pathology vol. 9,1 100046. 13 Sep. 2022, doi:10.1016/j.acpath.2022.100046
Justiz Vaillant, Angel A., et al. “Physiology, Immune Response.” StatPearls, StatPearls Publishing, 26 September 2022.
Kim, Dong-Jun et al. “The associations of total and differential white blood cell counts with obesity, hypertension, dyslipidemia and glucose intolerance in a Korean population.” Journal of Korean medical science vol. 23,2 (2008): 193-8. doi:10.3346/jkms.2008.23.2.193
Klion, Amy D et al. “Contributions of Eosinophils to Human Health and Disease.” Annual review of pathology vol. 15 (2020): 179-209. doi:10.1146/annurev-pathmechdis-012419-032756
Pagana, Kathleen Deska, et al. Mosby's Diagnostic and Laboratory Test Reference. 15th ed., Mosby, 2021.
Koc, Ibrahim, and Sevda Unalli Ozmen. “Eosinophil Levels, Neutrophil-Lymphocyte Ratio, and Platelet-Lymphocyte Ratio in the Cytokine Storm Period of Patients with COVID-19.” International journal of clinical practice vol. 2022 7450739. 3 Aug. 2022, doi:10.1155/2022/7450739
Ramirez, Giuseppe A et al. “Eosinophils from Physiology to Disease: A Comprehensive Review.” BioMed research international vol. 2018 9095275. 28 Jan. 2018, doi:10.1155/2018/9095275
Shah, Kathleen et al. “The emerging roles of eosinophils in mucosal homeostasis.” Mucosal immunology vol. 13,4 (2020): 574-583. doi:10.1038/s41385-020-0281-y
Tigner, Alyssa, et al. “Histology, White Blood Cell.” StatPearls, StatPearls Publishing, 19 November 2021.
Wechsler, Michael E et al. “Eosinophils in Health and Disease: A State-of-the-Art Review.” Mayo Clinic proceedings vol. 96,10 (2021): 2694-2707. doi:10.1016/j.mayocp.2021.04.025
Basophils
Basophils, which constitute less than 1% of total white blood cells, play a role in inflammatory and allergic responses. Their numbers can increase in cases of parasitic infection, allergies, autoimmune disease, chronic inflammation, inflammatory bowel disease, uremia, and certain malignancies. The activation of basophils triggers the release of inflammatory mediators, causing allergic symptoms. Basophils are involved in promoting inflammation in the GI tract, respiratory system, and skin but can also provide protective immune responses against parasitic infection. Commensal microbial signaling appears to regulate basophil development beneficially, hinting at the importance of a balanced microbiome.
Basophils, Absolute
Basophils %
References
Deyrup, Andrea T et al. “Essential laboratory tests for medical education.” Academic pathology vol. 9,1 100046. 13 Sep. 2022, doi:10.1016/j.acpath.2022.100046
Justiz Vaillant, Angel A., et al. “Physiology, Immune Response.” StatPearls, StatPearls Publishing, 26 September 2022.
Karasuyama, Hajime et al. “Multifaceted roles of basophils in health and disease.” The Journal of allergy and clinical immunology vol. 142,2 (2018): 370-380. doi:10.1016/j.jaci.2017.10.042
McGowan, Emily C, and Sarbjit Saini. “Update on the performance and application of basophil activation tests.” Current allergy and asthma reports vol. 13,1 (2013): 101-9. doi:10.1007/s11882-012-0324-x
Peng, Jianya, and Mark C Siracusa. “Basophils in antihelminth immunity.” Seminars in immunology vol. 53 (2021): 101529. doi:10.1016/j.smim.2021.101529
Siracusa, Mark C et al. “Basophils and allergic inflammation.” The Journal of allergy and clinical immunology vol. 132,4 (2013): 789-801; quiz 788. doi:10.1016/j.jaci.2013.07.046
Tigner, Alyssa, et al. “Histology, White Blood Cell.” StatPearls, StatPearls Publishing, 19 November 2021.
Bands %
Bands, also known as immature neutrophils, increase in number in response to acute bacterial infection and sepsis, a condition that can be distinguished from non-infectious systemic inflammatory response syndrome (SIRS) by elevated band levels. Stimulated by cytokines, band production can also occur in response to surgery, trauma, tissue damage, and certain cancers. Bands perform some functions of mature neutrophils, aiding in the innate immune response. However, in a healthy, homeostatic state, band levels are typically low or even absent in circulation. Rising band levels often indicate an increased likelihood of sepsis or bloodstream infection.
References
Drifte, Geneviève et al. “Innate immune functions of immature neutrophils in patients with sepsis and severe systemic inflammatory response syndrome.” Critical care medicine vol. 41,3 (2013): 820-32. doi:10.1097/CCM.0b013e318274647d
Farkas, Joshua David. “The complete blood count to diagnose septic shock.” Journal of thoracic disease vol. 12,Suppl 1 (2020): S16-S21. doi:10.21037/jtd.2019.12.63
Hsueh, Leon et al. “Elevated bands as a predictor of bloodstream infection and in-hospital mortality.” The American journal of emergency medicine vol. 41 (2021): 205-208. doi:10.1016/j.ajem.2020.11.049
Kipnis, Eric. “Neutrophils in sepsis: battle of the bands.” Critical care medicine vol. 41,3 (2013): 925-6. doi:10.1097/CCM.0b013e31828042d8
Mare, Tracey Anne et al. “The diagnostic and prognostic significance of monitoring blood levels of immature neutrophils in patients with systemic inflammation.” Critical care (London, England) vol. 19,1 57. 25 Feb. 2015, doi:10.1186/s13054-015-0778-z
Pagana, Kathleen Deska, et al. Mosby's Diagnostic and Laboratory Test Reference. 15th ed., Mosby, 2021.
Immature Granulocytes
Immature granulocytes (IGs) are early-forming white blood cells that spike during infections or inflammations. High IG levels can indicate severe conditions, ranging from infections like sepsis to other health challenges like inflammation and cancer. Conversely, low IG levels usually signal good health or the absence of a major infection. Monitoring IGs helps physicians quickly gauge the severity of an illness, aiding in prompt treatment decisions.
Immature Granulocytes, Absolute
Immature Granulocytes, %
OPTIMAL DX MEMBERS CLICK HERE for more information on Immature Granulocytes
References
Ayres, Laura S et al. “Immature granulocytes index as early marker of sepsis.” International journal of laboratory hematology vol. 41,3 (2019): 392-396. doi:10.1111/ijlh.12990 Bedel, Cihan et al. “Usefulness of Immature Granulocytes to Predict High Coronary SYNTAX Score in Acute Coronary Syndrome; a Cross-sectional Study.” Archives of academic emergency medicine vol. 8,1 e73. 15 Sep. 2020
Bhansaly, Prabhav et al. “Evaluation of Immature Granulocyte Count as the Earliest Biomarker for Sepsis.” Indian journal of critical care medicine : peer-reviewed, official publication of Indian Society of Critical Care Medicine vol. 26,2 (2022): 216-223. doi:10.5005/jp-journals-10071-23920
Choto, Tanaka Arthur et al. “Excessive neutrophil recruitment promotes typical T-helper 17 responses in Coronavirus disease 2019 patients.” PloS one vol. 17,8 e0273186. 18 Aug. 2022, doi:10.1371/journal.pone.0273186
Georgakopoulou, Vasiliki Epameinondas et al. “Immature granulocytes: Innovative biomarker for SARS‑CoV‑2 infection.” Molecular medicine reports vol. 26,1 (2022): 217. doi:10.3892/mmr.2022.12733
Korkut, Mustafa et al. “Usefulness of Immature Granulocytes as A Prognostic Factor in ST-Elevation Myocardial Infarction.” Brazilian journal of cardiovascular surgery vol. 37,6 893-899. 1 Dec. 2022, doi:10.21470/1678-9741-2021-0088
Labcorp. CAP Today August 2010, Q&A Section. http://www.captodayonline.com/Archives/0810/0808_QA.html
Lipinski, Michał, and Grażyna Rydzewska. “Immature granulocytes predict severe acute pancreatitis independently of systemic inflammatory response syndrome.” Przeglad gastroenterologiczny vol. 12,2 (2017): 140-144. doi:10.5114/pg.2017.68116
Nierhaus, Axel et al. “Revisiting the white blood cell count: immature granulocytes count as a diagnostic marker to discriminate between SIRS and sepsis--a prospective, observational study.” BMC immunology vol. 14 8. 12 Feb. 2013, doi:10.1186/1471-2172-14-8
Pagana, Kathleen Deska, et al. Mosby's Diagnostic and Laboratory Test Reference. 16th ed., Mosby, 2022.
Prabu, Natesh R, and Vijaya P Patil. “Is Immature Granulocyte Count a Potential Prognostic Marker for Upper Gastrointestinal Tract Bleeding? A New Road to Explore.” Indian journal of critical care medicine : peer-reviewed, official publication of Indian Society of Critical Care Medicine vol. 24,9 (2020): 750-752. doi:10.5005/jp-journals-10071-23606
Roehrl, Michael H A et al. “Age-dependent reference ranges for automated assessment of immature granulocytes and clinical significance in an outpatient setting.” Archives of pathology & laboratory medicine vol. 135,4 (2011): 471-7. doi:10.5858/2010-0258-OA.1
Senthilnayagam, Balamurugan et al. “Automated measurement of immature granulocytes: performance characteristics and utility in routine clinical practice.” Pathology research international vol. 2012 (2012): 483670. doi:10.1155/2012/483670
Turkes, Gulsum Feyza et al. “Predictive value of immature granulocyte in the diagnosis of acute complicated appendicitis.” PloS one vol. 17,12 e0279316. 21 Dec. 2022, doi:10.1371/journal.pone.0279316
Unal, Yılmaz et al. “An effective and reliable marker in gradıng the severity of acute cholecystitis: Increased immature granulocyte percentage.” Turkish journal of trauma & emergency surgery : TJTES vol. 28,12 (2022): 1716-1722. doi:10.14744/tjtes.2021.86322
Electrolytes are essential elements that carry an electrical charge and play a critical role in various physiological processes, including maintaining fluid balance, regulating nerve and muscle function, and maintaining the body's pH levels. Imbalances in electrolyte levels can lead to dehydration, muscle cramps, irregular heartbeat, and other health issues. Common electrolytes include sodium, potassium, calcium, magnesium, chloride, and bicarbonate (CO2).
Sodium
Sodium is a vital mineral for various bodily functions, including nerve transmission, cell transport, acid-base balance, and osmotic pressure. Its levels are controlled by a complex system involving hormones, enzymes, fluid balance, and kidney function. Kidney regulation of sodium and water affects blood pressure. Low sodium may result from fluid overload, inadequate intake, excessive losses, or specific medications, while high sodium can be caused by dehydration, overconsumption, increased aldosterone, or certain medications.
OPTIMAL DX MEMBERS CLICK HERE for more information on Sodium
References
Dmitrieva, Natalia I et al. “Middle age serum sodium levels in the upper part of normal range and risk of heart failure.” European heart journal vol. 43,35 (2022): 3335-3348. doi:10.1093/eurheartj/ehac138
Dmitrieva, Natalia I et al. “Middle-age high normal serum sodium as a risk factor for accelerated biological aging, chronic diseases, and premature mortality.” EBioMedicine, 104404. 13 Dec. 2022, doi:10.1016/j.ebiom.2022.104404
Gaby, Alan R. Nutritional Medicine. Fritz Perlberg Publishing, 2017.
Oh, Se Won et al. “Small increases in plasma sodium are associated with higher risk of mortality in a healthy population.” Journal of Korean medical science vol. 28,7 (2013): 1034-40. doi:10.3346/jkms.2013.28.7.1034
Liamis, George et al. “Electrolyte disorders in community subjects: prevalence and risk factors.” The American journal of medicine vol. 126,3 (2013): 256-63. doi:10.1016/j.amjmed.2012.06.037
McCallum, Linsay et al. “The hidden hand of chloride in hypertension.” Pflugers Archiv: European journal of physiology vol. 467,3 (2015): 595-603. doi:10.1007/s00424-015-1690-8
Nakajima, Kei et al. “The association of serum sodium and chloride levels with blood pressure and estimated glomerular filtration rate.” Blood pressure vol. 25,1 (2016): 51-7. doi:10.3109/08037051.2015.1090711
Pagana, Kathleen Deska, et al. Mosby's Diagnostic and Laboratory Test Reference. 15th ed., Mosby, 2021.
Wannamethee, S G et al. “Mild hyponatremia, hypernatremia and incident cardiovascular disease and mortality in older men: A population-based cohort study.” Nutrition, metabolism, and cardiovascular diseases : NMCD vol. 26,1 (2016): 12-9. doi:10.1016/j.numecd.2015.07.008
Potassium
Potassium is an essential mineral that plays a critical role in cell function, muscle contractions, heart rate, blood pressure regulation, and nerve impulse transmission. The kidneys maintain potassium levels by retaining or excreting it as needed. Imbalances in potassium can have serious health consequences, including cardiac issues, high blood pressure, and muscle weakness. Potassium levels must be monitored closely, taking into account factors like comorbidities, renal function, medication use, and nutritional status.
OPTIMAL DX MEMBERS CLICK HERE for more information on Potassium
References
Choi, Joon Seok et al. “Relation of serum potassium level to long-term outcomes in patients with acute myocardial infarction.” The American journal of cardiology vol. 113,8 (2014): 1285-90. doi:10.1016/j.amjcard.2014.01.402
Collins, Allan J et al. “Association of Serum Potassium with All-Cause Mortality in Patients with and without Heart Failure, Chronic Kidney Disease, and/or Diabetes.” American journal of nephrology vol. 46,3 (2017): 213-221. doi:10.1159/000479802
EFSA Panel on Nutrition, Novel Foods and Food Allergens (NDA) et al. “Dietary reference values for chloride.” EFSA journal. European Food Safety Authority vol. 17,9 e05779. 4 Sep. 2019, doi:10.2903/j.efsa.2019.5779
Goyal, Abhinav, et al. "Serum potassium levels and mortality in acute myocardial infarction." Jama 307.2 (2012): 157-164.
Hughes-Austin, Jan M et al. “The Relation of Serum Potassium Concentration with Cardiovascular Events and Mortality in Community-Living Individuals.” Clinical journal of the American Society of Nephrology : CJASN vol. 12,2 (2017): 245-252. doi:10.2215/CJN.06290616
Kubzansky, Laura D, and Gail K Adler. “Aldosterone: a forgotten mediator of the relationship between psychological stress and heart disease.” Neuroscience and biobehavioral reviews vol. 34,1 (2010): 80-6. doi:10.1016/j.neubiorev.2009.07.005
Lanham-New, Susan A et al. “Potassium.” Advances in nutrition (Bethesda, Md.) vol. 3,6 820-1. 1 Nov. 2012, doi:10.3945/an.112.003012
Liamis, George et al. “Electrolyte disorders in community subjects: prevalence and risk factors.” The American journal of medicine vol. 126,3 (2013): 256-63. doi:10.1016/j.amjmed.2012.06.037
Macdonald, John E, and Allan D Struthers. “What is the optimal serum potassium level in cardiovascular patients?.” Journal of the American College of Cardiology vol. 43,2 (2004): 155-61. doi:10.1016/j.jacc.2003.06.021
Pagana, Kathleen Deska, et al. Mosby's Diagnostic and Laboratory Test Reference. 15th ed., Mosby, 2021.
Palaka, Eirini et al. “Associations between serum potassium and adverse clinical outcomes: A systematic literature review.” International journal of clinical practice vol. 74,1 (2020): e13421. doi:10.1111/ijcp.13421
Sur, Moushumi. and Shamim S. Mohiuddin. “Potassium.” StatPearls, StatPearls Publishing, 21 December 2021.
Xi, Lu et al. “Associations between serum potassium and sodium levels and risk of hypertension: a community-based cohort study.” Journal of geriatric cardiology : JGC vol. 12,2 (2015): 119-26. doi:10.11909/j.issn.1671-5411.2015.02.009
CO2, Bicarbonate
Serum bicarbonate, or CO2, is a crucial buffering compound that helps maintain acid-base balance and optimal pH in the body. Low bicarbonate levels can result in inflammation, insulin resistance, hypertension, compromised kidney function, and loss of muscle and bone, while an excess of bicarbonate may indicate metabolic alkalosis and increased mortality risk. Abnormal serum bicarbonate levels should be investigated to determine if acidosis or alkalosis are present, as they can be associated with various health issues, including cardiovascular disease and diabetes.
OPTIMAL DX MEMBERS CLICK HERE for more information on CO2 Bicarbonate
References
Abramowitz, Matthew K et al. “Lower serum bicarbonate and a higher anion gap are associated with lower cardiorespiratory fitness in young adults.” Kidney international vol. 81,10 (2012): 1033-1042. doi:10.1038/ki.2011.479
DiNicolantonio, James J, and James O'Keefe. “Low-grade metabolic acidosis as a driver of chronic disease: a 21st century public health crisis.” Open heart vol. 8,2 (2021): e001730. doi:10.1136/openhrt-2021-001730
Farwell, Wildon R, and Eric N Taylor. “Serum anion gap, bicarbonate and biomarkers of inflammation in healthy individuals in a national survey.” CMAJ : Canadian Medical Association journal = journal de l'Association medicale canadienne vol. 182,2 (2010): 137-41. doi:10.1503/cmaj.090329
Hopkins, Erin, et al. “Physiology, Acid Base Balance.” StatPearls, StatPearls Publishing, 14 September 2021.
Kraut, Jeffrey A, and Nicolaos E Madias. “Re-Evaluation of the Normal Range of Serum Total CO2 Concentration.” Clinical journal of the American Society of Nephrology : CJASN vol. 13,2 (2018): 343-347. doi:10.2215/CJN.11941017
Mandel, Ernest I et al. “Plasma bicarbonate and risk of type 2 diabetes mellitus.” CMAJ : Canadian Medical Association journal = journal de l'Association medicale canadienne vol. 184,13 (2012): E719-25. doi:10.1503/cmaj.120438
Pagana, Kathleen Deska, et al. Mosby's Diagnostic and Laboratory Test Reference. 15th ed., Mosby, 2021.
Raphael, Kalani L et al. “Bicarbonate Concentration, Acid-Base Status, and Mortality in the Health, Aging, and Body Composition Study.” Clinical journal of the American Society of Nephrology : CJASN vol. 11,2 (2016): 308-16. doi:10.2215/CJN.06200615
Chloride
Chloride is an essential mineral and major electrolyte involved in blood pressure regulation, acid-base balance, muscle contraction, digestion, and immunity. Low chloride levels can lead to issues such as hypochlorhydria, nerve and muscle excitability, low blood pressure, and shallow breathing. High chloride levels can result in weakness and lethargy. Maintaining optimal chloride levels is important for overall health, and factors such as diuretic use and congestive heart failure can impact chloride concentrations in the body.
OPTIMAL DX MEMBERS CLICK HERE for more information on Chloride
References
Berend, Kenrick et al. “Chloride: the queen of electrolytes?.” European journal of internal medicine vol. 23,3 (2012): 203-11. doi:10.1016/j.ejim.2011.11.013
Guilliams, Thomas G, and Lindsey E Drake. “Meal-Time Supplementation with Betaine HCl for Functional Hypochlorhydria: What is the Evidence?.” Integrative medicine (Encinitas, Calif.) vol. 19,1 (2020): 32-36.
McCallum, Linsay et al. “Serum chloride is an independent predictor of mortality in hypertensive patients.” Hypertension (Dallas, Tex. : 1979) vol. 62,5 (2013): 836-43. doi:10.1161/HYPERTENSIONAHA.113.01793
McCallum, Linsay et al. “The hidden hand of chloride in hypertension.” Pflugers Archiv : European journal of physiology vol. 467,3 (2015): 595-603. doi:10.1007/s00424-015-1690-8
Pagana, Kathleen Deska; Pagana, Timothy J.; Pagana, Theresa N. Mosby's Diagnostic and Laboratory Test Reference. Elsevier Health Sciences. 2019.
Raut, Satish K et al. “Chloride ions in health and disease.” Bioscience reports vol. 44,5 (2024): BSR20240029. doi:10.1042/BSR20240029
Thongprayoon, Charat et al. “Chloride alterations in hospitalized patients: Prevalence and outcome significance.” PloS one vol. 12,3 e0174430. 22 Mar. 2017, doi:10.1371/journal.pone.0174430
Wang, Guoshun, and William M Nauseef. “Salt, chloride, bleach, and innate host defense.” Journal of leukocyte biology vol. 98,2 (2015): 163-72. doi:10.1189/jlb.4RU0315-109R
Zhang, Yang et al. “Serum chloride as a novel marker for adding prognostic information of mortality in chronic heart failure.” Clinica chimica acta; international journal of clinical chemistry vol. 483 (2018): 112-118. doi:10.1016/j.cca.2018.04.028
Sodium:Potassium Ratio
The sodium-to-potassium ratio in the blood provides insight into the relative levels of these electrolytes, which are primarily regulated by hormones at the kidney level. Chronic stress and compromised adrenal activity can decrease the ratio, indicating more sodium excretion and potassium retention, while an increased ratio may reflect acute stress, increased adrenal activity, and increased aldosterone production. An abnormal sodium-to-potassium ratio can be associated with various health issues, including hypertension complications, stress, anxiety, and depression.
OPTIMAL DX MEMBERS CLICK HERE for more information on Sodium Potassium Ratio
References
Ekun, Oloruntoba A et al. “Assessment of Plasma Sodium to Potassium Ratio, Renal Function, Markers of Oxidative Stress, Inflammation, and Endothelial Dysfunction in Nigerian Hypertensive Patients.” International journal of hypertension vol. 2020 6365947. 7 Dec. 2020, doi:10.1155/2020/6365947
Garg, Rajesh et al. “Low-salt diet increases insulin resistance in healthy subjects.” Metabolism: clinical and experimental vol. 60,7 (2011): 965-8. doi:10.1016/j.metabol.2010.09.005
Kubzansky, Laura D, and Gail K Adler. “Aldosterone: a forgotten mediator of the relationship between psychological stress and heart disease.” Neuroscience and biobehavioral reviews vol. 34,1 (2010): 80-6. doi:10.1016/j.neubiorev.2009.07.005
Wardle, Jon, and Jerome Sarris. Clinical naturopathy: an evidence-based guide to practice. Elsevier Health Sciences, 2019. 3rd edition
Anion Gap
The anion gap (AG) is useful for evaluating metabolic acidosis and its causes, as it reflects the difference between positively charged cations and negatively charged anions in the blood. A high anion gap is linked to metabolic acidosis, inflammation, glucose dysregulation, and thiamine deficiency. A low anion gap may be connected to decreased anionic proteins like albumin, increased cationic immunoglobulins like IgG, or unmeasured cations such as calcium and magnesium.
OPTIMAL DX MEMBERS CLICK HERE for more information on Anion Gap
References
Abramowitz, Matthew K et al. “Lower serum bicarbonate and a higher anion gap are associated with lower cardiorespiratory fitness in young adults.” Kidney international vol. 81,10 (2012): 1033-1042. doi:10.1038/ki.2011.479
Brinkman, Joshua E. and Sandeep Sharma. “Physiology, Metabolic Alkalosis.” StatPearls, StatPearls Publishing, 18 July 2022.
Brubaker, Ross H., et al. “High Anion Gap Metabolic Acidosis.” StatPearls, StatPearls Publishing, 11 August 2021.
Farwell, Wildon R, and Eric N Taylor. “Serum anion gap, bicarbonate and biomarkers of inflammation in healthy individuals in a national survey.” CMAJ : Canadian Medical Association journal = journal de l'Association medicale canadienne vol. 182,2 (2010): 137-41. doi:10.1503/cmaj.090329
Kraut, Jeffrey A, and Nicolaos E Madias. “Serum anion gap: its uses and limitations in clinical medicine.” Clinical journal of the American Society of Nephrology : CJASN vol. 2,1 (2007): 162-74. doi:10.2215/CJN.03020906
Pagana, Kathleen Deska, et al. Mosby's Diagnostic and Laboratory Test Reference. 15th ed., Mosby, 2021.
Raymond, Janice L., et al. Krause and Mahan's Food & the Nutrition Care Process. Elsevier, 2021.
Sriram, Krishnan et al. “Thiamine in nutrition therapy.” Nutrition in clinical practice : official publication of the American Society for Parenteral and Enteral Nutrition vol. 27,1 (2012): 41-50. doi:10.1177/0884533611426149
Zhang, Yingchao et al. “A Higher Serum Anion Gap Is Associated with the Risk of Progressing to Impaired Fasting Glucose and Diabetes.” International journal of endocrinology vol. 2021 4350418. 13 Dec. 2021, doi:10.1155/2021/4350418
Enzymes are specialized molecules that act as biological catalysts, accelerating chemical reactions in the body without being consumed in the process. They play a crucial role in various physiological processes, including metabolism, digestion, DNA replication, and protein synthesis. Enzymes are essential for maintaining homeostasis, as they facilitate the breakdown of nutrients, the production of energy, and the synthesis of biomolecules required for cellular function and growth. Most enzymes are proteins, although not all proteins are enzymes.
Amylase, Serum
Amylase is an enzyme primarily produced in the salivary glands and pancreas that helps break down starchy carbohydrates. High serum amylase levels can indicate acute pancreatitis, other gastrointestinal issues, or reduced kidney function, while low levels may be associated with metabolic disorders like obesity, diabetes, metabolic syndrome, and fatty liver and pancreas diseases. The enzyme can also be affected by medications, alcohol, and acidosis. Elevated amylase levels should be investigated to identify any underlying issues.
OPTIMAL DX MEMBERS CLICK HERE for more information on Amylase
References
Ismail, Ola Z, and Vipin Bhayana. “Lipase or amylase for the diagnosis of acute pancreatitis?.” Clinical biochemistry vol. 50,18 (2017): 1275-1280. doi:10.1016/j.clinbiochem.2017.07.003
Ko, Juyeon et al. “Low serum amylase, lipase, and trypsin as biomarkers of metabolic disorders: A systematic review and meta-analysis.” Diabetes research and clinical practice vol. 159 (2020): 107974. doi:10.1016/j.diabres.2019.107974
Oh, Hyoung-Chul et al. “Low Serum Pancreatic Amylase and Lipase Values Are Simple and Useful Predictors to Diagnose Chronic Pancreatitis.” Gut and liver vol. 11,6 (2017): 878-883. doi:10.5009/gnl17066
Pagana, Kathleen Deska, et al. Mosby's Diagnostic and Laboratory Test Reference. 15th ed., Mosby, 2021.
Raveendra, K. R., and C. N. Mohan. "A study of serum amylase as a probable prognostic marker in acute organophosphorus poisoning." APIK Journal of Internal Medicine 9.2 (2021): 94.
Lipase
Pancreatic lipase is an enzyme that helps break down fats in the digestive system. It is primarily produced in the pancreas and released into the small intestine. Low levels of pancreatic lipase in the blood may indicate pancreatic dysfunction or metabolic disorders, such as pancreatic cancer, obesity, or diabetes. High serum lipase levels can be associated with conditions like acute pancreatitis, cholecystitis, and kidney failure, or may result from certain medications. Monitoring pancreatic lipase levels can help diagnose and manage various health conditions related to the pancreas and metabolism.
OPTIMAL DX MEMBERS CLICK HERE for more information on Pancreatic Lipase
References
Gültepe, İlhami et al. “Low lipase levels as an independent marker of pancreatic cancer: a frequently neglected condition in clinical setting.” The Turkish journal of gastroenterology : the official journal of Turkish Society of Gastroenterology vol. 27,2 (2016): 197-200. doi:10.5152/tjg.2016.16056
Hameed, Ahmer M et al. “Significant elevations of serum lipase not caused by pancreatitis: a systematic review.” HPB : the official journal of the International Hepato Pancreato Biliary Association vol. 17,2 (2015): 99-112. doi:10.1111/hpb.12277
Ismail, Ola Z, and Vipin Bhayana. “Lipase or amylase for the diagnosis of acute pancreatitis?.” Clinical biochemistry vol. 50,18 (2017): 1275-1280. doi:10.1016/j.clinbiochem.2017.07.003
Ko, Juyeon et al. “Low serum amylase, lipase, and trypsin as biomarkers of metabolic disorders: A systematic review and meta-analysis.” Diabetes research and clinical practice vol. 159 (2020): 107974. doi:10.1016/j.diabres.2019.107974
Oh, Hyoung-Chul et al. “Low Serum Pancreatic Amylase and Lipase Values Are Simple and Useful Predictors to Diagnose Chronic Pancreatitis.” Gut and liver vol. 11,6 (2017): 878-883. doi:10.5009/gnl17066
Pagana, Kathleen Deska, et al. Mosby's Diagnostic and Laboratory Test Reference. 15th ed., Mosby, 2021.
Diamine Oxidase (DAO)
Diamine oxidase (DAO) is an enzyme found in the gastrointestinal tract that breaks down histamine in food. Blood levels of DAO can help determine a person's ability to metabolize histamine and their susceptibility to histamine intolerance. This intolerance is characterized by symptoms such as abdominal bloating, diarrhea, itching, flushing, and headaches. Managing histamine intolerance often involves avoiding high-histamine foods and taking supplemental DAO. Low DAO levels may be associated with genetic factors or nutrient deficiencies, while high DAO activity indicates an ability to adequately break down histamine.
References
Comas-Basté, Oriol et al. “Histamine Intolerance: The Current State of the Art.” Biomolecules vol. 10,8 1181. 14 Aug. 2020, doi:10.3390/biom10081181
DiNicolantonio, James J et al. “Copper deficiency may be a leading cause of ischaemic heart disease.” Open heart vol. 5,2 e000784. 8 Oct. 2018, doi:10.1136/openhrt-2018-000784
Honzawa, Yusuke et al. “Clinical significance of serum diamine oxidase activity in inflammatory bowel disease: Importance of evaluation of small intestinal permeability.” Inflammatory bowel diseases vol. 17,2 (2011): E23-5. doi:10.1002/ibd.21588
Hrubisko, Martin et al. “Histamine Intolerance-The More We Know the Less We Know. A Review.” Nutrients vol. 13,7 2228. 29 Jun. 2021, doi:10.3390/nu13072228
Manzotti, G et al. “Serum diamine oxidase activity in patients with histamine intolerance.” International journal of immunopathology and pharmacology vol. 29,1 (2016): 105-11. doi:10.1177/0394632015617170
Mušič, Ema et al. “Serum diamine oxidase activity as a diagnostic test for histamine intolerance.” Wiener klinische Wochenschrift vol. 125,9-10 (2013): 239-43. doi:10.1007/s00508-013-0354-y
Schnedl, Wolfgang J et al. “Diamine oxidase supplementation improves symptoms in patients with histamine intolerance.” Food science and biotechnology vol. 28,6 1779-1784. 24 May. 2019, doi:10.1007/s10068-019-00627-3
Schnedl, Wolfgang J, and Dietmar Enko. “Histamine Intolerance Originates in the Gut.” Nutrients vol. 13,4 1262. 12 Apr. 2021, doi:10.3390/nu13041262
Tryptase
Tryptase is an enzyme released by mast cells, and its levels increase acutely during severe allergic reactions. Elevated tryptase levels are primarily associated with mast cell activation, which can occur during conditions like anaphylaxis, allergies, and mastocytosis. Chronically elevated tryptase can also indicate underlying issues such as bone marrow disorders, chronic renal failure, or hereditary alpha-tryptasemia (HaT). A baseline tryptase level above 8 µg/L may prompt further investigation, including for systemic mastocytosis. It is essential to interpret tryptase levels in the context of symptoms and clinical presentation to guide diagnosis and treatment.
OPTIMAL DX MEMBERS CLICK HERE for more information on Tryptase
References
Chovanec, Jack et al. “Genetically defined individual reference ranges for tryptase limit unnecessary procedures and unmask myeloid neoplasms.” Blood advances vol. 7,9 (2023): 1796-1810. doi:10.1182/bloodadvances.2022007936
Genebygene.com/tryptase Tryptase Copy Number Variation Testing.
Gulen, Theo. “Using the Right Criteria for MCAS.” Current allergy and asthma reports vol. 24,2 (2024): 39-51. doi:10.1007/s11882-024-01126-0 This article is licensed under a Creative Commons Attribution 4.0 International License
Lee, Adrian Y S. “Elevated Serum Tryptase in Non-Anaphylaxis Cases: A Concise Review.” International archives of allergy and immunology vol. 181,5 (2020): 357-364. doi:10.1159/000506199
Mateja, Allyson et al. “Defining baseline variability of serum tryptase levels improves accuracy in identifying anaphylaxis.” The Journal of allergy and clinical immunology vol. 149,3 (2022): 1010-1017.e10. doi:10.1016/j.jaci.2021.08.007
NIH Total Rise in Peripheral Tryptase After a Systemic Event (TRIPTASE) https://triptase-calculator.niaid.nih.gov/
Pongdee, Thanai, and Mariana Castells. “Elevated Tryptase: Conditions and Pitfalls.” The journal of allergy and clinical immunology. In practice vol. 10,9 (2022): 2436-2437. doi:10.1016/j.jaip.2022.06.028
Valent, Peter et al. “The Normal Range of Baseline Tryptase Should Be 1 to 15 ng/mL and Covers Healthy Individuals With HαT.” The journal of allergy and clinical immunology. In practice vol. 11,10 (2023): 3010-3020. doi:10.1016/j.jaip.2023.08.008
Valent, Peter et al. “Reversible Elevation of Tryptase Over the Individual's Baseline: Why is It the Best Biomarker for Severe Systemic Mast Cell Activation and MCAS?.” Current allergy and asthma reports vol. 24,3 (2024): 133-141. doi:10.1007/s11882-024-01124-2
Waters, Aubri M et al. “Elevated Basal Serum Tryptase: Disease Distribution and Variability in a Regional Health System.” The journal of allergy and clinical immunology. In practice vol. 10,9 (2022): 2424-2435.e5. doi:10.1016/j.jaip.2021.12.031
Weiler, Catherine R et al. “AAAAI Mast Cell Disorders Committee Work Group Report: Mast cell activation syndrome (MCAS) diagnosis and management.” The Journal of allergy and clinical immunology vol. 144,4 (2019): 883-896. doi:10.1016/j.jaci.2019.08.023
Wongkaewpothong, Patcharaporn et al. “The utility of serum tryptase in the diagnosis of food-induced anaphylaxis.” Allergy, asthma & immunology research vol. 6,4 (2014): 304-9. doi:10.4168/aair.2014.6.4.304
G6PD
The G6PD enzyme is essential for producing NADPH, which is crucial for glutathione and nitric oxide production. Glutathione is a powerful antioxidant, while nitric oxide supports vascular health. G6PD deficiency, the most common enzyme deficiency in humans, is linked to various health issues, including hemolytic anemia and oxidative stress. Low G6PD levels can result from genetic or acquired deficiencies, while high levels may offer protection. Early screening and avoiding certain foods and medications can help manage G6PD deficiency and prevent complications.
References
Bhutani, Vinod K et al. “Point-of-Care Quantitative Measure of Glucose-6-Phosphate Dehydrogenase Enzyme Deficiency.” Pediatrics vol. 136,5 (2015): e1268-75. doi:10.1542/peds.2015-2122
Chen, Yicong et al. “Association between aspirin-induced hemoglobin decline and outcome after acute ischemic stroke in G6PD-deficient patients.” CNS neuroscience & therapeutics vol. 27,10 (2021): 1206-1213. doi:10.1111/cns.13711
Eziokwu, Akaolisa S, and Dana Angelini. “New Diagnosis of G6PD Deficiency Presenting as Severe Rhabdomyolysis.” Cureus vol. 10,3 e2387. 28 Mar. 2018, doi:10.7759/cureus.2387
Gaskin, R S et al. “G6PD deficiency: its role in the high prevalence of hypertension and diabetes mellitus.” Ethnicity & disease vol. 11,4 (2001): 749-54.
Gheita, Tamer Atef et al. “Subclinical reduced G6PD activity in rheumatoid arthritis and Sjögren's Syndrome patients: relation to clinical characteristics, disease activity and metabolic syndrome.” Modern rheumatology vol. 24,4 (2014): 612-7. doi:10.3109/14397595.2013.851639
Hagag, Adel A et al. “Study of Glucose-6-Phosphate Dehydrogenase Deficiency: 5 Years Retrospective Egyptian Study.” Endocrine, metabolic & immune disorders drug targets vol. 18,2 (2018): 155-162. doi:10.2174/1871530317666171003160350
Jain, Sushil K et al. “The potential link between inherited G6PD deficiency, oxidative stress, and vitamin D deficiency and the racial inequities in mortality associated with COVID-19.” Free radical biology & medicine vol. 161 (2020): 84-91. doi:10.1016/j.freeradbiomed.2020.10.002
Lee, Shaun Wen Huey et al. “What G6PD-deficient individuals should really avoid.” British journal of clinical pharmacology vol. 83,1 (2017): 211-212. doi:10.1111/bcp.13091
Lee, Shaun Wen Huey et al. “Adverse effects of herbal or dietary supplements in G6PD deficiency: a systematic review.” British journal of clinical pharmacology vol. 83,1 (2017): 172-179. doi:10.1111/bcp.12976
Luzzatto, Lucio et al. “Glucose-6-Phosphate Dehydrogenase Deficiency.” Hematology/oncology clinics of North America vol. 30,2 (2016): 373-93. doi:10.1016/j.hoc.2015.11.006
Nassef, Yasser E., et al. "Evaluation of G6PD activity and antioxidants status in jaundiced Egyptian neonates." International Journal 5.12 (2013): 550-559.
Noland, Diana, Jeanne A. Drisko, and Leigh Wagner, eds. Integrative and functional medical nutrition therapy: principles and practices. Springer Nature, 2020.
Northrop-Clewes, Christine A, and David I Thurnham. “Biomarkers for the differentiation of anemia and their clinical usefulness.” Journal of blood medicine vol. 4 11-22. 20 Mar. 2013, doi:10.2147/JBM.S29212
Pagana, Kathleen Deska, et al. Mosby's Diagnostic and Laboratory Test Reference. 15th ed., Mosby, 2021.
Quinn, Joseph et al. “Effect of High-Dose Vitamin C Infusion in a Glucose-6-Phosphate Dehydrogenase-Deficient Patient.” Case reports in medicine vol. 2017 (2017): 5202606. doi:10.1155/2017/5202606
Richardson, S. Russ. and Gerald F. O'Malley. “Glucose 6 Phosphate Dehydrogenase Deficiency.” StatPearls, StatPearls Publishing, 26 July 2021.
Myeloperoxidase (MPO)
Myeloperoxidase (MPO) is an enzyme produced by white blood cells that contributes to inflammation, oxidative stress, and cardiovascular disease. Low MPO levels, potentially due to MPO deficiency, may be cardioprotective. High MPO levels are associated with increased cardiovascular risk, hypertension, diabetes, and smoking. Antioxidants, such as vitamins C and E, and a diet rich in plant-based foods can help mitigate MPO-induced oxidation and protect against associated health issues.
OPTIMAL DX MEMBERS CLICK HERE for more information on Myeloperoxidase
References
Brennan, Marie-Luise et al. “Prognostic value of myeloperoxidase in patients with chest pain.” The New England journal of medicine vol. 349,17 (2003): 1595-604. doi:10.1056/NEJMoa035003
Carr, A C et al. “Oxidation of LDL by myeloperoxidase and reactive nitrogen species: reaction pathways and antioxidant protection.” Arteriosclerosis, thrombosis, and vascular biology vol. 20,7 (2000): 1716-23. doi:10.1161/01.atv.20.7.1716
Dimitrios, Boskou. "Sources of natural phenolic antioxidants." Trends in food science & technology 17.9 (2006): 505-512.
Ferrante, Giuseppe et al. “High levels of systemic myeloperoxidase are associated with coronary plaque erosion in patients with acute coronary syndromes: a clinicopathological study.” Circulation vol. 122,4 (2010): 2505-13. doi:10.1161/CIRCULATIONAHA.110.955302
Halliwell, B et al. “Biologically significant scavenging of the myeloperoxidase-derived oxidant hypochlorous acid by ascorbic acid. Implications for antioxidant protection in the inflamed rheumatoid joint.” FEBS letters vol. 213,1 (1987): 15-7. doi:10.1016/0014-5793(87)81456-4
Heslop, Claire L et al. “Myeloperoxidase and C-reactive protein have combined utility for long-term prediction of cardiovascular mortality after coronary angiography.” Journal of the American College of Cardiology vol. 55,11 (2010): 1102-9. doi:10.1016/j.jacc.2009.11.050
Lobo, V et al. “Free radicals, antioxidants and functional foods: Impact on human health.” Pharmacognosy reviews vol. 4,8 (2010): 118-26. doi:10.4103/0973-7847.70902
Penn, Marc S, and Andrea B Klemes. “Multimarker approach for identifying and documenting mitigation of cardiovascular risk.” Future cardiology vol. 9,4 (2013): 497-506. doi:10.2217/fca.13.27
Ramachandra, Chrishan J A et al. “Myeloperoxidase As a Multifaceted Target for Cardiovascular Protection.” Antioxidants & redox signaling vol. 32,15 (2020): 1135-1149. doi:10.1089/ars.2019.7971
Tang, W H Wilson et al. “Plasma myeloperoxidase levels in patients with chronic heart failure.” The American journal of cardiology vol. 98,6 (2006): 796-9. doi:10.1016/j.amjcard.2006.04.018
Tavora, Fabio R et al. “Monocytes and neutrophils expressing myeloperoxidase occur in fibrous caps and thrombi in unstable coronary plaques.” BMC cardiovascular disorders vol. 9 27. 23 Jun. 2009, doi:10.1186/1471-2261-9-27
Yashin, Alexander et al. “Antioxidant Activity of Spices and Their Impact on Human Health: A Review.” Antioxidants (Basel, Switzerland) vol. 6,3 70. 15 Sep. 2017, doi:10.3390/antiox6030070
Lipoprotein-associated phospholipase A2 (Lp-PLA2)
Lipoprotein-associated phospholipase A2 (Lp-PLA2) is an enzyme linked to inflammation, oxidized lipoproteins, and cardiometabolic disease. Low levels of Lp-PLA2 suggest a reduced risk of these conditions, while high levels are associated with vascular inflammation, advanced atherosclerotic plaque, metabolic syndrome, and diabetes. Elevated Lp-PLA2 levels combined with high hs-CRP indicate an increased risk of carotid stenosis, coronary heart disease, and stroke. A Western-style diet can increase Lp-PLA2, whereas a vegetarian diet rich in fruits and vegetables can decrease it.
OPTIMAL DX MEMBERS CLICK HERE for more information on Lp-PLA2
References
Bonnefont-Rousselot, D. “La Lp-PLA2, marqueur d'inflammation vasculaire et de vulnérabilité de la plaque d'athérosclérose” [Lp-PLA2, a biomarker of vascular inflammation and vulnerability of atherosclerosis plaques]. Annales pharmaceutiques francaises vol. 74,3 (2016): 190-7. doi:10.1016/j.pharma.2015.09.002
Charniot, J C et al. “Interpretation of lipoprotein-associated phospholipase A2 levels is influenced by cardiac disease, comorbidities, extension of atherosclerosis and treatments.” International journal of cardiology vol. 168,1 (2013): 132-8. doi:10.1016/j.ijcard.2012.09.054
Cushman, M., et al. "Lipoprotein-associated phospholipase A2 (Lp-PLA2) activity and coronary heart disease risk in a biracial cohort: The reasons for geographic and racial differences in stroke (regards) cohort." Atherosclerosis 241.1 (2015): e9.
De Stefano, Alessandro et al. “Lp-PLA2, a new biomarker of vascular disorders in metabolic diseases.” International journal of immunopathology and pharmacology vol. 33 (2019): 2058738419827154. doi:10.1177/2058738419827154
Hu, Gaifeng et al. “Lipoprotein-Associated Phospholipase A2 Activity and Mass as Independent Risk Factor of Stroke: A Meta-Analysis.” BioMed research international vol. 2019 8642784. 20 May. 2019, doi:10.1155/2019/8642784
Liu, Huamin et al. “Association between high-sensitivity C-reactive protein, lipoprotein-associated phospholipase A2 and carotid atherosclerosis: A cross-sectional study.” Journal of cellular and molecular medicine vol. 22,10 (2018): 5145-5150. doi:10.1111/jcmm.13803
Seyedi, Seyed Hashem Sezavar et al. “The relationship between dietary patterns and lipoprotein-associated phospholipase A2 levels in adults with cardiovascular risk factors: Tehran Lipid and Glucose Study.” Journal of research in medical sciences : the official journal of Isfahan University of Medical Sciences vol. 25 3. 20 Jan. 2020, doi:10.4103/jrms.JRMS_256_19
Silva, Isis T et al. “Antioxidant and inflammatory aspects of lipoprotein-associated phospholipase A₂ (Lp-PLA₂): a review.” Lipids in health and disease vol. 10 170. 28 Sep. 2011, doi:10.1186/1476-511X-10-170
Lp-PLA2 Activity
Measuring Lp-PLA2 activity is considered more accurate than quantifying the enzyme in blood, as it reflects the enzyme's activity level and the amount of oxidation and severity of atherosclerosis present. High Lp-PLA2 activity is linked to increased oxidative stress, oxidized lipoproteins, and an insufficiency of antioxidants, leading to a higher risk of cardiovascular disease, stroke, metabolic syndrome, and diabetes. Conversely, low Lp-PLA2 activity indicates reduced oxidation of lipoproteins and a lower risk of vascular inflammation and atherosclerosis. Factors such as smoking, age, aspirin use, hypercholesterolemia, obesity, and antioxidant insufficiency can influence Lp-PLA2 activity.
OPTIMAL DX MEMBERS CLICK HERE for more information on Lp-PLA2 Activity
References
Capoulade, Romain et al. “Impact of plasma Lp-PLA2 activity on the progression of aortic stenosis: the PROGRESSA study.” JACC. Cardiovascular imaging vol. 8,1 (2015): 26-33. doi:10.1016/j.jcmg.2014.09.016
De Stefano, Alessandro et al. “Lp-PLA2, a new biomarker of vascular disorders in metabolic diseases.” International journal of immunopathology and pharmacology vol. 33 (2019): 2058738419827154. doi:10.1177/2058738419827154
Silva, Isis T et al. “Antioxidant and inflammatory aspects of lipoprotein-associated phospholipase A₂ (Lp-PLA₂): a review.” Lipids in health and disease vol. 10 170. 28 Sep. 2011, doi:10.1186/1476-511X-10-170
Creatine Kinase
Creatine kinase (CK), also known as creatine phosphokinase (CPK), is an enzyme found mainly in heart muscle, skeletal muscle, lung, and brain tissues. Elevated CK levels can indicate inflammation or tissue damage and are associated with conditions such as myocardial infarction, hypertension, and muscle disorders. On the other hand, low CK levels may be linked to decreased muscle mass or increased risk of asthma. Strenuous exercise can cause temporary CK elevation, while persistent elevation should be monitored for adequate recovery. Currently, measuring cardiac troponin levels is preferred over CK measurements for diagnosing heart issues.
OPTIMAL DX MEMBERS CLICK HERE for more information on Creatine Kinase
References
Akbar, Mohammad Rizki et al. “The prognostic value of elevated creatine kinase to predict poor outcome in patients with COVID-19 - A systematic review and meta-analysis.” Diabetes & metabolic syndrome vol. 15,2 (2021): 529-534. doi:10.1016/j.dsx.2021.02.012
Backer, Henrik Constantin et al. “Exertional rhabdomyolysis and causes of elevation of creatine kinase.” The Physician and sportsmedicine vol. 48,2 (2020): 179-185. doi:10.1080/00913847.2019.1669410
Fiorentini, Diana et al. “Magnesium: Biochemistry, Nutrition, Detection, and Social Impact of Diseases Linked to Its Deficiency.” Nutrients vol. 13,4 1136. 30 Mar. 2021, doi:10.3390/nu13041136
Forno, Erick, and Paul D Robinson. “UnloCKing the Role of Creatine Kinase in Childhood Asthma.” American journal of respiratory and critical care medicine, 10.1164/rccm.202208-1552ED. 19 Aug. 2022, doi:10.1164/rccm.202208-1552ED
Giechaskiel, Barouch. "Weight training and creatine kinase (CK) levels: a literature review." Int J Sci Res IJSR 9.1 (2020): 303-11.
Lam, Fui-Ching et al. “Effectiveness of whey protein supplements on the serum levels of amino acid, creatinine kinase and myoglobin of athletes: a systematic review and meta-analysis.” Systematic reviews vol. 8,1 130. 31 May. 2019, doi:10.1186/s13643-019-1039-z
Levy, Michael et al. “Prognostic value of troponin and creatine kinase muscle and brain isoenzyme measurement after noncardiac surgery: a systematic review and meta-analysis.” Anesthesiology vol. 114,4 (2011): 796-806. doi:10.1097/ALN.0b013e31820ad503
Pagana, Kathleen Deska, et al. Mosby's Diagnostic and Laboratory Test Reference. 15th ed., Mosby, 2021.
Parker, Beth A et al. “Effect of statins on creatine kinase levels before and after a marathon run.” The American journal of cardiology vol. 109,2 (2012): 282-7. doi:10.1016/j.amjcard.2011.08.045
Rafiq, M K et al. “Creatine kinase enzyme level correlates positively with serum creatinine and lean body mass, and is a prognostic factor for survival in amyotrophic lateral sclerosis.” European journal of neurology vol. 23,6 (2016): 1071-8. doi:10.1111/ene.12995
Sukul, Surankita, et al. "Serum Creatine Kinase Activity among Hypertensive Patients and its Role as a Predictor for Failure of Antihypertensive Treatment." Journal of Clinical & Diagnostic Research 12.11 (2018).
Tai, Hongfei et al. “Correlation of Creatine Kinase Levels with Clinical Features and Survival in Amyotrophic Lateral Sclerosis.” Frontiers in neurology vol. 8 322. 3 Jul. 2017, doi:10.3389/fneur.2017.00322
CK-MB
CK-MB is a form of creatine kinase, an enzyme that helps produce energy. It is found mainly in the heart but can also be found in other high-energy tissues. When the heart muscle is damaged, CK-MB is released, and levels rise in the blood.
Elevated CK-MB can indicate a heart attack or other heart problems, but levels can also increase with intense exercise, skeletal muscle damage, muscle diseases, or following invasive cardiac procedures such as percutaneous coronary intervention (PCI). Vitamin C can help reduce damage and moderate CK-MB levels following PCI.
Because CK-MB isn't entirely specific to heart damage, troponin tests are now preferred for diagnosing heart attacks. Low CK-MB levels generally suggest that there is no significant cardiac injury.
References
Alexander, J H et al. “Association between minor elevations of creatine kinase-MB level and mortality in patients with acute coronary syndromes without ST-segment elevation. PURSUIT Steering Committee. Platelet Glycoprotein IIb/IIIa in Unstable Angina: Receptor Suppression Using Integrilin Therapy.” JAMA vol. 283,3 (2000): 347-53. doi:10.1001/jama.283.3.347
Ghosh, Abhra et al. “Higher Levels of Creatine Kinase MB (CK-MB) Than Total Creatine Kinase (CK): A Biochemistry Reporting Error or an Indicator of Other Pathologies?.” Cureus vol. 15,12 e50792. 19 Dec. 2023, doi:10.7759/cureus.50792
Kurapati, Rahul. and Michael P. Soos. “CPK-MB.” StatPearls, StatPearls Publishing, 7 April 2023
Liu, Yin et al. “Diagnostic value of the creatine kinase-MB/creatine kinase and neutrophil/lymphocyte ratios in acute myocardial infarction.” Journal of cardiothoracic surgery vol. 19,1 227. 16 Apr. 2024, doi:10.1186/s13019-024-02740-9
Mehran, R et al. “Atherosclerotic plaque burden and CK-MB enzyme elevation after coronary interventions : intravascular ultrasound study of 2256 patients.” Circulation vol. 101,6 (2000): 604-10. doi:10.1161/01.cir.101.6.604
Pagana, Kathleen Deska, et al. Mosby’s Diagnostic and Laboratory Test Reference. 17th ed., Mosby, 2024.
Rozemeijer, Sander et al. “Vitamin C may reduce troponin and CKMB levels after PCI and CABG: a meta-analysis.” BMC cardiovascular disorders vol. 23,1 475. 21 Sep. 2023, doi:10.1186/s12872-023-03459-6
Wu, Yen-Wen et al. “Potential impacts of high-sensitivity creatine kinase-MB on long-term clinical outcomes in patients with stable coronary heart disease.” Scientific reports vol. 10,1 5638. 27 Mar. 2020, doi:10.1038/s41598-020-61894-3
Epstein-Barr virus (EBV) is a common human herpesvirus that infects a majority of the global population. It is associated with several diseases, including infectious mononucleosis, Guillain-Barre syndrome, multiple sclerosis, and certain cancers. Upon infection, the immune system produces specific immunoglobulins (antibodies) against the virus. These antibodies, including Immunoglobulin M (IgM) and Immunoglobulin G (IgG), play a crucial role in the immune response to EBV.IgM is the first antibody to be produced during an EBV infection and is a marker of an acute or recent infection. IgG antibodies appear later and indicate a past infection or reactivation of the virus. The presence and levels of these immunoglobulins in the blood can help healthcare professionals diagnose EBV-related illnesses, determine the stage of infection, and monitor the immune response to the virus.
EBV AB VCA, IgG
The Epstein-Barr virus (EBV) Ab VCA, IgG biomarker is a crucial indicator of a past or current EBV infection. EBV, a member of the herpesvirus family, is responsible for causing infectious mononucleosis and has been linked to certain cancers and autoimmune disorders. The presence of IgG antibodies against viral capsid antigen (VCA) in the blood suggests a previous exposure to the virus, while high levels might indicate a reactivated or ongoing infection.
OPTIMAL DX MEMBERS CLICK HERE for more information on EBV AB VCA, IgG
References
Abrahamyan, Sargis et al. “Complete Epstein-Barr virus seropositivity in a large cohort of patients with early multiple sclerosis.” Journal of neurology, neurosurgery, and psychiatry vol. 91,7 (2020): 681-686. doi:10.1136/jnnp-2020-322941
Centers for Disease Control and Prevention. Laboratory Testing Epstein Barr Virus (EBV). Reviewed September 28, 2020. Healthcare Providers.
Dittfeld, Anna et al. “A possible link between the Epstein-Barr virus infection and autoimmune thyroid disorders.” Central-European journal of immunology vol. 41,3 (2016): 297-301. doi:10.5114/ceji.2016.63130
EBV Ab VCA, IgM
The EBV Ab VCA IgM antibody appears early in an Epstein-Barr virus (EBV) infection and usually disappears within 4-6 weeks. If VCA IgM antibodies are present but EBNA antibodies are not, it likely indicates a new or recent infection. Low VCA IgM levels suggest that an active infection is not present, but do not rule out past infection. High VCA IgM levels indicate a new or recent infection.
OPTIMAL DX MEMBERS CLICK HERE for more information on EBV AB VCA, IgM
References
Abrahamyan, Sargis et al. “Complete Epstein-Barr virus seropositivity in a large cohort of patients with early multiple sclerosis.” Journal of neurology, neurosurgery, and psychiatry vol. 91,7 (2020): 681-686. doi:10.1136/jnnp-2020-322941
Centers for Disease Control and Prevention. Laboratory Testing Epstein-Barr Virus (EBV). Reviewed September 28, 2020
EBV Nuclear Antigen (EBNA) Ab, IgG
The EBNA antibody appears 2-4 months after an Epstein-Barr virus (EBV) infection and persists throughout an individual's life, indicating a past infection. Low EBNA IgG antibody levels suggest the absence of past EBV infection but do not rule out a current new infection. High EBNA IgG antibody levels indicate a past infection with EBV.
OPTIMAL DX MEMBERS CLICK HERE for more information on EBV EBNA Ab, IgG
References
Abrahamyan, Sargis et al. “Complete Epstein-Barr virus seropositivity in a large cohort of patients with early multiple sclerosis.” Journal of neurology, neurosurgery, and psychiatry vol. 91,7 (2020): 681-686. doi:10.1136/jnnp-2020-322941
Centers for Disease Control and Prevention. Laboratory Testing Epstein-Barr Virus (EBV). Reviewed September 28, 2020
EBV Early Antigen Ab, IgG
The presence of EBV early antigen IgG indicates an acute infection, though levels may persist beyond the acute phase. Low levels of early antigen IgG suggest that an acute EBV infection is not present. High levels of early antigen IgG indicate an acute phase of infection, but elevated antibodies may persist in some individuals even after the acute phase has passed.
OPTIMAL DX MEMBERS CLICK HERE for more information on EBV Early Antigen Ab, IgG
References
Centers for Disease Control and Prevention. Laboratory Testing Epstein-Barr Virus (EBV). Reviewed September 28, 2020
The Omega-3 Index is a biomarker that reflects the proportion of the long-chain omega-3 fatty acids, eicosapentaenoic acid (EPA) and docosahexaenoic acid (DHA), in red blood cell membranes. It is expressed as a percentage of total fatty acids and serves as an indicator of omega-3 status and dietary intake. The Omega-3 Index has gained attention for its potential role in assessing cardiovascular disease (CVD) risk and overall health. Higher Omega-3 Index levels are associated with a reduced risk of CVD, as EPA and DHA have anti-inflammatory, anti-thrombotic, and anti-arrhythmic properties. These fatty acids help maintain healthy blood vessels, improve lipid profiles, and lower blood pressure. Studies have shown that individuals with an Omega-3 Index of 8% or higher have a lower risk of fatal CVD events compared to those with lower levels. Additionally, omega-3 fatty acids may play a role in supporting cognitive function, eye health, and mood regulation. In summary, the Omega-3 Index is an important biomarker for evaluating an individual's omega-3 status and potential CVD risk. Maintaining an optimal Omega-3 Index may help promote overall health and reduce the risk of chronic diseases.
The Omega-3 Index
The omega-3 index is a significant blood biomarker that reflects the concentration of essential long-chain omega-3 fatty acids, eicosapentaenoic acid (EPA) and docosahexaenoic acid (DHA), in the red blood cell membranes as well as an indicator of tissue levels in the body, including cardiac and gastrointestinal tissue. This index is considered a valuable tool in assessing an individual's risk of developing cardiovascular diseases, monitoring the effectiveness of omega-3 supplementation, and evaluating overall nutritional status. The omega-3 index provides insights into the complex relationship between dietary habits, inflammation, and health, making it an important blood biomarker to measure and monitor.
OPTIMAL DX MEMBERS CLICK HERE for more information on The Omega-3 Index
References
Alqarni, Ayedh et al. “Comparison of erythrocyte omega-3 index, fatty acids and molecular phospholipid species in people at ultra-high risk of developing psychosis and healthy people.” Schizophrenia research vol. 226 (2020): 44-51. doi:10.1016/j.schres.2019.06.020
Davinelli, Sergio et al. “Metabolic indices of polyunsaturated fatty acids: current evidence, research controversies, and clinical utility.” Critical reviews in food science and nutrition, 1-16. 14 Feb. 2020, doi:10.1080/10408398.2020.1724871
Fischer, Robert et al. “Dietary omega-3 fatty acids modulate the eicosanoid profile in man primarily via the CYP-epoxygenase pathway.” Journal of lipid research vol. 55,6 (2014): 1150-64. doi:10.1194/jlr.M047357
Gurzell, Eric A et al. “Is the omega-3 index a valid marker of intestinal membrane phospholipid EPA+DHA content?.” Prostaglandins, leukotrienes, and essential fatty acids vol. 91,3 (2014): 87-96. doi:10.1016/j.plefa.2014.04.001
Harris, William S. “The omega-3 index as a risk factor for coronary heart disease.” The American journal of clinical nutrition vol. 87,6 (2008): 1997S-2002S. doi:10.1093/ajcn/87.6.1997S
Harris, William S., Clemens von Schacky, and Yongsoon Park. "Standardizing methods for assessing omega-3 fatty acid biostatus." The Omega-3 fatty acid deficiency syndrome: opportunities for disease prevention. Nova Science Publishers, Inc., 2013. 385-398.
Harris, William S et al. “The Omega-3 Index and relative risk for coronary heart disease mortality: Estimation from 10 cohort studies.” Atherosclerosis vol. 262 (2017): 51-54. doi:10.1016/j.atherosclerosis.2017.05.007
Krupa, Kristina N., et al. “Omega-3 Fatty Acids.” StatPearls, StatPearls Publishing, 28 February 2024.
Ma, Mu-Yuan et al. “Omega-3 index and type 2 diabetes: Systematic review and meta-analysis.” Prostaglandins, leukotrienes, and essential fatty acids vol. 174 (2021): 102361. doi:10.1016/j.plefa.2021.102361
McBurney, Michael I et al. “Omega-3 index is directly associated with a healthy red blood cell distribution width.” Prostaglandins, leukotrienes, and essential fatty acids vol. 176 (2022): 102376. doi:10.1016/j.plefa.2021.102376
McBurney, Michael I et al. “The omega-3 index is inversely associated with the neutrophil-lymphocyte ratio in adults'.” Prostaglandins, leukotrienes, and essential fatty acids vol. 177 (2022): 102397. doi:10.1016/j.plefa.2022.102397
NIH Office of Dietary Supplements. Omega-3 Fatty Acids Fact Sheet for Health Professionals. Accessed February 26, 2026 from https://ods.od.nih.gov/factsheets/Omega3FattyAcids-HealthProfessional/#en29
Simopoulos, Artemis P. “Omega-3 fatty acids in inflammation and autoimmune diseases.” Journal of the American College of Nutrition vol. 21,6 (2002): 495-505. doi:10.1080/07315724.2002.10719248
Stanton, Alice V et al. “Omega-3 index and blood pressure responses to eating foods naturally enriched with omega-3 polyunsaturated fatty acids: a randomized controlled trial.” Scientific reports vol. 10,1 15444. 22 Sep. 2020, doi:10.1038/s41598-020-71801-5
Stoodley, Isobel et al. “Higher Omega-3 Index Is Associated with Better Asthma Control and Lower Medication Dose: A Cross-Sectional Study.” Nutrients vol. 12,1 74. 27 Dec. 2019, doi:10.3390/nu12010074
Superko, H Robert et al. “Omega-3 fatty acid blood levels: clinical significance and controversy.” Circulation vol. 128,19 (2013): 2154-61. doi:10.1161/CIRCULATIONAHA.113.002731
von Schacky, Clemens. “Omega-3 index and cardiovascular health.” Nutrients vol. 6,2 799-814. 21 Feb. 2014, doi:10.3390/nu6020799
von Schacky, C. “Verwirrung um die Wirkung von Omega-3-Fettsäuren : Betrachtung von Studiendaten unter Berücksichtigung des Omega-3-Index” [Confusion about the effects of omega-3 fatty acids : Contemplation of study data taking the omega-3 index into consideration]. Der Internist vol. 60,12 (2019): 1319-1327. doi:10.1007/s00108-019-00687-x
Start creating true practice success. An Optimal DX account will help you deliver insights into your patient’s health and generate intuitive, comprehensive Functional Health Reports and customer blood test-specific treatment plans.
Helicobacter pylori (H. pylori) is a spiral-shaped, Gram-negative bacterium that colonizes the human stomach. It is estimated to infect approximately half of the global population. Although many individuals with H. pylori infection remain asymptomatic, H. pylori infection plays a significant role in gastrointestinal health, with the potential to cause a range of diseases. Identifying and treating H. pylori infection can help reduce the risk of associated complications and promote overall gastrointestinal health.
Helicobacter pylori IgG
Helicobacter pylori is a harmful bacterium that infects the gastric mucosa, causing gastritis, gastric and duodenal ulcers, gastric carcinoma, and ulcerative esophagitis. It is also linked to metabolic syndrome, diabetes, and an elevated risk of cardiovascular disease. The presence of IgG antibodies in the blood signifies exposure and likely infection, making it the most commonly tested antibody for this bacterium.
OPTIMAL DX MEMBERS CLICK HERE for more information on Helicobacter pylori IgG
References
Chakrani, Zakaria et al. “Association Between ABO Blood Groups and Helicobacter pylori Infection: A Meta-Analysis.” Scientific reports vol. 8,1 17604. 4 Dec. 2018, doi:10.1038/s41598-018-36006-x
Chen, Tseng-Shing et al. “Immunoglobulin G antibody against Helicobacter pylori: clinical implications of levels found in serum.” Clinical and diagnostic laboratory immunology vol. 9,5 (2002): 1044-8. doi:10.1128/cdli.9.5.1044-1048.2002
Cheng, Kai-Pi et al. “Helicobacter pylori eradication improves glycemic control in type 2 diabetes patients with asymptomatic active Helicobacter pylori infection.” Journal of diabetes investigation vol. 10,4 (2019): 1092-1101. doi:10.1111/jdi.12991
Devrajani, Bikha Ram et al. “Type 2 diabetes mellitus: A risk factor for Helicobacter pylori infection: A hospital based case-control study.” International journal of diabetes in developing countries vol. 30,1 (2010): 22-6. doi:10.4103/0973-3930.60008
Khodaii, Zohreh et al. “Association of Helicobacter pylori infection with acute myocardial infarction.” Coronary artery disease vol. 22,1 (2011): 6-11. doi:10.1097/MCA.0b013e3283402360
Pagana, Kathleen Deska, et al. Mosby's Diagnostic and Laboratory Test Reference. 15th ed., Mosby, 2021.
Rogha, Mehran et al. “Is helicobacter pylori infection a risk factor for coronary heart disease?.” ARYA atherosclerosis vol. 8,1 (2012): 5-8.
Upala, Sikarin et al. “Association between Helicobacter pylori infection and metabolic syndrome: a systematic review and meta-analysis.” Journal of digestive diseases vol. 17,7 (2016): 433-40. doi:10.1111/1751-2980.12367
Vale, Filipa F, and Mónica Oleastro. “Overview of the phytomedicine approaches against Helicobacter pylori.” World journal of gastroenterology vol. 20,19 (2014): 5594-609. doi:10.3748/wjg.v20.i19.5594
Wang, Yao-Kuang et al. “Diagnosis of Helicobacter pylori infection: Current options and developments.” World journal of gastroenterology vol. 21,40 (2015): 11221-35. doi:10.3748/wjg.v21.i40.11221Note:
Zojaji, Homayon et al. “The effect of the treatment of Helicobacter pylori infection on the glycemic control in type 2 diabetes mellitus.” Gastroenterology and hepatology from bed to bench vol. 6,1 (2013): 36-40.
Hormones are essential signaling molecules produced by the endocrine system that regulate a wide range of physiological processes in the human body. They play a vital role in maintaining homeostasis, growth and development, metabolism, and reproduction. Male and female sex hormones, as well as dehydroepiandrosterone (DHEA), are particularly important for overall health and well-being. Male hormones, primarily testosterone, are produced by the testes and adrenal glands. They are crucial for the development of male reproductive organs, the onset of secondary sexual characteristics during puberty, and the maintenance of muscle mass, bone density, and libido. Female hormones, such as estrogen and progesterone, are produced by the ovaries and adrenal glands. Estrogen is responsible for the development of female reproductive organs, secondary sexual characteristics, and the regulation of the menstrual cycle. Progesterone is essential for the preparation and maintenance of the uterine lining for pregnancy and plays a role in the regulation of the menstrual cycle. DHEA, a hormone secreted by the adrenal glands, serves as a precursor for the synthesis of both male and female sex hormones. It is involved in various physiological processes, including immune function, bone density, and cardiovascular health. DHEA levels decline naturally with age, and research has suggested that DHEA supplementation may have potential benefits for specific health conditions, such as adrenal insufficiency and aging-related issues.
Aldosterone
Aldosterone, produced by the adrenal cortex, regulates sodium, potassium, and plasma volume in the body. Its secretion is controlled by various factors, including blood sodium and potassium levels, as well as the renin-angiotensin system. High serum aldosterone can be linked to low-sodium diets, hypertension, and various stressors, while low levels can result from high-sodium diets and Addison’s disease. Primary hyperaldosteronism, an adrenal disorder, is often a result of adrenal hyperplasia or tumors, and is associated with several cardiovascular and kidney risks. Testing, which can include a sodium challenge or an aldosterone-to-renin ratio, is essential for diagnosis, as untreated conditions can lead to serious health issues.
Note: These ranges are for an AM blood test sample (8:00 – 10:00 am), in an upright position, i.e., not supine.
OPTIMAL DX MEMBERS CLICK HERE for more information on Aldosterone
References
Craig, Micah, et al. “Biochemistry, Cholesterol.” StatPearls, StatPearls Publishing, 18 August 2021.
Dominguez, Alejandro, et al. “Hyperaldosteronism.” StatPearls, StatPearls Publishing, 12 February 2023.
Funder, John W et al. “The Management of Primary Aldosteronism: Case Detection, Diagnosis, and Treatment: An Endocrine Society Clinical Practice Guideline.” The Journal of clinical endocrinology and metabolism vol. 101,5 (2016): 1889-916. doi:10.1210/jc.2015-4061
Garg, Rajesh et al. “Low-salt diet increases insulin resistance in healthy subjects.” Metabolism: clinical and experimental vol. 60,7 (2011): 965-8. doi:10.1016/j.metabol.2010.09.005
Hannah-Shmouni, Fady, et al. “Testing for Endocrine Hypertension.” Endotext, edited by Kenneth R Feingold et. al., MDText.com, Inc., 30 December 2016.
Kesireddy, Veena et al. “The Association of Life's Simple 7 with Aldosterone among African Americans in the Jackson Heart Study.” Nutrients vol. 11,5 955. 26 Apr. 2019, doi:10.3390/nu11050955
Kubzansky, Laura D, and Gail K Adler. “Aldosterone: a forgotten mediator of the relationship between psychological stress and heart disease.” Neuroscience and biobehavioral reviews vol. 34,1 (2010): 80-6. doi:10.1016/j.neubiorev.2009.07.005
LabTestsOnline UK https://labtestsonline.org.uk/tests/aldosterone-and-renin.
Monticone, Silvia et al. “Cardiovascular events and target organ damage in primary aldosteronism compared with essential hypertension: a systematic review and meta-analysis.” The lancet. Diabetes & endocrinology vol. 6,1 (2018): 41-50. doi:10.1016/S2213-8587(17)30319-4
Pagana, Kathleen Deska, et al. Mosby's Diagnostic and Laboratory Test Reference. 15th ed., Mosby, 2021.
Pratt-Ubunama, Monique N et al. “Plasma aldosterone is related to severity of obstructive sleep apnea in subjects with resistant hypertension.” Chest vol. 131,2 (2007): 453-9. doi:10.1378/chest.06-1442
Shidlovskyi, Viktor O et al. “Topical Diagnosis and Determination of the Primary Hyperaldosteronism Variant.” Journal of medicine and life vol. 12,4 (2019): 322-328. doi:10.25122/jml-2019-0072
Tadros, Sherif F et al. “Higher serum aldosterone correlates with lower hearing thresholds: a possible protective hormone against presbycusis.” Hearing research vol. 209,1-2 (2005): 10-8. doi:10.1016/j.heares.2005.05.009
Wardle, Jon, and Jerome Sarris. Clinical naturopathy: an evidence-based guide to practice. Elsevier Health Sciences, 2019. 3rd edition
Yozamp, Nicholas et al. “Intraindividual Variability of Aldosterone Concentrations in Primary Aldosteronism: Implications for Case Detection.” Hypertension (Dallas, Tex. : 1979) vol. 77,3 (2021): 891-899. doi:10.1161/HYPERTENSIONAHA.120.16429
DHEA-S, Male, Female
DHEA-S is the active sulfated form of DHEA, a cholesterol-based steroid hormone that serves as a precursor to testosterone and estrogen. It has various functions, including immunomodulation, neurosteroid activity, support for bone, muscle, and skin, anti-inflammatory effects, and reduction of vascular tension. Levels peak between ages 15 and 39 and decrease thereafter. Decreased DHEA-S levels are associated with muscle and bone loss, atherosclerosis, immune decline, cognitive impairment, and mood imbalance.
Low levels may also be seen with critical illness, hyperglycemia, cardiovascular risk, and non-alcoholic fatty liver disease. High levels can be seen with adrenal carcinoma and PCOS.
OPTIMAL DX MEMBERS CLICK HERE for more information on DHEA-S
References
Bentley, Conor et al. “Dehydroepiandrosterone: a potential therapeutic agent in the treatment and rehabilitation of the traumatically injured patient.” Burns & trauma vol. 7 26. 2 Aug. 2019, doi:10.1186/s41038-019-0158-z
Brahimaj, Adela et al. “Serum dehydroepiandrosterone levels are associated with lower risk of type 2 diabetes: the Rotterdam Study.” Diabetologia vol. 60,1 (2017): 98-106. doi:10.1007/s00125-016-4136-8
Charlton, Michael et al. “Low circulating levels of dehydroepiandrosterone in histologically advanced nonalcoholic fatty liver disease.” Hepatology (Baltimore, Md.) vol. 47,2 (2008): 484-92. doi:10.1002/hep.22063
Dutheil, Frédéric et al. “DHEA as a Biomarker of Stress: A Systematic Review and Meta-Analysis.” Frontiers in psychiatry vol. 12 688367. 6 Jul. 2021, doi:10.3389/fpsyt.2021.688367
Karbowska, Joanna, and Zdzislaw Kochan. “Effects of DHEA on metabolic and endocrine functions of adipose tissue.” Hormone molecular biology and clinical investigation vol. 14,2 (2013): 65-74. doi:10.1515/hmbci-2013-0009
Kroboth, P D et al. “DHEA and DHEA-S: a review.” Journal of clinical pharmacology vol. 39,4 (1999): 327-48. doi:10.1177/00912709922007903
Lennartsson, Anna-Karin et al. “DHEA and DHEA-S response to acute psychosocial stress in healthy men and women.” Biological psychology vol. 90,2 (2012): 143-9. doi:10.1016/j.biopsycho.2012.03.003
Li, Yuanyuan et al. “A dose-response and meta-analysis of dehydroepiandrosterone (DHEA) supplementation on testosterone levels: perinatal prediction of randomized clinical trials.” Experimental gerontology vol. 141 (2020): 111110. doi:10.1016/j.exger.2020.111110
Pagana, Kathleen Deska, et al. Mosby's Diagnostic and Laboratory Test Reference. 15th ed., Mosby, 2021.
Rutkowski, Krzysztof et al. “Dehydroepiandrosterone (DHEA): hypes and hopes.” Drugs vol. 74,11 (2014): 1195-207. doi:10.1007/s40265-014-0259-8
Sachdeva, Silonie. “Hirsutism: evaluation and treatment.” Indian journal of dermatology vol. 55,1 (2010): 3-7. doi:10.4103/0019-5154.60342
Samaras, Nikolaos et al. “A review of age-related dehydroepiandrosterone decline and its association with well-known geriatric syndromes: is treatment beneficial?.” Rejuvenation research vol. 16,4 (2013): 285-94. doi:10.1089/rej.2013.1425
Yang, Song et al. “The Effect of Statins on Levels of Dehydroepiandrosterone (DHEA) in Women with Polycystic Ovary Syndrome: A Systematic Review and Meta-Analysis.” Medical science monitor : international medical journal of experimental and clinical research vol. 25 590-597. 20 Jan. 2019, doi:10.12659/MSM.914128
Estradiol, Male
Estradiol is the most potent form of circulating estrogen and affects both females and males. It supports bone integrity, growth hormone regulation, glucose metabolism, and sexual health, and alleviates vasomotor symptoms. Low estradiol levels in men may be associated with decreased libido, bone loss, and aging. Elevated levels in men may be linked to testicular tumors, sexual dysfunction, hypogonadism, and gynecomastia. Estradiol has a wide range of effects across tissues and plays a crucial role in regulating multiple physiological processes.
Ultrasensitive Estradiol
Standard Range: 0.00 - 29 pg/mL (0.00 - 106.46 pmol/L)
The ODX Range: 8 - 29 pg/mL (29.37 – 106.46 pmol/L)
OPTIMAL DX MEMBERS CLICK HERE for more information on Male Estradiol
References
Bhasin, Shalender et al. “Testosterone Therapy in Men With Hypogonadism: An Endocrine Society Clinical Practice Guideline.” The Journal of clinical endocrinology and metabolism vol. 103,5 (2018): 1715-1744. doi:10.1210/jc.2018-00229
Ketha, Hemamalini et al. “Estradiol assays--The path ahead.” Steroids vol. 99,Pt A (2015): 39-44. doi:10.1016/j.steroids.2014.08.009
MohanKumar, Sheba M J et al. “Chronic estradiol exposure - harmful effects on behavior, cardiovascular and reproductive functions.” Reproduction (Cambridge, England) vol. 156,5 (2018): R169-R186. doi:10.1530/REP-18-0116
Pagana, Kathleen Deska, et al. Mosby's Diagnostic and Laboratory Test Reference. 15th ed., Mosby, 2021.
Rosner, William et al. “Challenges to the measurement of estradiol: an endocrine society position statement.” The Journal of clinical endocrinology and metabolism vol. 98,4 (2013): 1376-87. doi:10.1210/jc.2012-3780
Russell, Nicholas et al. “Estradiol for the mitigation of adverse effects of androgen deprivation therapy.” Endocrine-related cancer vol. 24,8 (2017): R297-R313. doi:10.1530/ERC-17-0153
Russell, Nicholas, and Mathis Grossmann. “MECHANISMS IN ENDOCRINOLOGY: Estradiol as a male hormone.” European journal of endocrinology vol. 181,1 (2019): R23-R43. doi:10.1530/EJE-18-1000
Schulster, Michael et al. “The role of estradiol in male reproductive function.” Asian journal of andrology vol. 18,3 (2016): 435-40. doi:10.4103/1008-682X.173932
Estradiol, Female
Estradiol is the most potent form of circulating estrogen, affecting both females and males. It supports bone integrity, growth hormone regulation, glucose metabolism, and alleviates vasomotor symptoms. In women, low estradiol levels are associated with osteoporosis, menopause, inhibition of aromatase enzyme, amenorrhea, failing pregnancy, low pituitary function, and anorexia nervosa. High levels are linked to pregnancy, ovulation, post-menopausal breast cancer, estrogen-secreting tumors, adrenal tumors, hyperthyroidism, and liver cirrhosis and necrosis. Estradiol impacts multiple tissues and physiological processes in the body.
Standard Ranges (immunoassay)
Ultrasensitive Estradiol
OPTIMAL DX MEMBERS CLICK HERE for more information on Estradiol Female
References
Barakat, Radwa et al. “Extra-gonadal sites of estrogen biosynthesis and function.” BMB reports vol. 49,9 (2016): 488-96. doi:10.5483/bmbrep.2016.49.9.141
Hariri, Lana. and Anis Rehman. “Estradiol.” StatPearls, StatPearls Publishing, 13 February 2021. This book is distributed under the terms of the Creative Commons Attribution 4.0 International License.
Ketha, Hemamalini et al. “Estradiol assays--The path ahead.” Steroids vol. 99,Pt A (2015): 39-44. doi:10.1016/j.steroids.2014.08.009
Konishi K, Cherkerzian S, Jacobs EG, et al. Impact of adrenal hormones, reproductive aging, and major depression on memory circuitry decline in early midlife. Brain Res. 2019;1721:146303. doi:10.1016/j.brainres.2019.146303
MohanKumar, Sheba M J et al. “Chronic estradiol exposure - harmful effects on behavior, cardiovascular and reproductive functions.” Reproduction (Cambridge, England) vol. 156,5 (2018): R169-R186. doi:10.1530/REP-18-0116
Pagana, Kathleen Deska, et al. Mosby's Diagnostic and Laboratory Test Reference. 15th ed., Mosby, 2021.
Rosner, William et al. “Challenges to the measurement of estradiol: an endocrine society position statement.” The Journal of clinical endocrinology and metabolism vol. 98,4 (2013): 1376-87. doi:10.1210/jc.2012-3780
Stanczyk, Frank Z, and Nigel J Clarke. “Measurement of estradiol--challenges ahead.” The Journal of clinical endocrinology and metabolism vol. 99,1 (2014): 56-8. doi:10.1210/jc.2013-2905
Estradiol, Postmenopausal
Following menopause, there is a substantial decrease in circulating estradiol levels, leading to a loss of its protective effects on physiological functions, including cardiovascular health, bone density, and vasomotor stability. While low estradiol levels in postmenopausal women are linked to symptoms like hot flashes and an increased risk of conditions like osteoporosis and cardiovascular disease, elevated levels might heighten the risk for various cancers, particularly breast cancer. Estradiol's potential role in cognitive function has also been explored, with research suggesting its decline may correlate with mild cognitive impairments. Despite these findings, it is essential to approach hormone replacement therapy (HRT) with caution due to associated risks, such as heightened risks for breast and endometrial cancers.
Standard Range (Immunoassay): < or = 31 pg/mL (114 pmol/L) or below
OPTIMAL DX MEMBERS CLICK HERE for more information on Estradiol Postmenopause
References
Gholizadeh, Soheila et al. “The association between estradiol levels and cognitive function in postmenopausal women.” International journal of reproductive biomedicine vol. 16,7 (2018): 455-458.
Hariri, Lana. and Anis Rehman. “Estradiol.” StatPearls, StatPearls Publishing, 28 June 2023. This book is distributed under the terms of the Creative Commons Attribution-NonCommercial-NoDerivatives 4.0 International (CC BY-NC-ND 4.0) (http://creativecommons.org/licenses/by-nc-nd/4.0/ )
Honour, John W. “Biochemistry of the menopause.” Annals of clinical biochemistry vol. 55,1 (2018): 18-33. doi:10.1177/0004563217739930
Ketha, Hemamalini et al. “Estradiol assays--The path ahead.” Steroids vol. 99,Pt A (2015): 39-44. doi:10.1016/j.steroids.2014.08.009
Kim, Soo-Min et al. “Serum estradiol level according to dose and formulation of oral estrogens in postmenopausal women.” Scientific reports vol. 11,1 3585. 11 Feb. 2021, doi:10.1038/s41598-021-81201-y
Konishi K, Cherkerzian S, Jacobs EG, et al. Impact of adrenal hormones, reproductive aging, and major depression on memory circuitry decline in early midlife. Brain Res. 2019;1721:146303. doi:10.1016/j.brainres.2019.146303
Verdonk, Sara J E et al. “Estradiol reference intervals in women during the menstrual cycle, postmenopausal women and men using an LC-MS/MS method.” Clinica chimica acta; international journal of clinical chemistry vol. 495 (2019): 198-204. doi:10.1016/j.cca.2019.04.062
Zhang, Xuehong et al. “Postmenopausal plasma sex hormone levels and breast cancer risk over 20 years of follow-up.” Breast cancer research and treatment vol. 137,3 (2013): 883-92. doi:10.1007/s10549-012-2391-z
Testosterone, Total, Male
Testosterone is the predominant sex hormone in males, although it also affects females. It supports sexual health, red blood cell production, muscle integrity, and cardiometabolic health. Low levels are linked to hypogonadism, infertility, zinc deficiency, cirrhosis, anemia, low muscle mass, cardiometabolic disorders, visceral adiposity, rheumatoid arthritis, autoimmune disorders, osteoporosis, mood changes, loss of libido, hot flushes, migraines, and fatigue. Elevated levels are associated with hyperthyroidism, testosterone resistance, and certain tumors. Testosterone levels may decline with age, and significantly low or high levels should be investigated further. Maintaining optimal testosterone levels is essential for overall health and well-being.
OPTIMAL DX MEMBERS CLICK HERE for more information on Testosterone Total Male
References
Bain, Jerald. “The many faces of testosterone.” Clinical interventions in aging vol. 2,4 (2007): 567-76. doi:10.2147/cia.s1417
Basaria, Shehzad et al. “Adverse events associated with testosterone administration.” The New England journal of medicine vol. 363,2 (2010): 109-22. doi:10.1056/NEJMoa1000485
Clapauch, Ruth et al. “Laboratory diagnosis of late-onset male hypogonadism andropause.” Arquivos brasileiros de endocrinologia e metabologia vol. 52,9 (2008): 1430-8. doi:10.1590/s0004-27302008000900005
Collier, Christine P et al. “The significance of biological variation in the diagnosis of testosterone deficiency, and consideration of the relevance of total, free and bioavailable testosterone determinations.” The Journal of urology vol. 183,6 (2010): 2294-9. doi:10.1016/j.juro.2010.02.011
Deng, Chunhua et al. “Analysis of cardiovascular risk factors associated with serum testosterone levels according to the US 2011-2012 National Health and Nutrition Examination Survey.” The aging male : the official journal of the International Society for the Study of the Aging Male vol. 22,2 (2019): 121-128. doi:10.1080/13685538.2018.1479387
Dudek, Piotr et al. “Late-onset hypogonadism.” Przeglad menopauzalny = Menopause review vol. 16,2 (2017): 66-69. doi:10.5114/pm.2017.68595
Giagulli, Vito Angelo et al. “Critical evaluation of different available guidelines for late-onset hypogonadism.” Andrology vol. 8,6 (2020): 1628-1641. doi:10.1111/andr.12850
Gyawali, Prabin et al. “Higher Serum Sex Hormone-Binding Globulin Levels Are Associated With Incident Cardiovascular Disease in Men.” The Journal of clinical endocrinology and metabolism vol. 104,12 (2019): 6301-6315. doi:10.1210/jc.2019-01317
Hitsumoto, Takashi. “Clinical Significance of Low Blood Testosterone Concentration in Men as a Cardiovascular Risk Factor From the Perspective of Blood Rheology.” Cardiology research vol. 10,2 (2019): 106-113. doi:10.14740/cr858
Kurniawan, Adi-Lukas et al. “Association of Testosterone-Related Dietary Pattern with Testicular Function among Adult Men: A Cross-Sectional Health Screening Study in Taiwan.” Nutrients vol. 13,1 259. 18 Jan. 2021, doi:10.3390/nu13010259
Mulligan, T et al. “Prevalence of hypogonadism in males aged at least 45 years: the HIM study.” International journal of clinical practice vol. 60,7 (2006): 762-9. doi:10.1111/j.1742-1241.2006.00992.x
Nieschlag, E. “Late-onset hypogonadism: a concept comes of age.” Andrology vol. 8,6 (2020): 1506-1511. doi:10.1111/andr.12719
O'Reilly, Michael W et al. “Serum testosterone, sex hormone-binding globulin and sex-specific risk of incident type 2 diabetes in a retrospective primary care cohort.” Clinical endocrinology vol. 90,1 (2019): 145-154. doi:10.1111/cen.13862
Pagana, Kathleen Deska, et al. Mosby's Diagnostic and Laboratory Test Reference. 15th ed., Mosby, 2021.
Shea, Jennifer L et al. “Free testosterone: clinical utility and important analytical aspects of measurement.” Advances in clinical chemistry vol. 63 (2014): 59-84. doi:10.1016/b978-0-12-800094-6.00002-9
Shields, Lisa B E et al. “Testosterone levels in men with chronic migraine.” Neurology international vol. 11,2 8079. 19 Jun. 2019, doi:10.4081/ni.2019.8079
Swee, Du Soon, and Earn H Gan. “Late-Onset Hypogonadism as Primary Testicular Failure.” Frontiers in endocrinology vol. 10 372. 12 Jun. 2019, doi:10.3389/fendo.2019.00372
Yeap, Bu B. “Testosterone and its metabolites: differential associations with cardiovascular and cerebrovascular events in men.” Asian journal of andrology vol. 20,2 (2018): 109-114. doi:10.4103/aja.aja_50_17
Wrzosek, Michał et al. “The causes of adverse changes of testosterone levels in men.” Expert review of endocrinology & metabolism vol. 15,5 (2020): 355-362. doi:10.1080/17446651.2020.1813020
Yoshihisa, Akiomi et al. “Relation of Testosterone Levels to Mortality in Men With Heart Failure.” The American journal of cardiology vol. 121,11 (2018): 1321-1327. doi:10.1016/j.amjcard.2018.01.052
Zitzmann, Michael et al. “Association of specific symptoms and metabolic risks with serum testosterone in older men.” The Journal of clinical endocrinology and metabolism vol. 91,11 (2006): 4335-43. doi:10.1210/jc.2006-0401
Testosterone, Total, Female
Testosterone is an important hormone in both men and women, with women producing it in smaller amounts. It supports cardiometabolic health and cognitive function. Low testosterone levels in women may be linked to menopause, ovarian or adrenal insufficiency, and loss of libido, among other issues. High testosterone levels can lead to conditions such as polycystic ovary syndrome, amenorrhea, and hirsutism, as well as increasing the risk of type 2 diabetes, atrial fibrillation, and stroke. Both low and high levels of testosterone can have negative health impacts, making it important to maintain balanced levels for overall well-being.
OPTIMAL DX MEMBERS CLICK HERE for more information on Testosterone Total Female
References
Bain, Jerald. “The many faces of testosterone.” Clinical interventions in aging vol. 2,4 (2007): 567-76. doi:10.2147/cia.s1417
Bentley, Conor et al. “Dehydroepiandrosterone: a potential therapeutic agent in the treatment and rehabilitation of the traumatically injured patient.” Burns & trauma vol. 7 26. 2 Aug. 2019, doi:10.1186/s41038-019-0158-z
Davis, Susan R., and Sarah Wahlin-Jacobsen. "Testosterone in women—the clinical significance." The Lancet Diabetes & Endocrinology 3.12 (2015): 980-992.
Diamanti-Kandarakis, Evanthia et al. “Androgens associated with advanced glycation (end-products in postmenopausal women.” Menopause (New York, N.Y.) vol. 17,6 (2010): 1182-7. doi:10.1097/gme.0b013e3181e170af
Hogervorst, Eef et al. “Are optimal levels of testosterone associated with better cognitive function in healthy older women and men?.” Biochimica et biophysica acta vol. 1800,10 (2010): 1145-52. doi:10.1016/j.bbagen.2009.12.009
Li, Yuanyuan et al. “A dose-response and meta-analysis of dehydroepiandrosterone (DHEA) supplementation on testosterone levels: perinatal prediction of randomized clinical trials.” Experimental gerontology vol. 141 (2020): 111110. doi:10.1016/j.exger.2020.111110
O'Reilly, Michael W et al. “Serum testosterone, sex hormone-binding globulin and sex-specific risk of incident type 2 diabetes in a retrospective primary care cohort.” Clinical endocrinology vol. 90,1 (2019): 145-154. doi:10.1111/cen.13862
Pagana, Kathleen Deska, et al. Mosby's Diagnostic and Laboratory Test Reference. 15th ed., Mosby, 2021.
Shea, Jennifer L et al. “Free testosterone: clinical utility and important analytical aspects of measurement.” Advances in clinical chemistry vol. 63 (2014): 59-84. doi:10.1016/b978-0-12-800094-6.00002-9
Sowers, M F et al. “Testosterone concentrations in women aged 25-50 years: associations with lifestyle, body composition, and ovarian status.” American journal of epidemiology vol. 153,3 (2001): 256-64. doi:10.1093/aje/153.3.256
Zeller, Tanja et al. “Low testosterone levels are predictive for incident atrial fibrillation and ischaemic stroke in men, but protective in women - results from the FINRISK study.” European journal of preventive cardiology vol. 25,11 (2018): 1133-1139. doi:10.1177/2047487318778346
Zumoff, B et al. “Twenty-four-hour mean plasma testosterone concentration declines with age in normal premenopausal women.” The Journal of clinical endocrinology and metabolism vol. 80,4 (1995): 1429-30. doi:10.1210/jcem.80.4.7714119
Testosterone, Free, Male, Calculated
Free testosterone represents the active, unbound hormone in circulation, with levels dependent on production, clearance, and binding proteins like sex-hormone binding globulin. Low free testosterone can be linked to late-onset hypogonadism, high blood pressure, reduced muscle mass, anemia, diabetes, and inflammation. High free testosterone levels can occur as a result of testosterone therapy. It is important to assess free testosterone levels, as they may be more reliable for diagnostic purposes than total testosterone.
OPTIMAL DX MEMBERS CLICK HERE for more information on Testosterone Free Male Calculated
References
Bain, Jerald. “The many faces of testosterone.” Clinical interventions in aging vol. 2,4 (2007): 567-76. doi:10.2147/cia.s1417
Bayar, Göksel et al. “Low free and bioavailable testosterone levels may predict pathologically-proven high-risk prostate cancer: a prospective, clinical trial.” Turkish journal of urology vol. 43,3 (2017): 289-296. doi:10.5152/tud.2017.35467
Bhasin, Shalender et al. “Testosterone Therapy in Men With Hypogonadism: An Endocrine Society Clinical Practice Guideline.” The Journal of clinical endocrinology and metabolism vol. 103,5 (2018): 1715-1744. doi:10.1210/jc.2018-00229
Bhatia, Vishal et al. “Low testosterone and high C-reactive protein concentrations predict low hematocrit in type 2 diabetes.” Diabetes care vol. 29,10 (2006): 2289-94. doi:10.2337/dc06-0637
Davis, Susan R., and Sarah Wahlin-Jacobsen. "Testosterone in women—the clinical significance." The Lancet Diabetes & Endocrinology 3.12 (2015): 980-992.
Hoffman, M A et al. “Is low serum free testosterone a marker for high grade prostate cancer?.” The Journal of urology vol. 163,3 (2000): 824-7.
Hyde, Zoë et al. “Low free testosterone predicts mortality from cardiovascular disease but not other causes: the Health in Men Study.” The Journal of clinical endocrinology and metabolism vol. 97,1 (2012): 179-89. doi:10.1210/jc.2011-1617
Krasnoff, Joanne B et al. “Free testosterone levels are associated with mobility limitation and physical performance in community-dwelling men: the Framingham Offspring Study.” The Journal of clinical endocrinology and metabolism vol. 95,6 (2010): 2790-9. doi:10.1210/jc.2009-2680
Laaksonen, David E et al. “Testosterone and sex hormone-binding globulin predict the metabolic syndrome and diabetes in middle-aged men.” Diabetes care vol. 27,5 (2004): 1036-41. doi:10.2337/diacare.27.5.1036
Liu, Zhangshun et al. “Comparing calculated free testosterone with total testosterone for screening and diagnosing late-onset hypogonadism in aged males: A cross-sectional study.” Journal of clinical laboratory analysis vol. 31,5 (2017): e22073. doi:10.1002/jcla.22073
Lolck, Kristian Villars et al. “Compared to total serum testosterone, calculated free testosterone has a stronger association with lean mass, muscle strength, power, and physical function in older men.” Aging clinical and experimental research vol. 37,1 203. 28 Jun. 2025, doi:10.1007/s40520-025-03107-3
Rhoden, Ernani L et al. “Diabetes mellitus is associated with subnormal serum levels of free testosterone in men.” BJU international vol. 96,6 (2005): 867-70. doi:10.1111/j.1464-410X.2005.05728.x
Shea, Jennifer L et al. “Free testosterone: clinical utility and important analytical aspects of measurement.” Advances in clinical chemistry vol. 63 (2014): 59-84. doi:10.1016/b978-0-12-800094-6.00002-9
Yang, Qingtao et al. “Association of total testosterone, free testosterone, bioavailable testosterone, sex hormone-binding globulin, and hypertension.” Medicine vol. 98,20 (2019): e15628. doi:10.1097/MD.0000000000015628
Yuki, Atsumu et al. “Relationship between low free testosterone levels and loss of muscle mass.” Scientific reports vol. 3 (2013): 1818. doi:10.1038/srep01818
%Free Testosterone, Male
%Free testosterone (%FT) represents the portion of circulating testosterone that is unbound and active, compared to total testosterone. It is influenced by factors like SHBG, albumin levels, age, obesity, and alcohol consumption. Low %FT could indicate a lower level of unbound active testosterone, while high %FT might be linked to low SHBG, overproduction of endogenous testosterone, or excess supplemental testosterone. The relationship between %FT and the risk of high-grade prostate cancer is complex and may be influenced by lower total testosterone and SHBG levels.
OPTIMAL DX MEMBERS CLICK HERE for more information on Percent Free Testosterone Male
References
Albisinni, Simone et al. “Greater percent-free testosterone is associated with high-grade prostate cancer in men undergoing prostate biopsy.” Urology vol. 80,1 (2012): 162-7. doi:10.1016/j.urology.2012.01.068
Krakowsky, Yonah, and Ethan D Grober. “Testosterone Deficiency - Establishing A Biochemical Diagnosis.” EJIFCC vol. 26,2 105-13. 10 Mar. 2015
Lolck, Kristian Villars et al. “Compared to total serum testosterone, calculated free testosterone has a stronger association with lean mass, muscle strength, power, and physical function in older men.” Aging clinical and experimental research vol. 37,1 203. 28 Jun. 2025, doi:10.1007/s40520-025-03107-3
Testosterone, Free, Female, Calculated
Measuring free testosterone in women offers insights into the amount of active unbound testosterone in circulation, which can be influenced by factors like sex hormone binding globulin (SHBG), insulin resistance, and BMI. Higher free testosterone levels in women are linked to conditions like PCOS, hirsutism, virilization, abdominal adiposity, and increased severity of fatty liver disease. In contrast, lower levels are associated with reduced libido and sexual function. Free testosterone levels are used to assess androgen excess, PCOS, subfertility, and insulin resistance in women.
OPTIMAL DX MEMBERS CLICK HERE for more information on Testosterone Free Female Calculated
References
Antonio, L et al. “Free Testosterone Reflects Metabolic as well as Ovarian Disturbances in Subfertile Oligomenorrheic Women.” International journal of endocrinology vol. 2018 7956951. 10 Sep. 2018, doi:10.1155/2018/7956951
Davis, Susan R., and Sarah Wahlin-Jacobsen. "Testosterone in women—the clinical significance." The Lancet Diabetes & Endocrinology 3.12 (2015): 980-992.
Sarkar, Monika A et al. “Testosterone is Associated With Nonalcoholic Steatohepatitis and Fibrosis in Premenopausal Women With NAFLD.” Clinical gastroenterology and hepatology : the official clinical practice journal of the American Gastroenterological Association vol. 19,6 (2021): 1267-1274.e1. doi:10.1016/j.cgh.2020.09.045
Song, Do Kyeong et al. “Differentiation between polycystic ovary syndrome and polycystic ovarian morphology by means of an anti-Müllerian hormone cutoff value.” The Korean journal of internal medicine vol. 32,4 (2017): 690-698. doi:10.3904/kjim.2016.038
Sowers, M F et al. “Testosterone concentrations in women aged 25-50 years: associations with lifestyle, body composition, and ovarian status.” American journal of epidemiology vol. 153,3 (2001): 256-64. doi:10.1093/aje/153.3.256
Turna, B et al. “Women with low libido: correlation of decreased androgen levels with female sexual function index.” International journal of impotence research vol. 17,2 (2005): 148-53. doi:10.1038/sj.ijir.3901294
Testosterone, Bioavailable, Male
Bioavailable testosterone represents the portion of testosterone in circulation that is either free or loosely bound to albumin, making it readily available for use. A decrease in bioavailable testosterone is associated with conditions such as rheumatoid arthritis, hypertension, prostate cancer, and cognitive impairment. High levels of bioavailable testosterone may indicate overproduction or over-supplementation of testosterone, or low sex hormone binding globulin.
OPTIMAL DX MEMBERS CLICK HERE for more information on Testosterone Bioavailable Male
References
Bain, Jerald. “The many faces of testosterone.” Clinical interventions in aging vol. 2,4 (2007): 567-76. doi:10.2147/cia.s1417
Bayar, Göksel et al. “Low free and bioavailable testosterone levels may predict pathologically-proven high-risk prostate cancer: a prospective, clinical trial.” Turkish journal of urology vol. 43,3 (2017): 289-296. doi:10.5152/tud.2017.35467
Clapauch, Ruth et al. “Laboratory diagnosis of late-onset male hypogonadism andropause.” Arquivos brasileiros de endocrinologia e metabologia vol. 52,9 (2008): 1430-8. doi:10.1590/s0004-27302008000900005
García-Cruz, Eduardo et al. “Higher sex hormone-binding globulin and lower bioavailable testosterone are related to prostate cancer detection on prostate biopsy.” Scandinavian journal of urology vol. 47,4 (2013): 282-9. doi:10.3109/00365599.2012.747562
Kasturi, Sanjay S et al. “The metabolic syndrome and male infertility.” Journal of andrology vol. 29,3 (2008): 251-9. doi:10.2164/jandrol.107.003731
Yang, Qingtao et al. “Association of total testosterone, free testosterone, bioavailable testosterone, sex hormone-binding globulin, and hypertension.” Medicine vol. 98,20 (2019): e15628. doi:10.1097/MD.0000000000015628
Testosterone, Bioavailable, Female
Bioavailable testosterone represents the amount of circulating free testosterone along with that bound loosely to albumin, which can easily become available. In women, decreased bioavailable testosterone may be associated with atherosclerosis and cardiovascular disease risk, while increasing levels may be linked to non-alcoholic fatty liver disease. Extremely high levels can also be associated with cardiovascular disease, suggesting a complex relationship between bioavailable testosterone and various health conditions.
OPTIMAL DX MEMBERS CLICK HERE for more information on Testosterone Bioavailable Female
References
Davis, Susan R., and Sarah Wahlin-Jacobsen. "Testosterone in women—the clinical significance." The Lancet Diabetes & Endocrinology 3.12 (2015): 980-992.
Wang, Xu et al. “Associations between serum total, free and bioavailable testosterone and non-alcoholic fatty liver disease in community-dwelling middle-aged and elderly women.” Diabetes & metabolism vol. 47,3 (2021): 101199. doi:10.1016/j.diabet.2020.09.007
Gastrin, Fasting
OPTIMAL DX MEMBERS CLICK HERE for more information on Gastrin
References
Chao, Celia, and Mark R Hellmich. “Gastrin, inflammation, and carcinogenesis.” Current opinion in endocrinology, diabetes, and obesity vol. 17,1 (2010): 33-9. doi:10.1097/MED.0b013e328333faf8
Fatima, Rawish. and Muhammad Aziz. “Achlorhydria.” StatPearls, StatPearls Publishing, 25 July 2021.
Fourmy, Daniel et al. “Gastrin in gastrointestinal diseases.” Gastroenterology vol. 141,3 (2011): 814-818.e1-3. doi:10.1053/j.gastro.2011.07.006
Lundell, L et al. “Systematic review: the effects of long-term proton pump inhibitor use on serum gastrin levels and gastric histology.” Alimentary pharmacology & therapeutics vol. 42,6 (2015): 649-63. doi:10.1111/apt.13324
Pagana, Kathleen Deska, et al. Mosby's Diagnostic and Laboratory Test Reference. 15th ed., Mosby, 2021.
Prosapio, Jordon G., et al. “Physiology, Gastrin.” StatPearls, StatPearls Publishing, 6 March 2021.
Rehfeld, Jens F et al. “The Zollinger-Ellison syndrome and mismeasurement of gastrin.” Gastroenterology vol. 140,5 (2011): 1444-53. doi:10.1053/j.gastro.2011.01.051
Leptin, Male, Female
OPTIMAL DX MEMBERS CLICK HERE for more information on Leptin
References
Cundrle, Ivan Jr et al. “Low leptin concentration may identify heart failure patients with central sleep apnea.” Journal of sleep research vol. 27,2 (2018): 240-243. doi:10.1111/jsr.12574
Dudek, Piotr et al. “The effects of testosterone replacement therapy in men with age-dependent hypogonadism on body composition, and serum levels of leptin, adiponectin, and C-reactive protein.” Endokrynologia Polska vol. 71,5 (2020): 382-387. doi:10.5603/EP.a2020.0048
Esteghamati, Alireza et al. “Leptin cut-off values for determination of metabolic syndrome: third national surveillance of risk factors of non-communicable diseases in Iran (SuRFNCD-2007).” Endocrine vol. 40,1 (2011): 117-23. doi:10.1007/s12020-011-9447-4
Ghadge, Abhijit A, and Amrita A Khaire. “Leptin as a predictive marker for metabolic syndrome.” Cytokine vol. 121 (2019): 154735. doi:10.1016/j.cyto.2019.154735
Gropper, Sareen S.; Smith, Jack L.; Carr, Timothy P. Advanced Nutrition and Human Metabolism. 8th edition. Wadsworth Publishing Co Inc. 2021.
Guimaraes, Maria Fernanda Brandão de Resende et al. “Leptin as an obesity marker in rheumatoid arthritis.” Rheumatology international vol. 38,9 (2018): 1671-1677. doi:10.1007/s00296-018-4082-5
Hribal, Marta Letizia et al. “Role of C reactive protein (CRP) in leptin resistance.” Current pharmaceutical design vol. 20,4 (2014): 609-15. doi:10.2174/13816128113199990016
Izquierdo, Andrea G et al. “Leptin, Obesity, and Leptin Resistance: Where Are We 25 Years Later?.” Nutrients vol. 11,11 2704. 8 Nov. 2019, doi:10.3390/nu11112704
Lloyd, R V et al. “Leptin and leptin receptor in anterior pituitary function.” Pituitary vol. 4,1-2 (2001): 33-47. doi:10.1023/a:1012982626401
Perez-Perez, Antonio et al. “Role of Leptin in Inflammation and Vice Versa.” International journal of molecular sciences vol. 21,16 5887. 16 Aug. 2020, doi:10.3390/ijms21165887
Procaccini, Claudio et al. “Leptin as an immunomodulator.” Molecular aspects of medicine vol. 33,1 (2012): 35-45. doi:10.1016/j.mam.2011.10.012
Puurunen, Veli-Pekka et al. “Leptin predicts short-term major adverse cardiac events in patients with coronary artery disease.” Annals of medicine vol. 49,5 (2017): 448-454. doi:10.1080/07853890.2017.1301678
Roubos, Eric W et al. “Leptin and the hypothalamo-pituitary-adrenal stress axis.” General and comparative endocrinology vol. 177,1 (2012): 28-36. doi:10.1016/j.ygcen.2012.01.009
Progesterone, Male
References
Jiang, Jingjing et al. “The effect of progesterone and pregnenolone on diabetes status in Chinese rural population: a dose-response analysis from Henan Rural Cohort.” European journal of endocrinology vol. 181,6 (2019): 603-614. doi:10.1530/EJE-19-0352
Oettel, M, and A K Mukhopadhyay. “Progesterone: the forgotten hormone in men?.” The aging male : the official journal of the International Society for the Study of the Aging Male vol. 7,3 (2004): 236-57. doi:10.1080/13685530400004199
Ohlsson, Claes et al. “Low Progesterone and Low Estradiol Levels Associate With Abdominal Aortic Aneurysms in Men.” The Journal of clinical endocrinology and metabolism vol. 107,4 (2022): e1413-e1425. doi:10.1210/clinem/dgab867
Pagana, Kathleen Deska, et al. Mosby's Diagnostic and Laboratory Test Reference. 15th ed., Mosby, 2021.
Taraborrelli, Stefania. “Physiology, production and action of progesterone.” Acta obstetricia et gynecologica Scandinavica vol. 94 Suppl 161 (2015): 8-16. doi:10.1111/aogs.12771
Progesterone, Female
Standard Ranges (Immunoassay)
Pregnancy
OPTIMAL DX MEMBERS CLICK HERE for more information on Progesterone, Female
References
Hughes, Grant C. “Progesterone and autoimmune disease.” Autoimmunity reviews vol. 11,6-7 (2012): A502-14. doi:10.1016/j.autrev.2011.12.003
Pagana, Kathleen Deska, et al. Mosby's Diagnostic and Laboratory Test Reference. 15th ed., Mosby, 2021.
Piette, P. “The history of natural progesterone, the never-ending story.” Climacteric : the journal of the International Menopause Society vol. 21,4 (2018): 308-314. doi:10.1080/13697137.2018.1462792
Quest Progesterone Immunoassay Ranges.
Regidor, P-A. “Progesterone in Peri- and Postmenopause: A Review.” Geburtshilfe und Frauenheilkunde vol. 74,11 (2014): 995-1002. doi:10.1055/s-0034-1383297
Taraborrelli, Stefania. “Physiology, production and action of progesterone.” Acta obstetricia et gynecologica Scandinavica vol. 94 Suppl 161 (2015): 8-16. doi:10.1111/aogs.12771
Unfer, Vittorio et al. “Different routes of progesterone administration and polycystic ovary syndrome: a review of the literature.” Gynecological endocrinology : the official journal of the International Society of Gynecological Endocrinology vol. 21,2 (2005): 119-27. doi:10.1080/09513590500170049
Young, Steven L, and Bruce A Lessey. “Progesterone function in human endometrium: clinical perspectives.” Seminars in reproductive medicine vol. 28,1 (2010): 5-16. doi:10.1055/s-0029-1242988
Progesterone, Postmenopausal
Standard Ranges:
OPTIMAL DX MEMBERS CLICK HERE for more information on Progesterone, Postmenopausal
References
Berent-Spillson, Alison et al. “Distinct cognitive effects of estrogen and progesterone in menopausal women.” Psychoneuroendocrinology vol. 59 (2015): 25-36. doi:10.1016/j.psyneuen.2015.04.020
Du, Joanna Y et al. “Percutaneous progesterone delivery via cream or gel application in postmenopausal women: a randomized cross-over study of progesterone levels in serum, whole blood, saliva, and capillary blood.” Menopause (New York, N.Y.) vol. 20,11 (2013): 1169-75. doi:10.1097/GME.0b013e31828d39a2
Genazzani, Andrea R et al. “Hormone therapy in the postmenopausal years: considering benefits and risks in clinical practice.” Human reproduction update vol. 27,6 (2021): 1115-1150. doi:10.1093/humupd/dmab026
Gompel, A. “Progesterone, progestins and the endometrium in perimenopause and in menopausal hormone therapy.” Climacteric : the journal of the International Menopause Society vol. 21,4 (2018): 321-325. doi:10.1080/13697137.2018.1446932
Henderson, Victor W et al. “Cognition, mood, and physiological concentrations of sex hormones in the early and late postmenopause.” Proceedings of the National Academy of Sciences of the United States of America vol. 110,50 (2013): 20290-5. doi:10.1073/pnas.1312353110
Henderson, V W. “Progesterone and human cognition.” Climacteric : the journal of the International Menopause Society vol. 21,4 (2018): 333-340. doi:10.1080/13697137.2018.1476484
Hitchcock, Christine L, and Jerilynn C Prior. “Oral micronized progesterone for vasomotor symptoms--a placebo-controlled randomized trial in healthy postmenopausal women.” Menopause (New York, N.Y.) vol. 19,8 (2012): 886-93. doi:10.1097/gme.0b013e318247f07a
Jiang, Jingjing et al. “The effect of progesterone and pregnenolone on diabetes status in Chinese rural population: a dose-response analysis from Henan Rural Cohort.” European journal of endocrinology vol. 181,6 (2019): 603-614. doi:10.1530/EJE-19-0352
Matsuoka, Ayumu et al. “Elevated serum progesterone levels in postmenopausal women with mucinous ovarian tumors.” Menopause (New York, N.Y.) vol. 23,5 (2016): 544-9. doi:10.1097/GME.0000000000000587
Missmer, Stacey A et al. “Endogenous estrogen, androgen, and progesterone concentrations and breast cancer risk among postmenopausal women.” Journal of the National Cancer Institute vol. 96,24 (2004): 1856-65. doi:10.1093/jnci/djh336
Pe’er, Eitan. "Progestogens and the Menopause." Progestogens in Obstetrics and Gynecology (2021): 193-202.
Prior, J C. “Progesterone for Symptomatic Perimenopause Treatment - Progesterone politics, physiology and potential for perimenopause.” Facts, views & vision in ObGyn vol. 3,2 (2011): 109-20.
Regidor, P-A. “Progesterone in Peri- and Postmenopause: A Review.” Geburtshilfe und Frauenheilkunde vol. 74,11 (2014): 995-1002. doi:10.1055/s-0034-1383297
Taraborrelli, Stefania. “Physiology, production and action of progesterone.” Acta obstetricia et gynecologica Scandinavica vol. 94 Suppl 161 (2015): 8-16. doi:10.1111/aogs.12771
Unfer, T C et al. “Estrogen plus progestin increase superoxide dismutase and total antioxidant capacity in postmenopausal women.” Climacteric : the journal of the International Menopause Society vol. 18,3 (2015): 379-88. doi:10.3109/13697137.2014.964669
Weinland, Christian et al. “Progesterone serum levels correlate negatively with craving in female postmenopausal in-patients with alcohol use disorder: A sex- and menopausal status-separated study.” Progress in neuro-psychopharmacology & biological psychiatry vol. 110 (2021): 110278. doi:10.1016/j.pnpbp.2021.110278
Wong, Jorge A et al. “Menopausal age, postmenopausal hormone therapy and incident atrial fibrillation.” Heart (British Cardiac Society) vol. 103,24 (2017): 1954-1961. doi:10.1136/heartjnl-2016-311002
Prolactin Male, Female
Prolactin is a hormone primarily produced in the pituitary gland, playing a crucial role in lactation and breast development, among other functions. Low levels of prolactin can result from pituitary issues, certain medications, and conditions like sarcoidosis or hemochromatosis, and are linked with sexual dysfunction and metabolic syndrome in men. High prolactin levels may occur due to stress, various health conditions, or medication use, and are associated with infertility, headaches, reduced libido, and potential cardiovascular risks. Elevated prolactin is particularly significant in conditions like hypothyroidism and renal failure, affecting hormone balance and increasing the risk of cardiovascular diseases.
OPTIMAL DX MEMBERS CLICK HERE for more information on Prolactin
References
Al-Chalabi, Mustafa, et al. “Physiology, Prolactin.” StatPearls, StatPearls Publishing, 29 July 2021.
Carrero, Juan Jesús et al. “Prolactin levels, endothelial dysfunction, and the risk of cardiovascular events and mortality in patients with CKD.” Clinical journal of the American Society of Nephrology : CJASN vol. 7,2 (2012): 207-15. doi:10.2215/CJN.06840711
Corona, Giovanni et al. “Hypoprolactinemia: a new clinical syndrome in patients with sexual dysfunction.” The journal of sexual medicine vol. 6,5 (2009): 1457-66. doi:10.1111/j.1743-6109.2008.01206.x
Dourado, Marclébio et al. “Relationship between Prolactin, Chronic Kidney Disease, and Cardiovascular Risk.” International journal of endocrinology vol. 2020 9524839. 22 Jun. 2020, doi:10.1155/2020/9524839
Goel, Parul et al. “Evaluation of serum prolactin level in patients of subclinical and overt hypothyroidism.” Journal of clinical and diagnostic research : JCDR vol. 9,1 (2015): BC15-7. doi:10.7860/JCDR/2015/9982.5443
Pagana, Kathleen Deska, et al. Mosby's Diagnostic and Laboratory Test Reference. 15th ed., Mosby, 2021.
Zhang, Luxia et al. “Plasma prolactin level and risk of incident hypertension in postmenopausal women.” Journal of hypertension vol. 28,7 (2010): 1400-5. doi:10.1097/HJH.0b013e328339f254
Sex Hormone Binding Globulin (SHBG)
Male: 10 - 50 nmol/L
Female: 17 - 124 nmol/L
Male: 40 - 46 nmol/L
Female: 50 - 80 nmol/L
References
Bhasin, Shalender et al. “Sex hormone-binding globulin, but not testosterone, is associated prospectively and independently with incident metabolic syndrome in men: the framingham heart study.” Diabetes care vol. 34,11 (2011): 2464-70. doi:10.2337/dc11-0888
Davis, Susan R., and Sarah Wahlin-Jacobsen. "Testosterone in women—the clinical significance." The Lancet Diabetes & Endocrinology 3.12 (2015): 980-992.
García-Cruz, Eduardo et al. “Higher sex hormone-binding globulin and lower bioavailable testosterone are related to prostate cancer detection on prostate biopsy.” Scandinavian journal of urology vol. 47,4 (2013): 282-9. doi:10.3109/00365599.2012.747562
Goldstajn, Marina Šprem et al. “Sex Hormone Binding Globulin (SHBG) as a Marker of Clinical Disorders.” Collegium antropologicum vol. 40,3 (2016): 211-8.
Gyawali, Prabin et al. “Higher Serum Sex Hormone-Binding Globulin Levels Are Associated With Incident Cardiovascular Disease in Men.” The Journal of clinical endocrinology and metabolism vol. 104,12 (2019): 6301-6315. doi:10.1210/jc.2019-01317
Liang, Guoqing et al. “Serum sex hormone-binding globulin is associated with symptomatic late-onset hypogonadism in aging rural males: a community-based study.” Sexual health vol. 18,2 (2021): 156-161. doi:10.1071/SH20201
O'Reilly, Michael W et al. “Serum testosterone, sex hormone-binding globulin and sex-specific risk of incident type 2 diabetes in a retrospective primary care cohort.” Clinical endocrinology vol. 90,1 (2019): 145-154. doi:10.1111/cen.13862
Ramachandran, S et al. “The association of sex hormone-binding globulin with mortality is mediated by age and testosterone in men with type 2 diabetes.” Andrology vol. 6,6 (2018): 846-853. doi:10.1111/andr.12520
Simons, Pomme I H G et al. “Sex hormone-binding globulin: biomarker and hepatokine?.” Trends in endocrinology and metabolism: TEM vol. 32,8 (2021): 544-553. doi:10.1016/j.tem.2021.05.002
Thaler, Markus A et al. “The biomarker sex hormone-binding globulin - from established applications to emerging trends in clinical medicine.” Best practice & research. Clinical endocrinology & metabolism vol. 29,5 (2015): 749-60. doi:10.1016/j.beem.2015.06.005
Wallace, Ian R et al. “Sex hormone binding globulin and insulin resistance.” Clinical endocrinology vol. 78,3 (2013): 321-9. doi:10.1111/cen.12086
Wang, Yutang. “Definition, Prevalence, and Risk Factors of Low Sex Hormone-Binding Globulin in US Adults.” The Journal of clinical endocrinology and metabolism vol. 106,10 (2021): e3946-e3956. doi:10.1210/clinem/dgab416
Weinberg, Melissa E et al. “Low sex hormone-binding globulin is associated with the metabolic syndrome in postmenopausal women.” Metabolism: clinical and experimental vol. 55,11 (2006): 1473-80. doi:10.1016/j.metabol.2006.06.017
Cortisol, Total/AM, Serum
Cortisol is a steroid hormone produced in the adrenal gland that regulates metabolism, immune function, inflammation, and stress response throughout the body. It follows a diurnal pattern, peaking in the morning and declining throughout the day. Low cortisol levels can lead to fatigue, exhaustion, and low blood pressure, and may be associated with various medical conditions or medications. High cortisol levels can result from stress, certain medications, or health issues, and can lead to increased blood glucose, blood pressure, muscle breakdown, brain volume loss, and micronutrient depletion. Prolonged stress may cause a hypocortisolemic state, affecting cortisol production and overall health.
OPTIMAL DX MEMBERS CLICK HERE for more information on Cortisol Total AM
References
Alufer, Liav et al. “Long-term green-Mediterranean diet may favor fasting morning cortisol stress hormone; the DIRECT-PLUS clinical trial.” Frontiers in endocrinology vol. 14 1243910. 14 Nov. 2023, doi:10.3389/fendo.2023.
Bayes, Adam et al. “The biology of burnout: Causes and consequences.” The world journal of biological psychiatry : the official journal of the World Federation of Societies of Biological Psychiatry vol. 22,9 (2021): 686-698. doi:10.1080/15622975.2021.1907713
Cano-López, Irene, and Esperanza González-Bono. “Cortisol levels and seizures in adults with epilepsy: A systematic review.” Neuroscience and biobehavioral reviews vol. 103 (2019): 216-229. doi:10.1016/j.neubiorev.2019.05.023
Echouffo-Tcheugui, Justin B et al. “Circulating cortisol and cognitive and structural brain measures: The Framingham Heart Study.” Neurology vol. 91,21 (2018): e1961-e1970. doi:10.1212/WNL.0000000000006549
Kamba, Aya et al. “Association between Higher Serum Cortisol Levels and Decreased Insulin Secretion in a General Population.” PloS one vol. 11,11 e0166077. 18 Nov. 2016, doi:10.1371/journal.pone.0166077
Kazlauskaite, Rasa et al. “Corticotropin tests for hypothalamic-pituitary- adrenal insufficiency: a metaanalysis.” The Journal of clinical endocrinology and metabolism vol. 93,11 (2008): 4245-53. doi:10.1210/jc.2008-0710
Marcos-Perez, Diego et al. “Serum cortisol but not oxidative stress biomarkers are related to frailty: results of a cross-sectional study in Spanish older adults.” Journal of toxicology and environmental health. Part A vol. 82,14 (2019): 815-825. doi:10.1080/15287394.2019.1654639
Ortiz, Robin et al. “The association of morning serum cortisol with glucose metabolism and diabetes: The Jackson Heart Study.” Psychoneuroendocrinology vol. 103 (2019): 25-32. doi:10.1016/j.psyneuen.2018.12.237
Pagana, Kathleen Deska; Pagana, Timothy J.; Pagana, Theresa N. Mosby's Diagnostic and Laboratory Test Reference. Elsevier Health Sciences. 2019.
Singh, K. "Nutrient and stress management." J Nutr Food Sci 6.4 (2016): 528.
Thau, Lauren, et al. “Physiology, Cortisol.” StatPearls, StatPearls Publishing, 6 September 2021.
Wardle, Jon, and Jerome Sarris. Clinical naturopathy: an evidence-based guide to practice. Elsevier Health Sciences, 2019. 3rd edition.
Cortisol, PM, Serum
Cortisol, a regulatory steroid hormone produced in the adrenal gland, impacts various bodily functions, especially during the stress response. It follows a diurnal pattern, peaking in the morning and declining throughout the day. Prolonged elevated cortisol can lead to increased blood glucose, blood pressure, muscle breakdown, brain volume loss, and micronutrient depletion, while persistently low cortisol can result in fatigue, exhaustion, and low blood pressure. High and low cortisol levels are associated with different medical conditions and medications, with high levels linked to Cushing syndrome, obesity, and emotional stress, and low levels linked to Addison's disease, hypothyroidism, and liver disease.
OPTIMAL DX MEMBERS CLICK HERE for more information on Cortisol, PM
References
Al-Safi, Zain A et al. “Evidence for disruption of normal circadian cortisol rhythm in women with obesity.” Gynecological endocrinology: the official journal of the International Society of Gynecological Endocrinology vol. 34,4 (2018): 336-340. doi:10.1080/09513590.2017.1393511
Agarwal, Abhishek et al. “Evaluation and correlation of stress scores with blood pressure, endogenous cortisol levels, and homocysteine levels in patients with central serous chorioretinopathy and comparison with age-matched controls.” Indian journal of ophthalmology vol. 64,11 (2016): 803-805. doi:10.4103/0301-4738.195591
Kamba, Aya et al. “Association between Higher Serum Cortisol Levels and Decreased Insulin Secretion in a General Population.” PloS one vol. 11,11 e0166077. 18 Nov. 2016, doi:10.1371/journal.pone.0166077
Katsu, Yoshinao, and Michael E. Baker. "Cortisol." Handbook of hormones. Academic Press, 2021. 947-949.
Kiałka, Marta et al. “Evening not morning plasma cortisol level is higher in women with polycystic ovary syndrome.” Przeglad lekarski vol. 72,5 (2015): 240-2. Kazlauskaite, Rasa et al. “Corticotropin tests for hypothalamic-pituitary- adrenal insufficiency: a metaanalysis.” The Journal of clinical endocrinology and metabolism vol. 93,11 (2008): 4245-53. doi:10.1210/jc.2008-0710
Pagana, Kathleen Deska, et al. Mosby's Diagnostic and Laboratory Test Reference. 15th ed., Mosby, 2021.
Plat, L et al. “Metabolic effects of short-term elevations of plasma cortisol are more pronounced in the evening than in the morning.” The Journal of clinical endocrinology and metabolism vol. 84,9 (1999): 3082-92. doi:10.1210/jcem.84.9.5978Walter, Kimberly N et al. “Elevated thyroid stimulating hormone is associated with elevated cortisol in healthy young men and women.” Thyroid research vol. 5,1 13. 30 Oct. 2012, doi:10.1186/1756-6614-5-13
Wardle, Jon, and Jerome Sarris. Clinical naturopathy: an evidence-based guide to practice. Elsevier Health Sciences, 2019. 3rd edition.
Cortisol:DHEA-S Ratio
Cortisol and DHEA are hormones produced by the adrenal glands, and they both affect immunity, stress resilience, brain function, and behavior. Evaluating the ratio between cortisol and DHEA-S can offer insight into the risk of infection, cognitive dysfunction, and metabolic health. A higher cortisol to DHEA-S ratio is linked to stress, metabolic syndrome, immune dysfunction, and all-cause mortality, while a decreased ratio is associated with behavioral disorders and antisocial behavior. The cortisol:DHEA-S ratio can be influenced by stress, aging, and illness, with higher ratios seen in metabolic syndrome and lower ratios connected to conduct disorders and aggression in adolescents.
References
Butcher, Stephen K et al. “Raised cortisol:DHEAS ratios in the elderly after injury: potential impact upon neutrophil function and immunity.” Aging cell vol. 4,6 (2005): 319-24. doi:10.1111/j.1474-9726.2005.00178.x
Chehab, Olfa et al. “Hormonal status of cortisol and dehydroepiandrosterone sulfate in an elderly Tunisian population.” Comptes rendus biologies vol. 330,10 (2007): 755-63. doi:10.1016/j.crvi.2007.08.004
Heaney, Jennifer L J et al. “Physical activity, life events stress, cortisol, and DHEA: preliminary findings that physical activity may buffer against the negative effects of stress.” Journal of aging and physical activity vol. 22,4 (2014): 465-73. doi:10.1123/japa.2012-0082
Kamin, Hayley S, and Darlene A Kertes. “Cortisol and DHEA in development and psychopathology.” Hormones and behavior vol. 89 (2017): 69-85. doi:10.1016/j.yhbeh.2016.11.018
Khanfer, Riyad et al. “Neutrophil function and cortisol:DHEAS ratio in bereaved older adults.” Brain, behavior, and immunity vol. 25,6 (2011): 1182-6. doi:10.1016/j.bbi.2011.03.008
Phillips, Anna C et al. “Cortisol, DHEAS, their ratio and the metabolic syndrome: evidence from the Vietnam Experience Study.” European journal of endocrinology vol. 162,5 (2010): 919-23. doi:10.1530/EJE-09-1078
Phillips, Anna C et al. “Cortisol, DHEA sulphate, their ratio, and all-cause and cause-specific mortality in the Vietnam Experience Study.” European journal of endocrinology vol. 163,2 (2010): 285-92. doi:10.1530/EJE-10-0299
Ritsner, Michael et al. “Cortisol/dehydroepiandrosterone ratio and responses to antipsychotic treatment in schizophrenia.” Neuropsychopharmacology : official publication of the American College of Neuropsychopharmacology vol. 30,10 (2005): 1913-22. doi:10.1038/sj.npp.1300747
Yanagita, Ikumi et al. “A High Serum Cortisol/DHEA-S Ratio Is a Risk Factor for Sarcopenia in Elderly Diabetic Patients.” Journal of the Endocrine Society vol. 3,4 801-813. 5 Mar. 2019, doi:10.1210/js.2018-00271
Luteinizing Hormone (LH), Male
Luteinizing hormone (LH) is a glycoprotein originating from the anterior pituitary, playing a crucial role in germ cell maturation and the regulation of testosterone in men. It functions alongside follicle-stimulating hormone. In men, LH stimulates testosterone production in the testes, which, when elevated, inhibits further LH release. Low LH levels can result from malnutrition, stress, or issues with the pituitary or hypothalamus. Elevated LH levels can be indicative of conditions like pituitary adenoma, hypogonadism, and cardiovascular disease.
OPTIMAL DX MEMBERS CLICK HERE for more information on Luteinizing Hormone Male
References
Hohl, Alexandre et al. “Luteinizing Hormone and Testosterone Levels during Acute Phase of Severe Traumatic Brain Injury: Prognostic Implications for Adult Male Patients.” Frontiers in endocrinology vol. 9 29. 13 Feb. 2018, doi:10.3389/fendo.2018.00029
Nedresky, Daniel. and Gurdeep Singh. “Physiology, Luteinizing Hormone.” StatPearls, StatPearls Publishing, 28 September 2021.
Pagana, Kathleen Deska, et al. Mosby's Diagnostic and Laboratory Test Reference. 15th ed., Mosby, 2021.
Qu, Mengyuan et al. “Association of Serum Testosterone and Luteinizing Hormone With Blood Pressure and Risk of Cardiovascular Disease in Middle-Aged and Elderly Men.” Journal of the American Heart Association vol. 10,7 (2021): e019559. doi:10.1161/JAHA.120.019559
Luteinizing Hormone (LH), Female
Luteinizing hormone (LH) is a pituitary hormone that plays a critical role in the production and regulation of estrogen, ovulation, and fertility in women. Low LH levels can be caused by stress, malnutrition, pituitary or hypothalamus failure, or certain medications, while high levels may be associated with menopause, polycystic ovaries, Turner Syndrome, and pituitary adenoma. LH surges in the blood about 24 hours before ovulation, indicating maximum fertility. Elevated blood LH levels may be linked to lower brain LH levels, potentially contributing to cognitive impairment.
Standard Ranges (Immunoassay)
OPTIMAL DX MEMBERS CLICK HERE for more information on Luteinizing Hormone Female
References
Blair, Jeffrey A et al. “Luteinizing hormone: Evidence for direct action in the CNS.” Hormones and behavior vol. 76 (2015): 57-62. doi:10.1016/j.yhbeh.2015.06.020
Bohm-Levine, Nathaniel et al. “Reducing luteinizing hormone levels after ovariectomy improves spatial memory: Possible role of brain-derived neurotrophic factor.” Hormones and behavior vol. 118 (2020): 104590. doi:10.1016/j.yhbeh.2019.104590
Direito, Ana et al. “Relationships between the luteinizing hormone surge and other characteristics of the menstrual cycle in normally ovulating women.” Fertility and sterility vol. 99,1 (2013): 279-285.e3. doi:10.1016/j.fertnstert.2012.08.047
Lai, Wanlin et al. “Plasma luteinizing hormone level affects the brain activity of patients with polycystic ovary syndrome.” Psychoneuroendocrinology vol. 112 (2020): 104535. doi:10.1016/j.psyneuen.2019.104535
Nedresky, Daniel. and Gurdeep Singh. “Physiology, Luteinizing Hormone.” StatPearls, StatPearls Publishing, 28 September 2021.
Orlowski, Michelle. and Manbeer S. Sarao. “Physiology, Follicle Stimulating Hormone.” StatPearls, StatPearls Publishing, 9 May 2021.
Pagana, Kathleen Deska, et al. Mosby's Diagnostic and Laboratory Test Reference. 15th ed., Mosby, 2021.
Luteinizing Hormone (LH), Postmenopausal
Luteinizing hormone (LH) is produced in the anterior pituitary and plays a role in the production of estrogens and androgens. As individuals age, LH levels tend to rise in both genders due to a lack of negative feedback. Increasing LH may adversely affect cognition and increase the risk of Alzheimer's disease.
Furthermore, studies indicate that higher LH levels during menopause can lead to bone loss, while low postmenopausal LH levels might increase the risk of metabolic syndrome.
Physical activity and resistance training in postmenopausal women can reduce vasomotor symptoms (VMS), correlating with a decrease in serum LH levels. Additionally, herbal therapy has been found to reduce menopausal symptoms and influence LH and other hormone levels.
Standard Ranges (Immunoassay)
OPTIMAL DX MEMBERS CLICK HERE for more information on Luteinizing Hormone Postmenopausal
References
Blair, Jeffrey A et al. “Luteinizing hormone: Evidence for direct action in the CNS.” Hormones and behavior vol. 76 (2015): 57-62. doi:10.1016/j.yhbeh.2015.06.020
Burnham, Veronica L, and Janice E Thornton. “Luteinizing hormone as a key player in the cognitive decline of Alzheimer's disease.” Hormones and behavior vol. 76 (2015): 48-56. doi:10.1016/j.yhbeh.2015.05.010
Chen, Yongjie et al. “Associations of follicle-stimulating hormone and luteinizing hormone with metabolic syndrome during the menopausal transition from the National Health and Nutrition Examination Survey.” Frontiers in endocrinology vol. 14 1034934. 9 Feb. 2023, doi:10.3389/fendo.2023.1034934 This is an open-access article distributed under the terms of the Creative Commons Attribution License (CC BY).
García-Martín, Antonia et al. “Gonadotropins Are Related to Lean Mass in Healthy Postmenopausal Women.” Endocrine research vol. 38,3 (2013): 119-124. doi:10.3109/07435800.2012.733987
Gopal, Sriram et al. “Effect of an ashwagandha (Withania Somnifera) root extract on climacteric symptoms in women during perimenopause: A randomized, double-blind, placebo-controlled study.” The journal of obstetrics and gynaecology research vol. 47,12 (2021): 4414-4425. doi:10.1111/jog.15030
Seifert-Klauss, V et al. “Bone loss in premenopausal, perimenopausal and postmenopausal women: results of a prospective observational study over 9 years.” Climacteric : the journal of the International Menopause Society vol. 15,5 (2012): 433-40. doi:10.3109/13697137.2012.658110
van Geel, Tineke A C M et al. “Measures of bioavailable serum testosterone and estradiol and their relationships with muscle mass, muscle strength and bone mineral density in postmenopausal women: a cross-sectional study.” European journal of endocrinology vol. 160,4 (2009): 681-7. doi:10.1530/EJE-08-0702
Follicle-Stimulating Hormone (FSH), Male
Follicle-stimulating hormone (FSH) is produced in the pituitary gland and plays a crucial role in reproduction by impacting the ovaries and testes. In males, FSH helps regulate sperm count and quality, with low levels potentially leading to fertility issues. High FSH levels in men can be linked to caloric deficit, pituitary adenoma, and unresponsive testes, which may interfere with artificial reproductive techniques and increase the risk of castration-resistant prostate cancer.
OPTIMAL DX MEMBERS CLICK HERE for more information on FSH Male
References
Chen, Shyh-Chyan et al. “Appropriate cut-off value for follicle-stimulating hormone in azoospermia to predict spermatogenesis.” Reproductive biology and endocrinology : RB&E vol. 8 108. 8 Sep. 2010, doi:10.1186/1477-7827-8-108
Hoare, Dylan et al. “Serum follicle-stimulating hormone levels predict time to development of castration-resistant prostate cancer.” Canadian Urological Association journal = Journal de l'Association des urologues du Canada vol. 9,3-4 (2015): 122-7. doi:10.5489/cuaj.2545
Orlowski, Michelle. and Manbeer S. Sarao. “Physiology, Follicle Stimulating Hormone.” StatPearls, StatPearls Publishing, 9 May 2021.
Santi, Daniele et al. “Follicle-stimulating Hormone (FSH) Action on Spermatogenesis: A Focus on Physiological and Therapeutic Roles.” Journal of clinical medicine vol. 9,4 1014. 3 Apr. 2020, doi:10.3390/jcm9041014
Follicle-Stimulating Hormone (FSH), Female
Follicle-stimulating hormone (FSH) is a pituitary hormone that influences ovaries, testes, and reproduction. In women, low FSH levels can be related to menstrual irregularities, caloric deficit, and pituitary or hypothalamic dysfunction, while high levels may indicate ovarian insufficiency. Amenorrhea can be linked to both lower FSH due to hypothalamic or pituitary dysfunction and higher FSH in cases of ovarian insufficiency.
Standard Ranges (Immunoassay)
OPTIMAL DX MEMBERS CLICK HERE for more information on FSH Female
References
Henrich, Janet B et al. “Limitations of follicle-stimulating hormone in assessing menopause status: findings from the National Health and Nutrition Examination Survey (NHANES 1999-2000)*.” Menopause (New York, N.Y.) vol. 13,2 (2006): 171-7. doi:10.1097/01.gme.0000198489.49618.96
Lambertino, Anissa et al. “Associations of PCBS, dioxins and furans with follicle-stimulating hormone and luteinizing hormone in postmenopausal women: National Health and Nutrition Examination Survey 1999-2002.” Chemosphere vol. 262 (2021): 128309. doi:10.1016/j.chemosphere.2020.128309
Orlowski, Michelle. and Manbeer S. Sarao. “Physiology, Follicle Stimulating Hormone.” StatPearls, StatPearls Publishing, 9 May 2021.
Pagana, Kathleen Deska, et al. Mosby's Diagnostic and Laboratory Test Reference. 15th ed., Mosby, 2021.
Follicle-Stimulating Hormone (FSH), Postmenopausal
Research indicates that during menopause, varying FSH levels are linked with diverse health implications. Higher FSH levels may be associated with decreased bone mineral density, renal dysfunction, and mild cognitive dysfunction, underscoring FSH’s potential systemic effects. Conversely, lower levels may be associated with an enhanced risk of metabolic syndrome, insulin resistance, and diabetes, suggesting a role in energy and glucose metabolism.
These findings emphasize the multifaceted influence of FSH on postmenopausal health, highlighting the need for continued exploration and understanding.
Standard Range (Immunoassay)
OPTIMAL DX MEMBERS CLICK HERE for more information on FSH Postmenopausal
References
Bertone-Johnson, Elizabeth R et al. “Association of follicle-stimulating hormone levels and risk of type 2 diabetes in older postmenopausal women.” Menopause (New York, N.Y.) vol. 24,7 (2017): 796-802. doi:10.1097/GME.0000000000000834
Gao, Lihong et al. “Follicle-stimulating hormone associates with metabolic factors in postmenopausal women.” Gynecological endocrinology : the official journal of the International Society of Gynecological Endocrinology vol. 34,12 (2018): 1035-1038. doi:10.1080/09513590.2018.1482868
García-Martín, Antonia et al. “Role of serum FSH measurement on bone resorption in postmenopausal women.” Endocrine vol. 41,2 (2012): 302-8. doi:10.1007/s12020-011-9541-7
Hestiantoro, A et al. “FSH to estradiol ratio can be used as screening method for mild cognitive impairment in postmenopausal women.” Climacteric : the journal of the International Menopause Society vol. 20,6 (2017): 577-582. doi:10.1080/13697137.2017.1377696
Lee, Suk Woo et al. “Relationship between metabolic syndrome and follicle-stimulating hormone in postmenopausal women.” Medicine vol. 101,18 e29216. 6 May. 2022, doi:10.1097/MD.0000000000029216
Li, Qihang et al. “High Circulating Follicle-Stimulating Hormone Level Is a Potential Risk Factor for Renal Dysfunction in Post-Menopausal Women.” Frontiers in endocrinology vol. 12 627903. 1 Apr. 2021, doi:10.3389/fendo.2021.627903
Park, Young-Min et al. “Bone Mineral Density in Different Menopause Stages is Associated with Follicle Stimulating Hormone Levels in Healthy Women.” International journal of environmental research and public health vol. 18,3 1200. 29 Jan. 2021, doi:10.3390/ijerph18031200
Shieh, Albert et al. “Estradiol and Follicle-Stimulating Hormone as Predictors of Onset of Menopause Transition-Related Bone Loss in Pre- and Perimenopausal Women.” Journal of bone and mineral research : the official journal of the American Society for Bone and Mineral Research vol. 34,12 (2019): 2246-2253. doi:10.1002/jbmr.3856
Song, Yang et al. “Follicle-Stimulating Hormone Induces Postmenopausal Dyslipidemia Through Inhibiting Hepatic Cholesterol Metabolism.” The Journal of clinical endocrinology and metabolism vol. 101,1 (2016): 254-63. doi:10.1210/jc.2015-2724
Yoldemir, Tevfik et al. “The impact of serum FSH and estradiol on postmenopausal osteoporosis related to time since menopause.” Gynecological endocrinology : the official journal of the International Society of Gynecological Endocrinology vol. 28,11 (2012): 884-8. doi:10.3109/09513590.2012.683066
Pregnenolone, Male, Female
Pregnenolone is a vital molecule produced from cholesterol. It serves as a precursor to several hormones, including cortisol, aldosterone, DHEA, progesterone, estrogen, and testosterone. It has anti-inflammatory, immune-regulating, and neuroprotective properties. Imbalances in pregnenolone levels are associated with various conditions, such as schizophrenia, chronic alcohol intake, type 2 diabetes, and mood disorders. Supplementation has shown potential in improving cognitive function and reducing chronic pain.
OPTIMAL DX MEMBERS CLICK HERE for more information on Pregnenolone
References
Bellocchio, Luigi, and Giovanni Marsicano. “Forgetting in obesity: The pregnenolone link.” Cell metabolism vol. 34,2 (2022): 187-188. doi:10.1016/j.cmet.2022.01.006
Craig, Micah, et al. “Biochemistry, Cholesterol.” StatPearls, StatPearls Publishing, 18 August 2021.
Dušková, M et al. “The steroid metabolome in men with mood and anxiety disorders.” Physiological research vol. 64,Suppl 2 (2015): S275-82. doi:10.33549/physiolres.933067
Jiang, Jingjing et al. “The effect of progesterone and pregnenolone on diabetes status in Chinese rural population: a dose-response analysis from Henan Rural Cohort.” European journal of endocrinology vol. 181,6 (2019): 603-614. doi:10.1530/EJE-19-0352
Marx, Christine E et al. “Proof-of-concept randomized controlled trial of pregnenolone in schizophrenia.” Psychopharmacology vol. 231,17 (2014): 3647-62. doi:10.1007/s00213-014-3673-4
Murugan, Subathra et al. “The neurosteroid pregnenolone promotes degradation of key proteins in the innate immune signaling to suppress inflammation.” The Journal of biological chemistry vol. 294,12 (2019): 4596-4607. doi:10.1074/jbc.RA118.005543
Naylor, Jennifer C et al. “Effect of Pregnenolone vs Placebo on Self-reported Chronic Low Back Pain Among US Military Veterans: A Randomized Clinical Trial.” JAMA network open vol. 3,3 e200287. 2 Mar. 2020, doi:10.1001/jamanetworkopen.2020.0287
Pagana, Kathleen Deska, et al. Mosby's Diagnostic and Laboratory Test Reference. 15th ed., Mosby, 2021.
Tomaselli, Giovanni, and Monique Vallée. “Stress and drug abuse-related disorders: The promising therapeutic value of neurosteroids focus on pregnenolone-progesterone-allopregnanolone pathway.” Frontiers in neuroendocrinology vol. 55 (2019): 100789. doi:10.1016/j.yfrne.2019.100789
Parathyroid Hormone (PTH)
Parathyroid hormone (PTH) plays a crucial role in regulating calcium, phosphorus, and magnesium levels in the blood and activating vitamin D in the kidney. Imbalances in PTH levels can be caused by various factors, including vitamin D deficiency, parathyroid gland damage, and certain medications.
Abnormal PTH levels are associated with metabolic dysfunction, bone tumors, and increased cardiovascular risk. It is essential to monitor PTH levels and related factors, such as vitamin D, calcium, magnesium, and albumin, to maintain overall health.
OPTIMAL DX MEMBERS CLICK HERE for more information on Parathyroid Hormone
References
Claflin, Jake et al. “Intraoperative parathyroid hormone levels ≤40 pg/mL are associated with the lowest persistence rates after parathyroidectomy for primary hyperparathyroidism.” Surgery vol. 166,1 (2019): 50-54. doi:10.1016/j.surg.2019.01.024
Khan, Maqsood, et al. “Physiology, Parathyroid Hormone.” StatPearls, StatPearls Publishing, 27 September 2021.
Kim, Won Tae et al. “Parathyroid hormone is associated with prostate cancer.” Prostate international vol. 8,3 (2020): 116-120. doi:10.1016/j.prnil.2020.02.002
Pagana, Kathleen Deska; Pagana, Timothy J.; Pagana, Theresa N. Mosby's Diagnostic and Laboratory Test Reference. Elsevier Health Sciences. 2019.
Pascale, Antonietta V et al. “Vitamin D, parathyroid hormone and cardiovascular risk: the good, the bad and the ugly.” Journal of cardiovascular medicine (Hagerstown, Md.) vol. 19,2 (2018): 62-66. doi:10.2459/JCM.0000000000000614
Yalla, N et al. “Parathyroid hormone reference ranges in healthy individuals classified by vitamin D status.” Journal of endocrinological investigation vol. 42,11 (2019): 1353-1360. doi:10.1007/s40618-019-01075-w
Anti-Mullerian Hormone (AMH), Female
Anti-Mullerian hormone (AMH) is a marker of ovarian reserve and is used in evaluating infertility and PCOS in women. Low AMH levels indicate infertility, low ovarian reserve, and fewer eggs retrieved during fertility treatment, while high levels are seen in PCOS cases and are associated with higher testosterone levels. AMH levels decline as a woman approaches menopause and become undetectable, helping to predict the onset of menopause.
OPTIMAL DX MEMBERS CLICK HERE for more information on Anti-Mullerian Hormone
References
Aghssa, Malek Mansour et al. “Optimal cut-off value of basal anti-mullerian hormone in iranian infertile women for prediction of ovarian hyper-stimulation syndrome and poor response to stimulation.” Reproductive health vol. 12 85. 10 Sep. 2015, doi:10.1186/s12978-015-0053-4
Aydoğmuş, Hüseyin et al. “Can we use serum Anti-Mullerian hormone to differentiate the diagnosis between polycystic ovary syndrome patients and healthy women with polycystic ovarian morphology and regular menstrual cycles.” Saudi medical journal vol. 39,10 (2018): 1011-1016. doi:10.15537/smj.2018.10.23413
Casadei, Luisa et al. “The diagnosis of PCOS in young infertile women according to different diagnostic criteria: the role of serum anti-Müllerian hormone.” Archives of gynecology and obstetrics vol. 298,1 (2018): 207-215. doi:10.1007/s00404-018-4803-8
Gruijters, Maria J G et al. “Anti-Müllerian hormone and its role in ovarian function.” Molecular and cellular endocrinology vol. 211,1-2 (2003): 85-90. doi:10.1016/j.mce.2003.09.024
Homburg, R et al. “Automated anti-Mullerian hormone measurement: data review to provide insights and interpretation.” Gynecological endocrinology : the official journal of the International Society of Gynecological Endocrinology vol. 37,6 (2021): 511-514. doi:10.1080/09513590.2020.1785419
Moolhuijsen, Loes M E, and Jenny A Visser. “Anti-Müllerian Hormone and Ovarian Reserve: Update on Assessing Ovarian Function.” The Journal of clinical endocrinology and metabolism vol. 105,11 (2020): 3361–3373. doi:10.1210/clinem/dgaa513
Song, Do Kyeong et al. “Differentiation between polycystic ovary syndrome and polycystic ovarian morphology by means of an anti-Müllerian hormone cutoff value.” The Korean journal of internal medicine vol. 32,4 (2017): 690-698. doi:10.3904/kjim.2016.038
Insulin-like growth factor-1 (IGF-1)
Insulin-like growth factor-1 (IGF-1) is a peptide that regulates growth hormone effects in the body. Low levels of IGF-1 are associated with chronic diseases, malnutrition, and dwarfism, while high levels may be related to obesity, pregnancy, gigantism, increased cancer risk. and diabetic complications. Both high and low levels are associated with insulin resistance and diabetes risk. IGF-1 levels decline with age, and maintaining levels at the high end of normal may help reverse chronic disease complications.
OPTIMAL DX MEMBERS CLICK HERE for more information on Insulin-like growth factor-1
References
Biadgo, Belete et al. “Insulin-like Growth Factor and its Therapeutic Potential for Diabetes Complications - Mechanisms and Metabolic Links: A Review.” The review of diabetic studies : RDS vol. 16,1 (2020): 24-34. doi:10.1900/RDS.2020.16.24
Borofsky, Nancy D et al. “Utility of insulin-like growth factor-1 as a biomarker in epidemiologic studies.” Clinical chemistry vol. 48,12 (2002): 2248-51.
Braverman, E et al. “Low and Normal IGF-1 Levels in Patients with Chronic Medical Disorders (CMD) is Independent of Anterior Pituitary Hormone Deficiencies: Implications for Treating IGF-1 Abnormal Deficiencies with CMD.” Journal of genetic syndromes & gene therapy vol. 4,123 (2013): 1000123. doi:10.4172/2157-7412.1000123
Chanson, Philippe et al. “Reference Values for IGF-I Serum Concentrations: Comparison of Six Immunoassays.” The Journal of clinical endocrinology and metabolism vol. 101,9 (2016): 3450-8. doi:10.1210/jc.2016-1257
Clemmons, David R. “Metabolic actions of insulin-like growth factor-I in normal physiology and diabetes.” Endocrinology and metabolism clinics of North America vol. 41,2 (2012): 425-43, vii-viii. doi:10.1016/j.ecl.2012.04.017
Gianuzzi, Ximena et al. “Insulin growth factor (IGF) 1, IGF-binding proteins and ovarian cancer risk: A systematic review and meta-analysis.” Maturitas vol. 94 (2016): 22-29. doi:10.1016/j.maturitas.2016.08.012
Higashi, Yusuke et al. “IGF-1 and cardiovascular disease.” Growth hormone & IGF research : official journal of the Growth Hormone Research Society and the International IGF Research Society vol. 45 (2019): 6-16. doi:10.1016/j.ghir.2019.01.002 [R}
Pagana, Kathleen Deska; Pagana, Timothy J.; Pagana, Theresa N. Mosby's Diagnostic and Laboratory Test Reference. Elsevier Health Sciences. 2019.
Rahmani, Jamal et al. “The influence of fasting and energy restricting diets on IGF-1 levels in humans: A systematic review and meta-analysis.” Ageing research reviews vol. 53 (2019): 100910. doi:10.1016/j.arr.2019.100910 v
Yu, H, and T Rohan. “Role of the insulin-like growth factor family in cancer development and progression.” Journal of the National Cancer Institute vol. 92,18 (2000): 1472-89. doi:10.1093/jnci/92.18.1472
Zhu, Huijuan et al. “Reference ranges for serum insulin-like growth factor I (IGF-I) in healthy Chinese adults.” PloS one vol. 12,10 e0185561. 4 Oct. 2017, doi:10.1371/journal.pone.0185561
Dihydrotestosterone (DHT) Male, Female
Dihydrotestosterone (DHT) is a potent androgen hormone synthesized from testosterone. Low levels of DHT are linked to metabolic dysfunction, cognitive decline, and increased risk of heart disease and stroke, while high levels are associated with polycystic ovary syndrome (PCOS), hirsutism, and acne. DHT plays a significant role in male physiology but has a less clear role in women.
OPTIMAL DX MEMBERS CLICK HERE for more information on Dihydrotestosterone
References
Kinter, Kevin J. and Aabha A. Anekar. “Biochemistry, Dihydrotestosterone.” StatPearls, StatPearls Publishing, 6 March 2023.
Shores, Molly M et al. “Testosterone and dihydrotestosterone and incident ischaemic stroke in men in the Cardiovascular Health Study.” Clinical endocrinology vol. 81,5 (2014): 746-53. doi:10.1111/cen.12452
Swerdloff, Ronald S et al. “Dihydrotestosterone: Biochemistry, Physiology, and Clinical Implications of Elevated Blood Levels.” Endocrine reviews vol. 38,3 (2017): 220-254. doi:10.1210/er.2016-1067
Yeap, Bu B et al. “In older men an optimal plasma testosterone is associated with reduced all-cause mortality and higher dihydrotestosterone with reduced ischemic heart disease mortality, while estradiol levels do not predict mortality.” The Journal of clinical endocrinology and metabolism vol. 99,1 (2014): E9-18. doi:10.1210/jc.2013-3272
Yeap, Bu B. “Testosterone and its metabolites: differential associations with cardiovascular and cerebrovascular events in men.” Asian journal of andrology vol. 20,2 (2018): 109-114. doi:10.4103/aja.aja_50_17
Weber, B et al. “Testosterone, androstenedione and dihydrotestosterone concentrations are elevated in female patients with major depression.” Psychoneuroendocrinology vol. 25,8 (2000): 765-71. doi:10.1016/s0306-4530(00)00023-8
Immunoglobulins, also known as antibodies, are gamma globulin proteins produced by activated B lymphocytes in response to various pathogens and antigens. They play a crucial role in immune responses and can be used therapeutically for various conditions. Monitoring serum immunoglobulin levels is essential in cases of chronic infections, hypersensitivity disorders, autoimmune diseases, and immune deficiencies. Hypogammaglobulinemia, or low levels of immunoglobulins, can increase an individual's susceptibility to infection, allergy, cancer, and autoimmunity. Various factors, including medications, can influence immunoglobulin levels, and these antibodies can be measured separately in the blood to assess immune system function.
Immunoglobulin A (IgA)
Immunoglobulin A is the primary immunoglobulin that protects epithelial surfaces. It is secreted in the GI tract, tears, saliva, and colostrum and can be measured in the blood. Low IgA may be seen in celiac disease and other autoimmune disorders. High IgA may be associated with chronic infection, liver disease, inflammation, and metabolic dysfunction.
References
Chow, Marisa A et al. “Immunoglobulin A deficiency in celiac disease.” Journal of clinical gastroenterology vol. 46,10 (2012): 850-4. doi:10.1097/MCG.0b013e31824b2277
Dunkelberger, Jason R., and Wen-Chao Song. "Complement and its role in innate and adaptive immune responses." Cell research 20.1 (2010): 34-50.
Justiz Vaillant, Angel A., et al. “Immunoglobulin.” StatPearls, StatPearls Publishing, 12 October 2021.
Pagana, Kathleen Deska, et al. Mosby's Diagnostic and Laboratory Test Reference. 15th ed., Mosby, 2021.
Pallav, Kumar et al. “Immunoglobulin A deficiency in celiac disease in the United States.” Journal of gastroenterology and hepatology vol. 31,1 (2016): 133-7. doi:10.1111/jgh.13176
Gonzalez-Quintela, A et al. “Serum levels of immunoglobulins (IgG, IgA, IgM) in a general adult population and their relationship with alcohol consumption, smoking and common metabolic abnormalities.” Clinical and experimental immunology vol. 151,1 (2008): 42-50. doi:10.1111/j.1365-2249.2007.03545.x
Immunoglobulin E (IgE)
Immunoglobulin E (IgE) plays a crucial role in allergic responses and host defense against parasitic infections. Elevated IgE levels are associated with allergies, asthma, eczema, and certain infections. IgE activation can lead to type 1 hypersensitivity reactions, and in severe cases, life-threatening systemic anaphylaxis.
References
Anvari, Sara et al. “IgE-Mediated Food Allergy.” Clinical reviews in allergy & immunology vol. 57,2 (2019): 244-260. doi:10.1007/s12016-018-8710-3
Justiz Vaillant, Angel A., et al. “Immunoglobulin.” StatPearls, StatPearls Publishing, 12 October 2021.
Pagana, Kathleen Deska, et al. Mosby's Diagnostic and Laboratory Test Reference. 15th ed., Mosby, 2021.
Paranjape, Anuya et al. “Oral Immunotherapy and Basophil and Mast Cell Reactivity in Food Allergy.” Frontiers in immunology vol. 11 602660. 14 Dec. 2020, doi:10.3389/fimmu.2020.602660
Rengganis, Iris, et al. "Total serum IgE levels among adults patients with intermittent and persistent allergic asthmas." Medical Journal of Indonesia 27.4 (2018): 279-83.
Wu, Lawren C, and Ali A Zarrin. “The production and regulation of IgE by the immune system.” Nature reviews. Immunology vol. 14,4 (2014): 247-59. doi:10.1038/nri3632
Immunoglobulin G (IgG)
Immunoglobulin G (IgG) is the most abundant immunoglobulin in circulation and is divided into four subclasses. It plays a primary role in protecting against pathogens. However, IgG4 antibodies are unique in that they can block IgE-mediated reactions to food and actually increase tolerance. Low IgG levels are linked to compromised immunity, while high levels can occur with chronic liver disease, autoimmune diseases, and other conditions. The presence of food-specific IgG antibodies may reflect increased GI inflammation and permeability.
References
Agarwal, Shradha, and Charlotte Cunningham-Rundles. “Assessment and clinical interpretation of reduced IgG values.” Annals of allergy, asthma & immunology : official publication of the American College of Allergy, Asthma, & Immunology vol. 99,3 (2007): 281-3. doi:10.1016/S1081-1206(10)60665-5
Gocki, Jacek, and Zbigniew Bartuzi. “Role of immunoglobulin G antibodies in diagnosis of food allergy.” Postepy dermatologii i alergologii vol. 33,4 (2016): 253-6. doi:10.5114/ada.2016.61600
Gonzalez-Quintela, A et al. “Serum levels of immunoglobulins (IgG, IgA, IgM) in a general adult population and their relationship with alcohol consumption, smoking and common metabolic abnormalities.” Clinical and experimental immunology vol. 151,1 (2008): 42-50. doi:10.1111/j.1365-2249.2007.03545.x
Justiz Vaillant, Angel A., et al. “Immunoglobulin.” StatPearls, StatPearls Publishing, 12 October 2021.
Maguire, G A et al. “Are there any clinical indications for measuring IgG subclasses?.” Annals of clinical biochemistry vol. 39,Pt 4 (2002): 374-7. doi:10.1258/000456302760042678
Olivera, Ana et al. “Editorial: Innate Cells in the Pathogenesis of Food Allergy.” Frontiers in immunology vol. 12 709991. 10 Jun. 2021, doi:10.3389/fimmu.2021.709991
Pagana, Kathleen Deska, et al. Mosby's Diagnostic and Laboratory Test Reference. 15th ed., Mosby, 2021.
Paranjape, Anuya et al. “Oral Immunotherapy and Basophil and Mast Cell Reactivity in Food Allergy.” Frontiers in immunology vol. 11 602660. 14 Dec. 2020, doi:10.3389/fimmu.2020.602660
Vidarsson, Gestur et al. “IgG subclasses and allotypes: from structure to effector functions.” Frontiers in immunology vol. 5 520. 20 Oct. 2014, doi:10.3389/fimmu.2014.00520
Immunoglobulin M (IgM)
Immunoglobulin M (IgM) plays a vital role in early immune response to infections and may offer protection against inflammation, atherosclerosis, and autoimmunity. Low IgM levels can be associated with various health conditions and medication use, while high levels may occur in cases of acute and chronic infections, autoimmune diseases, and chronic liver disorders. IgM is essential in fighting bacterial, fungal, viral, and parasitic infections and in clearing apoptotic cells. A significant increase in IgM indicates an active infection.
References
Agarwal, Shradha, and Charlotte Cunningham-Rundles. “Assessment and clinical interpretation of reduced IgG values.” Annals of allergy, asthma & immunology : official publication of the American College of Allergy, Asthma, & Immunology vol. 99,3 (2007): 281-3. doi:10.1016/S1081-1206(10)60665-5
Dunkelberger, Jason R., and Wen-Chao Song. "Complement and its role in innate and adaptive immune responses." Cell research 20.1 (2010): 34-50.
Ehrenstein, Michael R, and Clare A Notley. “The importance of natural IgM: scavenger, protector and regulator.” Nature reviews. Immunology vol. 10,11 (2010): 778-86. doi:10.1038/nri2849
Gonzalez-Quintela, A et al. “Serum levels of immunoglobulins (IgG, IgA, IgM) in a general adult population and their relationship with alcohol consumption, smoking and common metabolic abnormalities.” Clinical and experimental immunology vol. 151,1 (2008): 42-50. doi:10.1111/j.1365-2249.2007.03545.x
Justiz Vaillant, Angel A., et al. “Immunoglobulin.” StatPearls, StatPearls Publishing, 12 October 2021.
Pagana, Kathleen Deska, et al. Mosby's Diagnostic and Laboratory Test Reference. 15th ed., Mosby, 2021.
Complement C3
The complement system is essential for immunity, playing a role in inflammation, vascular permeability, histamine release, vasodilation, and smooth muscle contraction. Elevated levels of the C3 component are linked to cardiovascular disease, obesity, metabolic syndrome, and diabetes, while low levels are associated with recurrent infections and autoimmune disorders like lupus and rheumatoid arthritis. High complement levels may indicate acute immune activation and can occur in various health conditions, including kidney disease, inflammation, obesity, and respiratory disorders.
OPTIMAL DX MEMBERS CLICK HERE for more information on Complement C3
References
Barbu, Andreea et al. “The role of complement factor C3 in lipid metabolism.” Molecular immunology vol. 67,1 (2015): 101-7. doi:10.1016/j.molimm.2015.02.027
Hertle, E et al. “Complement C3: an emerging risk factor in cardiometabolic disease.” Diabetologia vol. 55,4 (2012): 881-4. doi:10.1007/s00125-012-2462-z
Hertle, E et al. “The complement system in human cardiometabolic disease.” Molecular immunology vol. 61,2 (2014): 135-48. doi:10.1016/j.molimm.2014.06.031
Jia, Changhao, Ying Tan, and Minghui Zhao. "The complement system and autoimmune diseases." Chronic Diseases and Translational Medicine (2022).
Li, Hejun et al. “Diagnostic value of serum complement C3 and C4 levels in Chinese patients with systemic lupus erythematosus.” Clinical rheumatology vol. 34,3 (2015): 471-7. doi:10.1007/s10067-014-2843-4
Nilsson, Bo et al. “C3 and C4 are strongly related to adipose tissue variables and cardiovascular risk factors.” European journal of clinical investigation vol. 44,6 (2014): 587-96. doi:10.1111/eci.12275
Onat, Altan et al. “Complement C3 and cleavage products in cardiometabolic risk.” Clinica chimica acta; international journal of clinical chemistry vol. 412,13-14 (2011): 1171-9. doi:10.1016/j.cca.2011.03.005
Pagana, Kathleen Deska, et al. Mosby's Diagnostic and Laboratory Test Reference. 15th ed., Mosby, 2021.
Sarma, J Vidya, and Peter A Ward. “The complement system.” Cell and tissue research vol. 343,1 (2011): 227-35. doi:10.1007/s00441-010-1034-0
Tam, Jerry C H et al. “Intracellular sensing of complement C3 activates cell autonomous immunity.” Science (New York, N.Y.) vol. 345,6201 (2014): 1256070. doi:10.1126/science.1256070
Wang, Hongbin, and Mengyao Liu. “Complement C4, Infections, and Autoimmune Diseases.” Frontiers in immunology vol. 12 694928. 14 Jul. 2021, doi:10.3389/fimmu.2021.694928
Complement C4
The complement system plays a crucial role in immunity, promoting inflammation, vascular permeability, histamine release, vasodilation, and smooth muscle contraction. It also aids in resolving immune responses and promoting tissue repair. Elevated C4 levels are linked to cardiovascular disease, obesity, metabolic syndrome, diabetes, and gut dysbiosis, while low levels are associated with recurrent infections and autoimmune disorders such as lupus and rheumatoid arthritis. The complement system's balance and activity are essential for maintaining immune function and overall health.
OPTIMAL DX MEMBERS CLICK HERE for more information on Complement C4
References
Barbu, Andreea et al. “The role of complement factor C3 in lipid metabolism.” Molecular immunology vol. 67,1 (2015): 101-7. doi:10.1016/j.molimm.2015.02.027
Li, Hejun et al. “Diagnostic value of serum complement C3 and C4 levels in Chinese patients with systemic lupus erythematosus.” Clinical rheumatology vol. 34,3 (2015): 471-7. doi:10.1007/s10067-014-2843-4
Nilsson, Bo et al. “C3 and C4 are strongly related to adipose tissue variables and cardiovascular risk factors.” European journal of clinical investigation vol. 44,6 (2014): 587-96. doi:10.1111/eci.12275
Pagana, Kathleen Deska, et al. Mosby's Diagnostic and Laboratory Test Reference. 15th ed., Mosby, 2021.
Severance, Emily G et al. “Complement C4 associations with altered microbial biomarkers exemplify gene-by-environment interactions in schizophrenia.” Schizophrenia research vol. 234 (2021): 87-93. doi:10.1016/j.schres.2021.02.001
Wang, Hongbin, and Mengyao Liu. “Complement C4, Infections, and Autoimmune Diseases.” Frontiers in immunology vol. 12 694928. 14 Jul. 2021, doi:10.3389/fimmu.2021.694928
Biomarkers of inflammation and oxidation are molecules that indicate the presence, severity, or progression of inflammatory and oxidative processes in the body. Inflammation is a normal physiological process that helps the body fight infections and heal injuries, while oxidation involves the production of reactive oxygen species (ROS) during cellular metabolism or pathological processes. Both inflammation and oxidation are essential for maintaining homeostasis. However, chronic inflammation and excessive ROS production can contribute to various diseases, including cardiovascular disease, diabetes, cancer, and neurodegenerative disorders. Understanding and monitoring these biomarkers can help healthcare professionals detect and manage inflammatory and oxidative stress-related conditions, identify individuals at risk for chronic diseases, and monitor the effectiveness of treatments.
Fibrinogen Activity
Fibrinogen, an acute phase reactant and clotting factor produced in the liver, is associated with cardiovascular disease, peripheral artery disease, stroke, and inflammation. Elevated levels are seen in infection, tissue damage, inflammatory bowel disease, and neurological disorders, while low levels may be associated with liver dysfunction, malnutrition, advanced cancer, clotting disorders, and recurrent miscarriages. It is a biomarker of systemic inflammation, and its levels can be influenced by medications, stress, and pollution. Fibrinogen activity is most commonly measured; if low or abnormal, then fibrinogen antigen testing may be indicated.
OPTIMAL DX MEMBERS CLICK HERE for more information on Fibrinogen Activity
References
Ang, Lawrence et al. “Elevated Baseline Serum Fibrinogen: Effect on 2-Year Major Adverse Cardiovascular Events Following Percutaneous Coronary Intervention.” Journal of the American Heart Association vol. 6,11 e006580. 18 Nov. 2017, doi:10.1161/JAHA.117.006580
Chen, Xiao-Fu et al. “Predictive value of fibrinogen in identifying inflammatory bowel disease in active stage.” BMC gastroenterology vol. 21,1 472. 15 Dec. 2021, doi:10.1186/s12876-021-02040-9
Croft, Daniel et al. “Do elevated blood levels of omega-3 fatty acids modify effects of particulate air pollutants on fibrinogen?.” Air quality, atmosphere, & health vol. 11,7 (2018): 791-799. doi:10.1007/s11869-018-0586-0
Danesh, J et al. “Association of fibrinogen, C-reactive protein, albumin, or leukocyte count with coronary heart disease: meta-analyses of prospective studies.” JAMA vol. 279,18 (1998): 1477-82. doi:10.1001/jama.279.18.1477
Danesh J, Lewington S, Thompson SG, et al. Plasma fibrinogen level and the risk of major cardiovascular diseases and nonvascular mortality: an individual participant meta-analysis. JAMA. 2005 Oct 12;294(14):1799-809.
Davalos, Dimitrios, and Katerina Akassoglou. “Fibrinogen as a key regulator of inflammation in disease.” Seminars in immunopathology vol. 34,1 (2012): 43-62. doi:10.1007/s00281-011-0290-8
Liu, Junxiu et al. “Associations of C-reactive protein and fibrinogen with mortality from all-causes, cardiovascular disease and cancer among U.S. adults.” Preventive medicine vol. 139 (2020): 106044. doi:10.1016/j.ypmed.2020.106044
Luyendyk, James P et al. “The multifaceted role of fibrinogen in tissue injury and inflammation.” Blood vol. 133,6 (2019): 511-520. doi:10.1182/blood-2018-07-818211
Mohamed, Eman Ibrahim, Maye M. Merghani, and Nihad Elsadig Babiker. "Estimation of Fibrinogen level among Sudanese women with recurrent miscarriage." Journal of Drug Delivery and Therapeutics 11.6-S (2021): 140-144.
Pagana, Kathleen Deska, et al. Mosby's Diagnostic and Laboratory Test Reference. 16th ed., Mosby, 2022.
Pahwa, Roma, et al. “Chronic Inflammation.” StatPearls, StatPearls Publishing, 8 August 2022.
Petersen, Mark A et al. “Fibrinogen in neurological diseases: mechanisms, imaging and therapeutics.” Nature reviews. Neuroscience vol. 19,5 (2018): 283-301. doi:10.1038/nrn.2018.13
Pieters, Marlien et al. “Biomarker association with cardiovascular disease and mortality - The role of fibrinogen. A report from the NHANES study.” Thrombosis research vol. 198 (2021): 182-189. doi:10.1016/j.thromres.2020.12.009
Testing.com. Fibrinogen Test. https://www.testing.com/tests/fibrinogn/.
Yu, En et al. “Inflammatory Biomarkers and Risk of Atherosclerotic Cardiovascular Disease.” Open medicine (Warsaw, Poland) vol. 13 208-213. 24 May. 2018, doi:10.1515/med-2018-0032
Uric Acid
Uric acid, a byproduct of purine metabolism, functions as an important antioxidant. However, elevated serum levels are linked to an increased risk of gout, heart disease, stroke, cognitive dysfunction, and kidney stones. High uric acid levels can result from excessive purine intake or production, or decreased excretion through the kidneys or gastrointestinal tract. Factors such as stress, alcoholism, cancer, or ketoacidosis may also lead to increased uric acid levels.
Standard Range:
Male: 3.45 - 8.00 mg/dL (205.21 - 475.84 µmol/L)
Female: 2.50 - 7.00 mg/dL (148.70 - 416.36 µmol/L)
Male: 3.50 - 5.40 mg/dL (208.18 - 321.19 µmol/L)
Female: 3.00 - 4.70 mg/dL (178.44 - 279.57 µmol/L)
OPTIMAL DX MEMBERS CLICK HERE for more information on Uric Acid
References
Casiglia, Edoardo et al. “Serum uric acid and fatal myocardial infarction: detection of prognostic cut-off values: The URRAH (Uric Acid Right for Heart Health) study.” Journal of hypertension vol. 38,3 (2020): 412-419. doi:10.1097/HJH.0000000000002287
Desideri, G et al. “Is it time to revise the normal range of serum uric acid levels?.” European review for medical and pharmacological sciences vol. 18,9 (2014): 1295-306.
Helget, Lindsay N, and Ted R Mikuls. “Environmental Triggers of Hyperuricemia and Gout.” Rheumatic diseases clinics of North America vol. 48,4 (2022): 891-906. doi:10.1016/j.rdc.2022.06.009
Keenan, Robert T., Svetlana Krasnokutsky, and Michael H. Pillinger. "Etiology and pathogenesis of hyperuricemia and gout." Kelley and Firestein's Textbook of Rheumatology. Elsevier, 2017. 1597-1619.
Kuang, Huiying et al. “Association between dietary coenzyme Q10 intake and hyperuricemia in Chinese adults: a nationwide cross-sectional study.” BMC public health vol. 25,1 806. 27 Feb. 2025, doi:10.1186/s12889-024-21041-3
Pagana, Kathleen Deska, et al. Mosby's Diagnostic and Laboratory Test Reference. 15th ed., Mosby, 2021.
Ruoff, Gary, and N Lawrence Edwards. “Overview of Serum Uric Acid Treatment Targets in Gout: Why Less Than 6 mg/dL?.” Postgraduate medicine vol. 128,7 (2016): 706-15. doi:10.1080/00325481.2016.1221732
Tamariz, Leonardo et al. “Uric acid as a predictor of all-cause mortality in heart failure: a meta-analysis.” Congestive heart failure (Greenwich, Conn.) vol. 17,1 (2011): 25-30. doi:10.1111/j.1751-7133.2011.00200.x
Virdis, Agostino et al. “Identification of the Uric Acid Thresholds Predicting an Increased Total and Cardiovascular Mortality Over 20 Years.” Hypertension (Dallas, Tex. : 1979) vol. 75,2 (2020): 302-308. doi:10.1161/HYPERTENSIONAHA.119.13643
GlycA
GlycA is a marker of systemic inflammation and a valuable biomarker for assessing low-level inflammation associated with cardiovascular, metabolic, and autoimmune disorders. Elevated levels are associated with various inflammatory conditions, infections, obesity, insulin resistance, and type 2 diabetes. While low GlycA levels generally indicate low inflammation, they can be falsely decreased in sickle cell anemia due to the hemolytic destruction of red blood cells.
References
An, Lihua et al. “Increased glycoprotein acetylation is associated with high cardiac event rates: Analysis using coronary computed tomography angiography.” Anatolian journal of cardiology vol. 20,3 (2018): 152-158. doi:10.14744/AnatolJCardiol.2018.01058
Bartlett, David B et al. “Association of the Composite Inflammatory Biomarker GlycA, with Exercise-Induced Changes in Body Habitus in Men and Women with Prediabetes.” Oxidative medicine and cellular longevity vol. 2017 (2017): 5608287. doi:10.1155/2017/5608287
Benson, Eve-Marie A et al. “Associations of ideal cardiovascular health with GlycA, a novel inflammatory marker: The Multi-Ethnic Study of Atherosclerosis.” Clinical cardiology vol. 41,11 (2018): 1439-1445. doi:10.1002/clc.23069
Connelly, Margery A et al. “GlycA, a marker of acute phase glycoproteins, and the risk of incident type 2 diabetes mellitus: PREVEND study.” Clinica chimica acta; international journal of clinical chemistry vol. 452 (2016): 10-7. doi:10.1016/j.cca.2015.11.001
Connelly, Margery A et al. “GlycA, a novel biomarker of systemic inflammation and cardiovascular disease risk.” Journal of translational medicine vol. 15,1 219. 27 Oct. 2017, doi:10.1186/s12967-017-1321-6
Dierckx, Tim et al. “GlycA, a Nuclear Magnetic Resonance Spectroscopy Measure for Protein Glycosylation, is a Viable Biomarker for Disease Activity in IBD.” Journal of Crohn's & colitis vol. 13,3 (2019): 389-394. doi:10.1093/ecco-jcc/jjy162
Fuertes-Martín, Rocío et al. “Title: Human Serum/Plasma Glycoprotein Analysis by 1H-NMR, an Emerging Method of Inflammatory Assessment.” Journal of clinical medicine vol. 9,2 354. 27 Jan. 2020, doi:10.3390/jcm9020354
Lawler, Patrick R, and Samia Mora. “Glycosylation Signatures of Inflammation Identify Cardiovascular Risk: Some Glyc It Hot.” Circulation research vol. 119,11 (2016): 1154-1156. doi:10.1161/CIRCRESAHA.116.310005
Ritchie, Scott C et al. “The Biomarker GlycA Is Associated with Chronic Inflammation and Predicts Long-Term Risk of Severe Infection.” Cell systems vol. 1,4 (2015): 293-301. doi:10.1016/j.cels.2015.09.007
Rodriguez-Carrio, Javier et al. “GlycA Levels during the Earliest Stages of Rheumatoid Arthritis: Potential Use as a Biomarker of Subclinical Cardiovascular Disease.” Journal of clinical medicine vol. 9,8 2472. 1 Aug. 2020, doi:10.3390/jcm9082472
Tibuakuu, Martin et al. “GlycA, a novel inflammatory marker, is associated with subclinical coronary disease.” AIDS (London, England) vol. 33,3 (2019): 547-557. doi:10.1097/QAD.0000000000002079
C-Reactive Protein (CRP)
C-reactive protein (CRP), an acute-phase protein produced in the liver, increases with inflammation and infection. Its levels can rise faster and recover more rapidly than other inflammatory markers, making it a reliable biomarker for acute inflammatory changes. High levels of CRP are linked to numerous health conditions, including cardiovascular disease, diabetes, metabolic syndrome, and various inflammatory disorders. On the other hand, low CRP levels do not completely exclude the possibility of inflammation. Due to its high value as a protein biomarker, CRP plays a crucial role in predicting risks of heart failure, all-cause mortality, and cardiovascular disease.
References
Bardagjy, Allison S, and Francene M Steinberg. “Relationship Between HDL Functional Characteristics and Cardiovascular Health and Potential Impact of Dietary Patterns: A Narrative Review.” Nutrients vol. 11,6 1231. 30 May. 2019, doi:10.3390/nu11061231
Farwell, Wildon R, and Eric N Taylor. “Serum anion gap, bicarbonate and biomarkers of inflammation in healthy individuals in a national survey.” CMAJ : Canadian Medical Association journal = journal de l'Association medicale canadienne vol. 182,2 (2010): 137-41. doi:10.1503/cmaj.090329
Hernández-Álvarez, Elena et al. “Association between 25-OH-vitamin D and C-reactive protein as a marker of inflammation and cardiovascular risk in clinical practice.” Annals of clinical biochemistry vol. 56,4 (2019): 502-507. doi:10.1177/0004563219851539
Ho, Jennifer E et al. “Protein Biomarkers of Cardiovascular Disease and Mortality in the Community.” Journal of the American Heart Association vol. 7,14 e008108. 13 Jul. 2018, doi:10.1161/JAHA.117.008108
Li, Qian et al. “Association of C-reactive protein and vitamin D deficiency with cardiovascular disease: A nationwide cross-sectional study from National Health and Nutrition Examination Survey 2007 to 2008.” Clinical cardiology vol. 42,7 (2019): 663-669. doi:10.1002/clc.23189
Liu, Junxiu et al. “Associations of C-reactive protein and fibrinogen with mortality from all-causes, cardiovascular disease and cancer among U.S. adults.” Preventive medicine vol. 139 (2020): 106044. doi:10.1016/j.ypmed.2020.106044
Nehring, Sara M., et al. “C Reactive Protein.” StatPearls, StatPearls Publishing, 10 May 2021.
Ostadmohammadi, Vahidreza et al. “The Effects of Vitamin D Supplementation on Glycemic Control, Lipid Profiles and C-Reactive Protein Among Patients with Cardiovascular Disease: a Systematic Review and Meta-Analysis of Randomized Controlled Trials.” Current pharmaceutical design vol. 25,2 (2019): 201-210. doi:10.2174/1381612825666190308152943
Pagana, Kathleen Deska, et al. Mosby's Diagnostic and Laboratory Test Reference. 15th ed., Mosby, 2021.
Ridker, Paul M et al. “C-reactive protein, the metabolic syndrome, and risk of incident cardiovascular events: an 8-year follow-up of 14 719 initially healthy American women.” Circulation vol. 107,3 (2003): 391-7. doi:10.1161/01.cir.0000055014.62083.05
Tutuncu, Yildiz et al. “A Comparison of hs-CRP Levels in New Diabetes Groups Diagnosed Based on FPG, 2-hPG, or HbA1c Criteria.” Journal of diabetes research vol. 2016 (2016): 5827041. doi:10.1155/2016/5827041
High-Sensitivity CRP (hs-CRP)
High-sensitivity C-reactive protein (hs-CRP) is a test that can detect lower levels of CRP, a protein produced in response to inflammation, more accurately than traditional assays. Elevated levels of hs-CRP are associated with systemic inflammation and various health conditions, including cardiovascular diseases, metabolic syndrome, non-alcoholic fatty liver disease (NAFLD), and diabetes. Low levels, conversely, suggest the absence of systemic inflammation. However, hs-CRP levels can fluctuate, and as such, for accurate cardiovascular risk assessment, two serial measurements taken at least 2 weeks apart are recommended. In addition to indicating cardiovascular risk, hs-CRP can also help in diagnosing treatment-resistant depression, assessing the severity of atherosclerosis, and determining the cause of low albumin in end-stage renal disease patients.
OPTIMAL DX MEMBERS CLICK HERE for more information on hs-CRP
References
Connelly, Margery A et al. “GlycA, a novel biomarker of systemic inflammation and cardiovascular disease risk.” Journal of translational medicine vol. 15,1 219. 27 Oct. 2017, doi:10.1186/s12967-017-1321-6
Han, Emilie et al. “Comparison of High-Sensitivity C-Reactive Protein vs C-reactive Protein for Cardiovascular Risk Prediction in Chronic Cardiac Disease.” The journal of applied laboratory medicine vol. 7,6 (2022): 1259-1271. doi:10.1093/jalm/jfac069
Jellinger, Paul S et al. “AMERICAN ASSOCIATION OF CLINICAL ENDOCRINOLOGISTS AND AMERICAN COLLEGE OF ENDOCRINOLOGY GUIDELINES FOR MANAGEMENT OF DYSLIPIDEMIA AND PREVENTION OF CARDIOVASCULAR DISEASE.” Endocrine practice : official journal of the American College of Endocrinology and the American Association of Clinical Endocrinologists vol. 23,Suppl 2 (2017): 1-87. doi:10.4158/EP171764.APPGL
Lee, Wei-Ju et al. “Sex-different associations between serum homocysteine, high-sensitivity C-reactive protein and sarcopenia: Results from I-Lan Longitudinal Aging Study.” Experimental gerontology vol. 132 (2020): 110832. doi:10.1016/j.exger.2020.110832
Li, Yunwei et al. “Hs-CRP and all-cause, cardiovascular, and cancer mortality risk: A meta-analysis.” Atherosclerosis vol. 259 (2017): 75-82. doi:10.1016/j.atherosclerosis.2017.02.003
Nehring, Sara M., et al. “C Reactive Protein.” StatPearls, StatPearls Publishing, 10 May 2021.
Pagana, Kathleen Deska, et al. Mosby's Diagnostic and Laboratory Test Reference. 15th ed., Mosby, 2021.
Pahwa, Roma, et al. “Chronic Inflammation.” StatPearls, StatPearls Publishing, 8 August 2022.
Swastini, Dewa Ayu et al. “Atherosclerosis Prediction with High Sensitivity C-Reactive Protein (hs-CRP) and Related Risk Factor in Patient with Dyslipidemia.” Open access Macedonian journal of medical sciences vol. 7,22 3887-3890. 14 Nov. 2019, doi:10.3889/oamjms.2019.526
Tutuncu, Yildiz et al. “A Comparison of hs-CRP Levels in New Diabetes Groups Diagnosed Based on FPG, 2-hPG, or HbA1c Criteria.” Journal of diabetes research vol. 2016 (2016): 5827041. doi:10.1155/2016/5827041
Qiao, Juan et al. “Correlation of clinical features with hs-CRP in TRD patients.” Experimental and therapeutic medicine vol. 17,1 (2019): 344-348. doi:10.3892/etm.2018.6914
Yu, En et al. “Inflammatory Biomarkers and Risk of Atherosclerotic Cardiovascular Disease.” Open medicine (Warsaw, Poland) vol. 13 208-213. 24 May. 2018, doi:10.1515/med-2018-0032
Homocysteine
Homocysteine is an amino acid involved in methionine metabolism and its accumulation can lead to damage of blood vessels, inflammation, and various cardiovascular and cerebrovascular diseases. The most common cause of its elevation is a deficiency in vitamins B6, B12, or folate. High levels of homocysteine can also be associated with increased oxidative stress, inflammation, cognitive decline, arterial stiffness, and hypertension. Certain drugs, such as nitrous oxide, phenytoin, methotrexate, and carbamazepine, can increase homocysteine levels. On the other hand, very low homocysteine may compromise glutathione status, increase oxidative stress, and contribute to pathology such as peripheral neuropathy.
OPTIMAL DX MEMBERS CLICK HERE for more information on Homocysteine
References
Foscolou, Alexandra et al. “The association between homocysteine levels, Mediterranean diet and cardiovascular disease: a case-control study.” International journal of food sciences and nutrition vol. 70,5 (2019): 603-611. doi:10.1080/09637486.2018.1547688
Ganguly, Paul, and Sreyoshi Fatima Alam. “Role of homocysteine in the development of cardiovascular disease.” Nutrition journal vol. 14 6. 10 Jan. 2015, doi:10.1186/1475-2891-14-6
Kim, Byung Jin et al. “Associations of plasma homocysteine levels with arterial stiffness in prehypertensive individuals.” Clinical and experimental hypertension (New York, N.Y. : 1993) vol. 33,6 (2011): 411-7. doi:10.3109/10641963.2010.549274
Kumar, Avinash et al. “The metabolism and significance of homocysteine in nutrition and health.” Nutrition & metabolism vol. 14 78. 22 Dec. 2017, doi:10.1186/s12986-017-0233-z
Lee, Wei-Ju et al. “Sex-different associations between serum homocysteine, high-sensitivity C-reactive protein and sarcopenia: Results from I-Lan Longitudinal Aging Study.” Experimental gerontology vol. 132 (2020): 110832. doi:10.1016/j.exger.2020.110832
Lim, Unhee, and Patricia A Cassano. “Homocysteine and blood pressure in the Third National Health and Nutrition Examination Survey, 1988-1994.” American journal of epidemiology vol. 156,12 (2002): 1105-13. doi:10.1093/aje/kwf157
Pagana, Kathleen Deska, et al. Mosby's Diagnostic and Laboratory Test Reference. 15th ed., Mosby, 2021.
Panagiotakos, Demosthenes B et al. “The association between lifestyle-related factors and plasma homocysteine levels in healthy individuals from the "ATTICA" Study.” International journal of cardiology vol. 98,3 (2005): 471-7. doi:10.1016/j.ijcard.2003.12.036
Peng, You-Fan, and Guo-Gang Pan. “Red blood cell distribution width predicts homocysteine levels in adult population without vitamin B12 and folate deficiencies.” International journal of cardiology vol. 227 (2017): 8-10. doi:10.1016/j.ijcard.2016.11.012
Pizzorno, Joseph. “Homocysteine: Friend or Foe?.” Integrative medicine (Encinitas, Calif.) vol. 13,4 (2014): 8-14.
Pusceddu, Irene et al. “Subclinical inflammation, telomere shortening, homocysteine, vitamin B6, and mortality: the Ludwigshafen Risk and Cardiovascular Health Study.” European journal of nutrition vol. 59,4 (2020): 1399-1411. doi:10.1007/s00394-019-01993-8
Smith, A David, and Helga Refsum. “Homocysteine, B Vitamins, and Cognitive Impairment.” Annual review of nutrition vol. 36 (2016): 211-39. doi:10.1146/annurev-nutr-071715-050947
Travica, Nikolaj, et al. "Integrative Health Check reveals suboptimal levels in a number of vital biomarkers." Advances in integrative medicine 2.3 (2015): 135-140
Erythrocyte Sedimentation Rate (ESR)
The erythrocyte sedimentation rate (ESR), or "sed rate," is a non-specific marker that measures how quickly red blood cells settle in a blood sample, which can indicate disease activity. Elevated ESR can occur in conditions like cancer, infection, inflammation, metabolic syndrome, and necrosis, and it can be influenced by lifestyle factors such as smoking, obesity, and lack of physical activity. Conversely, ESR can decrease in conditions like sickle cell anemia, thalassemia, and low fibrinogen, and certain drugs like cortisone, aspirin, and quinine can also lower it. While ESR is not highly sensitive or specific, when used alongside other markers like C-reactive protein (CRP), it can provide valuable insights into the presence and progression of diseases, particularly inflammatory autoimmune disorders.
Male: 0.00 - 15.00 mm/hr
Female: 0.00 - 20.00 mm/hr
Male: 0.00 - 5.00 mm/hr
Female: 0.00 - 10.00 mm/hr
References
Alende-Castro, Vanessa et al. “Factors influencing erythrocyte sedimentation rate in adults: New evidence for an old test.” Medicine vol. 98,34 (2019): e16816. doi:10.1097/MD.0000000000016816
Bingham, Joshua S et al. “Screening for Periprosthetic Joint Infections With ESR and CRP: The Ideal Cutoffs.” The Journal of arthroplasty vol. 35,5 (2020): 1351-1354. doi:10.1016/j.arth.2019.11.040
Lapic, Ivana et al. “Erythrocyte Sedimentation Rate and C-Reactive Protein in Acute Inflammation.” American journal of clinical pathology vol. 153,1 (2020): 14-29. doi:10.1093/ajcp/aqz142
Pagana, Kathleen Deska, et al. Mosby's Diagnostic and Laboratory Test Reference. 15th ed., Mosby, 2021.
van Atteveld, Vera A et al. “Erythrocyte sedimentation rate and albumin as markers of inflammation are associated with measures of sarcopenia: a cross-sectional study.” BMC geriatrics vol. 19,1 233. 27 Aug. 2019, doi:10.1186/s12877-019-1253-5
D-Dimer
D-dimer is a compound that forms when a blood clot breaks down, and its level indicates the degree of blood clotting occurring in the body. Elevated D-dimer levels can indicate conditions like deep vein thrombosis (DVT), pulmonary embolism, disseminated intravascular coagulation (DIC), and are also associated with inflammation, cardiovascular disease, and serious infections like COVID-19. Conversely, low to non-detectable levels of D-dimer are generally considered normal, suggesting the absence of conditions like thrombosis, DVT, and pulmonary embolism. D-dimer can thus be a valuable marker in monitoring anticoagulation therapy and assessing the prognosis of diseases.
OPTIMAL DX MEMBERS CLICK HERE for more information on D-Dimer
References
Johnson, Eric D et al. “The D-dimer assay.” American journal of hematology vol. 94,7 (2019): 833-839. doi:10.1002/ajh.25482
Pagana, Kathleen Deska, et al. Mosby's Diagnostic and Laboratory Test Reference. 15th ed., Mosby, 2021.
Tripodi, Armando. “D-dimer testing in laboratory practice.” Clinical chemistry vol. 57,9 (2011): 1256-62. doi:10.1373/clinchem.2011.166249
Zhang, Litao et al. “D-dimer levels on admission to predict in-hospital mortality in patients with Covid-19.” Journal of thrombosis and haemostasis : JTH vol. 18,6 (2020): 1324-1329. doi:10.1111/jth.14859
Asymmetric Dimethylarginine (ADMA)
Standard Range: 0.00 – 123.00 ng/mL (0.00 – 0.61 µmol/L)
The ODX Range: 0.00 – 100.00 ng/mL (0.00 - 0.50 µmol/L)
References
Appleton, Jeremy. “Arginine: Clinical potential of a semi-essential amino acid..” Alternative medicine review : a journal of clinical therapeutic vol. 7,6 (2002): 512-22.
Arlouskaya, Yana et al. “Asymmetric Dimethylarginine (ADMA) and Symmetric Dimethylarginine (SDMA) Concentrations in Patients with Obesity and the Risk of Obstructive Sleep Apnea (OSA).” Journal of clinical medicine vol. 8,6 897. 23 Jun. 2019, doi:10.3390/jcm8060897
Gamil, Sahar et al. “Increased Serum Levels of Asymmetric Dimethylarginine and Symmetric Dimethylarginine and Decreased Levels of Arginine in Sudanese Patients with Essential Hypertension.” Kidney & blood pressure research vol. 45,5 (2020): 727-736. doi:10.1159/000508695
Goudhaman, Lakshmi et al. “Association of Serum Asymmetric Dimethylarginine with the Severity of Coronary Artery Disease: A Pilot Study.” Reports of biochemistry & molecular biology vol. 10,2 (2021): 302-306. doi:10.52547/rbmb.10.2.302
Khan, Mushfiquddin et al. “Asymmetric dimethylarginine-induced oxidative damage leads to cerebrovascular dysfunction.” Neural regeneration research vol. 16,9 (2021): 1793-1794. doi:10.4103/1673-5374.306080
McLaughlin, Tracey et al. “Plasma asymmetric dimethylarginine concentrations are elevated in obese insulin-resistant women and fall with weight loss.” The Journal of clinical endocrinology and metabolism vol. 91,5 (2006): 1896-900. doi:10.1210/jc.2005-1441
Nemeth, Balázs et al. “The issue of plasma asymmetric dimethylarginine reference range - A systematic review and meta-analysis.” PloS one vol. 12,5 e0177493. 11 May. 2017, doi:10.1371/journal.pone.0177493. This is an open access article distributed under the terms of the Creative Commons Attribution License
Oliva-Damaso, Elena et al. “Asymmetric (ADMA) and Symmetric (SDMA) Dimethylarginines in Chronic Kidney Disease: A Clinical Approach.” International journal of molecular sciences vol. 20,15 3668. 26 Jul. 2019, doi:10.3390/ijms20153668
Servillo, Luigi et al. “The methylarginines NMMA, ADMA, and SDMA are ubiquitous constituents of the main vegetables of human nutrition.” Nitric oxide : biology and chemistry vol. 30 (2013): 43-8. doi:10.1016/j.niox.2013.02.080
Stuhlinger, Markus C et al. “Relationship between insulin resistance and an endogenous nitric oxide synthase inhibitor.” JAMA vol. 287,11 (2002): 1420-6. doi:10.1001/jama.287.11.1420
Tain, You-Lin, and Chien-Ning Hsu. Toxic Dimethylarginines: Asymmetric Dimethylarginine (ADMA) and Symmetric Dimethylarginine (SDMA).” Toxins vol. 9,3 92. 6 Mar. 2017, doi:10.3390/toxins9030092
Willeit, Peter et al. “Asymmetric dimethylarginine and cardiovascular risk: systematic review and meta-analysis of 22 prospective studies.” Journal of the American Heart Association vol. 4,6 e001833. 28 May. 2015, doi:10.1161/JAHA.115.001833
Zafari, Parisa et al. “Asymmetric and symmetric dimethylarginine concentration as an indicator of cardiovascular diseases in rheumatoid arthritis patients: a systematic review and meta-analysis of case-control studies.” Clinical rheumatology vol. 39,1 (2020): 127-134. doi:10.1007/s10067-019-04713-z
Symmetric Dimethylarginine (SDMA)
Standard Range: 73 - 135 ng/mL (0.36 – 0.67 µmol/L)
The ODX Range: 0.00 – 135 ng/mL (0.00 – 0.67 µmol/L)
References
Gamil, Sahar et al. “Increased Serum Levels of Asymmetric Dimethylarginine and Symmetric Dimethylarginine and Decreased Levels of Arginine in Sudanese Patients with Essential Hypertension.” Kidney & blood pressure research vol. 45,5 (2020): 727-736. doi:10.1159/000508695
Oliva-Damaso, Elena et al. “Asymmetric (ADMA) and Symmetric (SDMA) Dimethylarginines in Chronic Kidney Disease: A Clinical Approach.” International journal of molecular sciences vol. 20,15 3668. 26 Jul. 2019, doi:10.3390/ijms20153668
Schepers, Eva et al. “Symmetric dimethylarginine as a proinflammatory agent in chronic kidney disease.” Clinical journal of the American Society of Nephrology : CJASN vol. 6,10 (2011): 2374-83. doi:10.2215/CJN.01720211
Schlesinger, Sabrina et al. “Asymmetric and Symmetric Dimethylarginine as Risk Markers for Total Mortality and Cardiovascular Outcomes: A Systematic Review and Meta-Analysis of Prospective Studies.” PloS one vol. 11,11 e0165811. 3 Nov. 2016, doi:10.1371/journal.pone.0165811
Tain, You-Lin, and Chien-Ning Hsu. Toxic Dimethylarginines: Asymmetric Dimethylarginine (ADMA) and Symmetric Dimethylarginine (SDMA).” Toxins vol. 9,3 92. 6 Mar. 2017, doi:10.3390/toxins9030092
Winkler, Martin Sebastian et al. “Symmetrical (SDMA) and asymmetrical dimethylarginine (ADMA) in sepsis: high plasma levels as combined risk markers for sepsis survival.” Critical care (London, England) vol. 22,1 216. 19 Sep. 2018, doi:10.1186/s13054-018-2090-1
Trimethylamine N-oxide (TMAO)
Standard Range: 0.00 – 6 µM
The ODX Range: 0.00 – 3.7 µM
References
Cleveland Heart Lab. TMA Ohttps://www.clevelandheartlab.com/wp-content/uploads/2018/11/CHL-D074-AUG2018-TMAO-Practitioner-One-Pager.pdf
Gatarek, Paulina, and Joanna Kaluzna-Czaplinska. “Trimethylamine N-oxide (TMAO) in human health.” EXCLI journal vol. 20 301-319. 11 Feb. 2021, doi:10.17179/excli2020-3239
Gungor, Ozkan et al. “Trimethylamine N-oxide and kidney diseases: what do we know?.” Jornal brasileiro de nefrologia, S0101-28002023005046502. 1 Dec. 2023, doi:10.1590/2175-8239-JBN-2023-0065en
Kelly, R H, and P H Yancey. “High contents of trimethylamine oxide correlating with depth in deep-sea teleost fishes, skates, and decapod crustaceans.” The Biological bulletin vol. 196,1 (1999): 18-25. doi:10.2307/1543162
Koeth, Robert A et al. “Intestinal microbiota metabolism of L-carnitine, a nutrient in red meat, promotes atherosclerosis.” Nature medicine vol. 19,5 (2013): 576-85. doi:10.1038/nm.3145
Krishnan, Sridevi et al. “Adopting a Mediterranean-style eating pattern with low, but not moderate, unprocessed, lean red meat intake reduces fasting serum trimethylamine N-oxide (TMAO) in adults who are overweight or obese.” The British journal of nutrition, vol. 128,9 1-21. 26 Nov. 2021, doi:10.1017/S0007114521004694
Krüger, Ralf et al. “Associations of current diet with plasma and urine TMAO in the KarMeN study: direct and indirect contributions.” Molecular nutrition & food research vol. 61,11 (2017): 10.1002/mnfr.201700363. doi:10.1002/mnfr.201700363
Li, Daniel et al. “Listening to Our Gut: Contribution of Gut Microbiota and Cardiovascular Risk in Diabetes Pathogenesis.” Current diabetes reports vol. 15,9 (2015): 63. doi:10.1007/s11892-015-0634-1
Tacconi, Edoardo et al. “Microbiota Effect on Trimethylamine N-Oxide Production: From Cancer to Fitness-A Practical Preventing Recommendation and Therapies.” Nutrients vol. 15,3 563. 21 Jan. 2023, doi:10.3390/nu15030563
Tang, W H Wilson et al. “Intestinal microbial metabolism of phosphatidylcholine and cardiovascular risk.” The New England journal of medicine vol. 368,17 (2013): 1575-84. doi:10.1056/NEJMoa1109400
Tang, W H Wilson et al. “Plasma trimethylamine N-oxide (TMAO) levels predict future risk of coronary artery disease in apparently healthy individuals in the EPIC-Norfolk prospective population study.” American heart journal vol. 236 (2021): 80-86. doi:10.1016/j.ahj.2021.01.020
Thomas, Minu S, and Maria Luz Fernandez. “Trimethylamine N-Oxide (TMAO), Diet and Cardiovascular Disease.” Current atherosclerosis reports vol. 23,4 12. 17 Feb. 2021, doi:10.1007/s11883-021-00910-x
Treberg, Jason R, and William R Driedzic. “Elevated levels of trimethylamine oxide in deep-sea fish: evidence for synthesis and intertissue physiological importance.” The Journal of experimental zoology vol. 293,1 (2002): 39-45. doi:10.1002/jez.10109
Velasquez, Manuel T et al. “Trimethylamine N-Oxide: The Good, the Bad and the Unknown.” Toxins vol. 8,11 326. 8 Nov. 2016, doi:10.3390/toxins8110326
Wang, Zeneng et al. “Gut flora metabolism of phosphatidylcholine promotes cardiovascular disease.” Nature vol. 472,7341 (2011): 57-63. doi:10.1038/nature09922
Wilcox, Jennifer et al. “Dietary Choline Supplements, but Not Eggs, Raise Fasting TMAO Levels in Participants with Normal Renal Function: A Randomized Clinical Trial.” The American journal of medicine vol. 134,9 (2021): 1160-1169.e3. doi:10.1016/j.amjmed.2021.03.016
Zhu, Weifei et al. “Gut Microbe-Generated Trimethylamine N-Oxide From Dietary Choline Is Prothrombotic in Subjects.” Circulation vol. 135,17 (2017): 1671-1673. doi:10.1161/CIRCULATIONAHA.116.025338
Glutathione, Total
Standard Range: 373 - 838 µM
The ODX Range: 373 - 838 µM
References
Damy, Thibaud et al. “Glutathione deficiency in cardiac patients is related to the functional status and structural cardiac abnormalities.” PloS one vol. 4,3 (2009): e4871. doi:10.1371/journal.pone.0004871
Gurer-Orhan, Hande et al. “Correlation between clinical indicators of lead poisoning and oxidative stress parameters in controls and lead-exposed workers.” Toxicology vol. 195,2-3 (2004): 147-54. doi:10.1016/j.tox.2003.09.009
Iskusnykh, Igor Y et al. “Glutathione in Brain Disorders and Aging.” Molecules (Basel, Switzerland) vol. 27,1 324. 5 Jan. 2022, doi:10.3390/molecules27010324
Kalsi, Sarbjeet S et al. “A review of the evidence concerning hepatic glutathione depletion and susceptibility to hepatotoxicity after paracetamol overdose.” Open access emergency medicine : OAEM vol. 3 87-96. 23 Dec. 2011, doi:10.2147/OAEM.S24963
Karkhanei, B et al. “Evaluation of oxidative stress level: total antioxidant capacity, total oxidant status
and glutathione activity in patients with COVID-19.” New microbes and new infections vol. 42 (2021): 100897. doi:10.1016/j.nmni.2021.100897
Kobayashi, Akie et al. “Dyserythropoietic anaemia with an intronic GATA1 splicing mutation in patients suspected to have Diamond-Blackfan anaemia.” EJHaem vol. 3,1 163-167. 10 Jan. 2022, doi:10.1002/jha2.374
Lang, Calvin A et al. “High blood glutathione levels accompany excellent physical and mental health in women ages 60 to 103 years.” The Journal of laboratory and clinical medicine vol. 140,6 (2002): 413-7. doi:10.1067/mlc.2002.129504
Lizzo, Giulia et al. “A Randomized Controlled Clinical Trial in Healthy Older Adults to Determine Efficacy of Glycine and N-Acetylcysteine Supplementation on Glutathione Redox Status and Oxidative Damage.” Frontiers in aging vol. 3 852569. 7 Mar. 2022, doi:10.3389/fragi.2022.852569
Mayo Clinic, Glutathione, Blood. https://www.mayocliniclabs.com/test-catalog/overview/608409#Clinical-and-Interpretive
Minich, Deanna M, and Benjamin I Brown. “A Review of Dietary (Phyto)Nutrients for Glutathione Support.” Nutrients vol. 11,9 2073. 3 Sep. 2019, doi:10.3390/nu11092073
Park, Sang-A et al. “A Preliminary Study on the Potential Protective Role of the Antioxidative Stress Markers of Cognitive Impairment: Glutathione and Glutathione Reductase.” Clinical psychopharmacology and neuroscience : the official scientific journal of the Korean College of Neuropsychopharmacology vol. 21,4 (2023): 758-768. doi:10.9758/cpn.23.1053
Perez, Laura M et al. “Glutathione Serum Levels and Rate of Multimorbidity Development in Older Adults.” The journals of gerontology. Series A, Biological sciences and medical sciences vol. 75,6 (2020): 1089-1094. doi:10.1093/gerona/glz101
Pizzorno, Joseph. “Glutathione!.” Integrative medicine (Encinitas, Calif.) vol. 13,1 (2014): 8-12.
Richie, John P Jr et al. “Randomized controlled trial of oral glutathione supplementation on body stores of glutathione.” European journal of nutrition vol. 54,2 (2015): 251-63. doi:10.1007/s00394-014-0706-z
Traverso, Nicola et al. “Role of glutathione in cancer progression and chemoresistance.” Oxidative medicine and cellular longevity vol. 2013 (2013): 972913. doi:10.1155/2013/972913
Vacchi-Suzzi, Caterina et al. “Low levels of lead and glutathione markers of redox status in human blood.” Environmental geochemistry and health vol. 40,4 (2018): 1175-1185. doi:10.1007/s10653-017-0034-3
Waly, Mostafa I et al. “Low Nourishment of Vitamin C Induces Glutathione Depletion and Oxidative Stress in Healthy Young Adults.” Preventive nutrition and food science vol. 20,3 (2015): 198-203. doi:10.3746/pnf.2015.20.3.198
Platelet:Lymphocyte Ratio (PLR)
References
Johnson, Eric D et al. “The D-dimer assay.” American journal of hematology vol. 94,7 (2019): 833-839. doi:10.1002/ajh.25482
Pagana, Kathleen Deska, et al. Mosby's Diagnostic and Laboratory Test Reference. 15th ed., Mosby, 2021.
Tripodi, Armando. “D-dimer testing in laboratory practice.” Clinical chemistry vol. 57,9 (2011): 1256-62. doi:10.1373/clinchem.2011.166249
Zhang, Litao et al. “D-dimer levels on admission to predict in-hospital mortality in patients with Covid-19.” Journal of thrombosis and haemostasis : JTH vol. 18,6 (2020): 1324-1329. doi:10.1111/jth.14859
Neutrophil:Lymphocyte Ratio (NLR)
OPTIMAL DX MEMBERS CLICK HERE for more information on Neutrophil:Lymphocyte Ratio
References
Afari, Maxwell E, and Tariq Bhat. “Neutrophil to lymphocyte ratio (NLR) and cardiovascular diseases: an update.” Expert review of cardiovascular therapy vol. 14,5 (2016): 573-7. doi:10.1586/14779072.2016.1154788
Bowen, Randy C et al. “Neutrophil-to-lymphocyte ratio as prognostic indicator in gastrointestinal cancers: a systematic review and meta-analysis.” Oncotarget vol. 8,19 (2017): 32171-32189. doi:10.18632/oncotarget.16291
Davis JL, Moutinho V Jr, Panageas KS, Coit DG. A peripheral blood biomarker estimates probability of survival: the neutrophil-lymphocyte ratio in noncancer patients. Biomark Med. 2016 Sep;10(9):953-7.
Faria, Sara Socorro et al. “The neutrophil-to-lymphocyte ratio: a narrative review.” Ecancermedicalscience vol. 10 702. 12 Dec. 2016, doi:10.3332/ecancer.2016.702
Farkas, Joshua David. “The complete blood count to diagnose septic shock.” Journal of thoracic disease vol. 12,Suppl 1 (2020): S16-S21. doi:10.21037/jtd.2019.12.63
Fest, Jesse et al. “Reference values for white blood-cell-based inflammatory markers in the Rotterdam Study: a population-based prospective cohort study.” Scientific reports vol. 8,1 10566. 12 Jul. 2018, doi:10.1038/s41598-018-28646-w
Forget P, Khalifa C, Defour JP, et al. What is the normal value of the neutrophil-to-lymphocyte ratio? BMC Res Notes. 2017 Jan 3;10(1):12.
Giynas Ayhan, Medine, et al. "Neutrophil/lymphocyte and platelet/lymphocyte ratios in all mood states of bipolar disorder." Psychiatry and Clinical Psychopharmacology 27.3 (2017): 278-282.
Guasti, Luigina et al. “Neutrophils and clinical outcomes in patients with acute coronary syndromes and/or cardiac revascularisation. A systematic review on more than 34,000 subjects.” Thrombosis and haemostasis vol. 106,4 (2011): 591-9. doi:10.1160/TH11-02-0096
Gürağaç, Ali, and Zafer Demirer. “The neutrophil-to-lymphocyte ratio in clinical practice.” Canadian Urological Association journal = Journal de l'Association des urologues du Canada vol. 10,3-4 (2016): 141. doi:10.5489/cuaj.3587
Gürel, Ozgul Malcok, et al. "Association between red blood cell distribution width and coronary artery calcification in patients undergoing 64-multidetector computed tomography." Korean circulation journal 45.5 (2015): 372-377.
Guthrie, Graeme J K et al. “The systemic inflammation-based neutrophil-lymphocyte ratio: experience in patients with cancer.” Critical reviews in oncology/hematology vol. 88,1 (2013): 218-30. doi:10.1016/j.critrevonc.2013.03.010
Halazun, Hadi J et al. “Neutrophil-lymphocyte ratio as a predictor of cognitive dysfunction in carotid endarterectomy patients.” Journal of vascular surgery vol. 59,3 (2014): 768-73. doi:10.1016/j.jvs.2013.08.095
Horne, Benjamin D et al. “Which white blood cell subtypes predict increased cardiovascular risk?.” Journal of the American College of Cardiology vol. 45,10 (2005): 1638-43. doi:10.1016/j.jacc.2005.02.054
Imtiaz, Fauzia et al. “Neutrophil lymphocyte ratio as a measure of systemic inflammation in prevalent chronic diseases in Asian population.” International archives of medicine vol. 5,1 2. 26 Jan. 2012, doi:10.1186/1755-7682-5-2
Kim, Stephanie et al. “Association of Neutrophil-to-Lymphocyte Ratio With Mortality and Cardiovascular Disease in the Jackson Heart Study and Modification by the Duffy Antigen Variant.” JAMA cardiology vol. 3,6 (2018): 455-462. doi:10.1001/jamacardio.2018.1042
Koc, Ibrahim, and Sevda Unalli Ozmen. “Eosinophil Levels, Neutrophil-Lymphocyte Ratio, and Platelet-Lymphocyte Ratio in the Cytokine Storm Period of Patients with COVID-19.” International journal of clinical practice vol. 2022 7450739. 3 Aug. 2022, doi:10.1155/2022/7450739
Kuyumcu, Mehmet Emin et al. “The evaluation of neutrophil-lymphocyte ratio in Alzheimer's disease.” Dementia and geriatric cognitive disorders vol. 34,2 (2012): 69-74. doi:10.1159/000341583
Lee, Jeong Soo et al. “Reference values of neutrophil-lymphocyte ratio, lymphocyte-monocyte ratio, platelet-lymphocyte ratio, and mean platelet volume in healthy adults in South Korea.” Medicine vol. 97,26 (2018): e11138. doi:10.1097/MD.0000000000011138
Martínez-Urbistondo, Diego et al. “The neutrophil-to-lymphocyte ratio as a marker of systemic endothelial dysfunction in asymptomatic subjects.” Nefrologia : publicacion oficial de la Sociedad Espanola Nefrologia vol. 36,4 (2016): 397-403. doi:10.1016/j.nefro.2015.10.018
Mazza, Mario Gennaro et al. “Neutrophil/lymphocyte ratio and platelet/lymphocyte ratio in mood disorders: A meta-analysis.” Progress in neuro-psychopharmacology & biological psychiatry vol. 84,Pt A (2018): 229-236. doi:10.1016/j.pnpbp.2018.03.012
McBurney, Michael I et al. “The omega-3 index is inversely associated with the neutrophil-lymphocyte ratio in adults'.” Prostaglandins, leukotrienes, and essential fatty acids vol. 177 (2022): 102397. doi:10.1016/j.plefa.2022.102397
McNamara, M G et al. “Neutrophil/lymphocyte ratio as a prognostic factor in biliary tract cancer.” European journal of cancer (Oxford, England : 1990) vol. 50,9 (2014): 1581-9. doi:10.1016/j.ejca.2014.02.015
Naess, Are et al. “Role of neutrophil to lymphocyte and monocyte to lymphocyte ratios in the diagnosis of bacterial infection in patients with fever.” Infection vol. 45,3 (2017): 299-307. doi:10.1007/s15010-016-0972-1
Rembach, Alan et al. “An increased neutrophil-lymphocyte ratio in Alzheimer's disease is a function of age and is weakly correlated with neocortical amyloid accumulation.” Journal of neuroimmunology vol. 273,1-2 (2014): 65-71. doi:10.1016/j.jneuroim.2014.05.005
Sahin, Azad Gazi et al. “Predictive Value of Preoperative Neutrophil Lymphocyte Ratio in Determining the Stage of Gastric Tumor.” Medical science monitor : international medical journal of experimental and clinical research vol. 23 1973-1979. 24 Apr. 2017, doi:10.12659/msm.900681
Uysal, Hilal Bektas et al. “Blood count parameters can predict the severity of coronary artery disease.” The Korean journal of internal medicine vol. 31,6 (2016): 1093-1100. doi:10.3904/kjim.2015.199
Venkatraghavan, Lashmi et al. “Neutrophil Lymphocyte Ratio as a predictor of systemic inflammation - A cross-sectional study in a pre-admission setting.” F1000Research vol. 4 123. 22 May. 2015, doi:10.12688/f1000research.6474.1
Wang, Huan et al. “The relationship between neutrophil to lymphocyte ratio and artery stiffness in subtypes of hypertension.” Journal of clinical hypertension (Greenwich, Conn.) vol. 19,8 (2017): 780-785. doi:10.1111/jch.13002
Wang, Yuchen et al. “Evaluation of the prognostic value of neutrophil to lymphocyte ratio in patients with hypertriglyceridemia-induced acute pancreatitis.” Pancreatology : official journal of the International Association of Pancreatology (IAP) ... [et al.] vol. 17,6 (2017): 893-897. doi:10.1016/j.pan.2017.10.001
Zahorec, R. “Ratio of neutrophil to lymphocyte counts--rapid and simple parameter of systemic inflammation and stress in critically ill.” Bratislavske lekarske listy vol. 102,1 (2001): 5-14.
Histamine
Histamine is a bioactive compound involved in immune inflammatory reactions, allergies, vasoactivation, gastric acid secretion, and blood cell formation. High histamine levels can cause classic symptoms such as sneezing, congestion, rash, bloating, nausea, vomiting, diarrhea, headache, dizziness, and low blood pressure. Histamine intolerance is associated with GI disorders, including IBD, IBS, celiac disease, and reduced production or activity of diamine oxidase, the enzyme that breaks down intestinal histamine. A low histamine level may not be considered clinically relevant.
Histamine, Plasma
Histamine, Whole Blood
OPTIMAL DX MEMBERS CLICK HERE for more information on Histamine
References
Clemetson, C A. “Histamine and ascorbic acid in human blood.” The Journal of nutrition vol. 110,4 (1980): 662-8. doi:10.1093/jn/110.4.662
Comas-Basté, Oriol et al. “Histamine Intolerance: The Current State of the Art.” Biomolecules vol. 10,8 1181. 14 Aug. 2020, doi:10.3390/biom10081181
Haimart, M et al. “Whole blood and plasma histamine in common migraine.” Cephalalgia : an international journal of headache vol. 7,1 (1987): 39-42. doi:10.1046/j.1468-2982.1987.0701039.x
Jackson, James A. et al. “HISTAMINE LEVELS IN HEALTH AND DISEASE.” Journal of Orthomolecular Medicine 13 (1998): 236-240.
Jochum, Christoph. “Histamine Intolerance: Symptoms, Diagnosis, and Beyond.” Nutrients vol. 16,8 1219. 19 Apr. 2024, doi:10.3390/nu16081219
Kakolyri, Maria et al. “Increased Basal Blood Histamine Levels in Patients with Self-Reported Hypersensitivity to Non-Steroidal Anti-Inflammatory Drugs.” International archives of allergy and immunology vol. 181,1 (2020): 24-30. doi:10.1159/000503968
Kaliner, M et al. “Effects of infused histamine: correlation of plasma histamine levels and symptoms.” The Journal of allergy and clinical immunology vol. 69,3 (1982): 283-9. doi:10.1016/s0091-6749(82)80005-5
Lin, R Y et al. “Histamine and tryptase levels in patients with acute allergic reactions: An emergency department-based study.” The Journal of allergy and clinical immunology vol. 106,1 Pt 1 (2000): 65-71. doi:10.1067/mai.2000.107600
Patel, Raj H. and Shamim S. Mohiuddin. “Biochemistry, Histamine.” StatPearls, StatPearls Publishing, 1 May 2023. This book is distributed under the terms of the Creative Commons Attribution-NonCommercial-NoDerivatives 4.0 International (CC BY-NC-ND 4.0) ( http://creativecommons.org/licenses/by-nc-nd/4.0/
Ramanujan, Suruchi, et al. "Vitamin C: Is it Relevant or Obsolete in the Modern Era?." Current Pediatrics Reports (2024): 1-9.
Schnedl, Wolfgang J, and Dietmar Enko. “Histamine Intolerance Originates in the Gut.” Nutrients vol. 13,4 1262. 12 Apr. 2021, doi:10.3390/nu13041262
Smolinska, Sylwia et al. “Histamine: A Mediator of Intestinal Disorders-A Review.” Metabolites vol. 12,10 895. 23 Sep. 2022, doi:10.3390/metabo12100895
Coenzyme Q10 (CoQ10)
Coenzyme Q10 (CoQ10) is a vital compound with powerful antioxidant and anti-inflammatory properties, essential for energy production in our cells. Its levels naturally decline with age and can be further reduced by statin medications and genetic factors, leading to fatigue, muscle weakness, neuroinflammation, oxidative stress, and increased risk of cardiometabolic diseases. Low CoQ10 is linked to conditions like heart failure, neurodegenerative diseases, muscle disorders, and metabolic issues. Supplementing with CoQ10 can restore its levels, improve symptoms, and reduce the health risks associated with its deficiency.
References
Hargreaves, Iain et al. “Disorders of Human Coenzyme Q10 Metabolism: An Overview.” International journal of molecular sciences vol. 21,18 6695. 13 Sep. 2020, doi:10.3390/ijms21186695
Hernandez-Camacho, Juan D et al. “Coenzyme Q10 Supplementation in Aging and Disease.” Frontiers in physiology vol. 9 44. 5 Feb. 2018, doi:10.3389/fphys.2018.00044
Hou, Shanshan et al. “Efficacy and Optimal Dose of Coenzyme Q10 Supplementation on Inflammation-Related Biomarkers: A GRADE-Assessed Systematic Review and Updated Meta-Analysis of Randomized Controlled Trials.” Molecular nutrition & food research vol. 67,13 (2023): e2200800. doi:10.1002/mnfr.202200800
Mantle, David et al. “Coenzyme Q10 Metabolism: A Review of Unresolved Issues.” International journal of molecular sciences vol. 24,3 2585. 30 Jan. 2023, doi:10.3390/ijms24032585
Mitsui, Jun et al. “High-dose ubiquinol supplementation in multiple-system atrophy: a multicentre, randomised, double-blinded, placebo-controlled phase 2 trial.” EClinicalMedicine vol. 59 101920. 14 Apr. 2023, doi:10.1016/j.eclinm.2023.101920
Qu, Hua et al. “Effects of Coenzyme Q10 on Statin-Induced Myopathy: An Updated Meta-Analysis of Randomized Controlled Trials.” Journal of the American Heart Association vol. 7,19 (2018): e009835. doi:10.1161/JAHA.118.009835
Rabanal-Ruiz, Yoana et al. “The Use of Coenzyme Q10 in Cardiovascular Diseases.” Antioxidants (Basel, Switzerland) vol. 10,5 755. 10 May. 2021, doi:10.3390/antiox10050755
Raizner, Albert E. “Coenzyme Q10.” Methodist DeBakey cardiovascular journal vol. 15,3 (2019): 185-191. doi:10.14797/mdcj-15-3-185
Sangsefidi, Zohreh Sadat et al. “The effect of coenzyme Q10 supplementation on oxidative stress: A systematic review and meta-analysis of randomized controlled clinical trials.” Food science & nutrition vol. 8,4 1766-1776. 19 Mar. 2020, doi:10.1002/fsn3.1492
Sood, Brittany, et al. “Coenzyme Q10.” StatPearls, StatPearls Publishing, 30 January 2024.
Testai, Lara et al. “Coenzyme Q10: Clinical Applications beyond Cardiovascular Diseases.” Nutrients vol. 13,5 1697. 17 May. 2021, doi:10.3390/nu13051697
Tsai, I-Chen et al. “Effectiveness of Coenzyme Q10 Supplementation for Reducing Fatigue: A Systematic Review and Meta-Analysis of Randomized Controlled Trials.” Frontiers in pharmacology vol. 13 883251. 24 Aug. 2022, doi:10.3389/fphar.2022.883251
Zhao, Dan et al. “Dose-Response Effect of Coenzyme Q10 Supplementation on Blood Pressure among Patients with Cardiometabolic Disorders: A Grading of Recommendations Assessment, Development, and Evaluation (GRADE)-Assessed Systematic Review and Meta-Analysis of Randomized Controlled Trials.” Advances in nutrition (Bethesda, Md.) vol. 13,6 (2022): 2180-2194. doi:10.1093/advances/nmac100
Atherogenic Index of Plasma (AIP)
The atherogenic index of plasma (AIP), determined by the ratio of triglycerides to HDL cholesterol, indicates the risk of cardiovascular diseases by reflecting the size and harmfulness of LDL particles. A higher AIP is associated with increased risks of heart attacks, stroke, diabetes, and various inflammatory conditions, while a lower AIP suggests a reduced risk. Adopting healthy lifestyle and dietary changes, such as improving nutrition and regular exercise, can effectively lower AIP and enhance overall metabolic health.
References
Çelik, Ersin et al. “The Effect of Untraditional Lipid Parameters in the Development of Coronary Artery Disease: Atherogenic Index of Plasma, Atherogenic Coefficient and Lipoprotein Combined Index.” Journal of the Saudi Heart Association vol. 33,3 244-250. 20 Sep. 2021, doi:10.37616/2212-5043.1266
Chen, Min et al. “Predictive value of atherogenic index of plasma and atherogenic index of plasma combined with low-density lipoprotein cholesterol for the risk of acute myocardial infarction.” Frontiers in cardiovascular medicine vol. 10 1117362. 26 May. 2023, doi:10.3389/fcvm.2023.1117362
Dobiásová, M. “AIP--aterogenní index plazmy jako významný prediktor kardiovaskulárního rizika: od výzkumu do praxe” [AIP--atherogenic index of plasma as a significant predictor of cardiovascular risk: from research to practice]. Vnitrni lekarstvi vol. 52,1 (2006): 64-71.
Dobiášová, M. “Atherogenic impact of lecithin-cholesterol acyltransferase and its relation to cholesterol esterification rate in HDL (FER(HDL)) and AIP [log(TG/HDL-C)] biomarkers: the butterfly effect?.” Physiological research vol. 66,2 (2017): 193-203. doi:10.33549/physiolres.933621
Huang, Qin et al. “The atherogenic index of plasma and carotid atherosclerosis in a community population: a population-based cohort study in China.” Cardiovascular diabetology vol. 22,1 125. 27 May. 2023, doi:10.1186/s12933-023-01839-y
Kammar-García, Ashuin et al. “Atherogenic index of plasma as a marker of cardiovascular risk factors in Mexicans aged 18 to 22 years.” Proceedings (Baylor University. Medical Center) vol. 34,1 22-27. 21 Aug. 2020, doi:10.1080/08998280.2020.1799479
Kim, Si Hyoung et al. “Association of the atherogenic index of plasma with cardiovascular risk beyond the traditional risk factors: a nationwide population-based cohort study.” Cardiovascular diabetology vol. 21,1 81. 22 May. 2022, doi:10.1186/s12933-022-01522-8
Lewis, Thomas J et al. “Reduction in Chronic Disease Risk and Burden in a 70-Individual Cohort Through Modification of Health Behaviors.” Cureus vol. 12,8 e10039. 26 Aug. 2020, doi:10.7759/cureus.10039
Li, Yen-Wei et al. “Atherogenic index of plasma as predictors for metabolic syndrome, hypertension and diabetes mellitus in Taiwan citizens: a 9-year longitudinal study.” Scientific reports vol. 11,1 9900. 10 May. 2021, doi:10.1038/s41598-021-89307-z
Shin, Hye Ran et al. “Atherogenic Index of Plasma and Its Association with Risk Factors of Coronary Artery Disease and Nutrient Intake in Korean Adult Men: The 2013-2014 KNHANES.” Nutrients vol. 14,5 1071. 3 Mar. 2022, doi:10.3390/nu14051071
Ulloque-Badaracco, Juan R et al. “Atherogenic index of plasma and coronary artery disease: A systematic review.” Open medicine (Warsaw, Poland) vol. 17,1 1915-1926. 6 Dec. 2022, doi:10.1515/med-2022-0590
Want to see the impact Optimal DX Software’s analytical, interpretive, and tracking functionality can have on your practice? Sign up for an ODX Account and find out for yourself.
Iron blood biomarkers are essential for assessing iron status, diagnosing iron-related disorders, and monitoring iron supplementation or therapy. Iron is a critical micronutrient required for various physiological processes, including oxygen transport, energy production, and DNA synthesis. Dysregulation of iron levels can lead to iron deficiency anemia, iron overload disorders such as hemochromatosis, and other health complications. Monitoring iron blood biomarkers is crucial to the evaluation of iron status and iron-related disorders and interventions.
Iron, Serum
Iron, an essential mineral, is mainly found in hemoglobin, and it helps bind oxygen to be transported throughout the body. Iron deficiency can lead to anemia, weakness, and fatigue. It is crucial for iron to be safely bound in the blood to avoid tissue and organ damage. Low serum iron levels may be associated with inadequate intake, increased requirements, blood loss, anemia, lead poisoning, or cognitive and behavioral dysfunction, while high levels can be linked to iron overload, hemolytic anemia, oxidative stress, and liver disease. Some medications can also affect serum iron levels.
References
Gropper, Sareen S.; Smith, Jack L.; Carr, Timothy P. Advanced Nutrition and Human Metabolism. 8th edition. Wadsworth Publishing Co Inc. 2021.
Hanif, Nazma. and Faiz Anwer. “Chronic Iron Deficiency.” StatPearls, StatPearls Publishing, 10 September 2022.
Hare, Dominic et al. “A delicate balance: Iron metabolism and diseases of the brain.” Frontiers in aging neuroscience vol. 5 34. 18 Jul. 2013, doi:10.3389/fnagi.2013.00034
Kim, Jonghan, and Marianne Wessling-Resnick. “Iron and mechanisms of emotional behavior.” The Journal of nutritional biochemistry vol. 25,11 (2014): 1101-1107. doi:10.1016/j.jnutbio.2014.07.003
Koenig, Gerald, and Stephanie Seneff. “Gamma-Glutamyltransferase: A Predictive Biomarker of Cellular Antioxidant Inadequacy and Disease Risk.” Disease markers vol. 2015 (2015): 818570. doi:10.1155/2015/818570
Kotze, M J et al. “Pathogenic Mechanisms Underlying Iron Deficiency and Iron Overload: New Insights for Clinical Application.” EJIFCC vol. 20,2 108-23. 25 Aug. 2009
Li, Yicheng et al. “Correlation Analysis Between Preoperative Serum Iron Level and Prognosis as Well as Recurrence of HCC After Radical Resection.” Cancer management and research vol. 12 31-41. 6 Jan. 2020, doi:10.2147/CMAR.S227418
Lin, Yilin et al. Wei sheng yan jiu = Journal of hygiene research vol. 50,5 (2021): 756-762. doi:10.19813/j.cnki.weishengyanjiu.2021.05.009
Pagana, Kathleen Deska, et al. Mosby's Diagnostic and Laboratory Test Reference. 16th ed., Mosby, 2022.
Penkova, Mariana, and Nadezhda Ivanova. “Serum Iron Metabolism Variables in Clinically Healthy Persons.” Open access Macedonian journal of medical sciences vol. 7,3 318-321. 7 Feb. 2019, doi:10.3889/oamjms.2019.083
Prentice, Andrew M et al. “Dietary strategies for improving iron status: balancing safety and efficacy.” Nutrition reviews vol. 75,1 (2017): 49-60. doi:10.1093/nutrit/nuw055
Tako, Elad. “Dietary Trace Minerals.” Nutrients vol. 11,11 2823. 19 Nov. 2019, doi:10.3390/nu11112823
Warner, Matthew J. and Muhammad T. Kamran. “Iron Deficiency Anemia.” StatPearls, StatPearls Publishing, 11 August 2021.
Wei, Yanyan et al. “Serum Iron Levels Decreased in Patients with HBV-Related Hepatocellular Carcinoma, as a Risk Factor for the Prognosis of HBV-Related HCC.” Frontiers in physiology vol. 9 66. 6 Feb. 2018, doi:10.3389/fphys.2018.00066
Ferritin
Ferritin is the primary iron storage protein, and its levels in the bloodstream generally mirror the body's iron stores. High ferritin levels can indicate iron overload or could be a response to inflammation, infection, cancer, or acute illness. Conversely, low levels can signify iron deficiency, severe protein deficiency, or conditions like vitamin C insufficiency, hypothyroidism, bariatric surgery, chronic blood loss, menstruation, hemodialysis, or hypoferritinemia without anemia. It's important to note that the association between ferritin levels and health risks such as cardiovascular disease and type 2 diabetes is not always straightforward and may vary by gender. Nevertheless, low ferritin levels have been associated with adverse outcomes and can be used to diagnose iron deficiency anemia in the absence of infection or inflammation.
Male 38 - 380 ng/mL (38– 380 µg/L)
Female 16 - 232 ng/mL (16 - 232 µg/L)
OPTIMAL DX MEMBERS CLICK HERE for more information on Ferritin
References
Al-Jafar, Hassan A. “HWA: Hypoferritinemia without anemia a hidden hematology disorder.” Journal of family medicine and primary care vol. 6,1 (2017): 69-72. doi:10.4103/2249-4863.214986
Asif, Naveed et al. “Diagnostic Accuracy of Serum Iron and Total Iron Binding Capacity (TIBC) in Iron Deficiency State.” Journal of the College of Physicians and Surgeons--Pakistan : JCPSP vol. 26,12 (2016): 958-961.
Bjørklund, Geir et al. “Iron Deficiency in Obesity and after Bariatric Surgery.” Biomolecules vol. 11,5 613. 21 Apr. 2021, doi:10.3390/biom11050613
Daru, Jahnavi et al. “Serum ferritin as an indicator of iron status: what do we need to know?.” The American journal of clinical nutrition vol. 106,Suppl 6 (2017): 1634S-1639S. doi:10.3945/ajcn.117.155960
DePalma, Ralph G et al. “Optimal serum ferritin level range: iron status measure and inflammatory biomarker.” Metallomics : integrated biometal science vol. 13,6 (2021): mfab030. doi:10.1093/mtomcs/mfab030
Dijkstra, Angelique et al. “Repeat whole blood donors with a ferritin level of 30 μg/L or less show functional iron depletion.” Transfusion vol. 59,1 (2019): 21-25. doi:10.1111/trf.14935
Friedrich, Nele et al. “Is serum ferritin within the reference range a risk predictor of cardiovascular disease? A population-based, long-term study comprising 2874 subjects.” The British journal of nutrition vol. 102,4 (2009): 594-600. doi:10.1017/S000711450922085X
Garofalo, Vincenzo et al. “Relationship between Iron Deficiency and Thyroid Function: A Systematic Review and Meta-Analysis.” Nutrients vol. 15,22 4790. 15 Nov. 2023, doi:10.3390/nu15224790
Kadoglou, Nikolaos P E et al. “The association of ferritin with cardiovascular and all-cause mortality in community-dwellers: The English longitudinal study of ageing.” PloS one vol. 12,6 e0178994. 7 Jun. 2017, doi:10.1371/journal.pone.0178994
Kim, Catherine et al. “Changes in iron measures over menopause and associations with insulin resistance.” Journal of women's health (2002) vol. 21,8 (2012): 872-7. doi:10.1089/jwh.2012.3549
Knovich, Mary Ann et al. “Ferritin for the clinician.” Blood reviews vol. 23,3 (2009): 95-104. doi:10.1016/j.blre.2008.08.001
Lee, Mark Hong et al. “Cut-off values of serum ferritin and TIBC saturation for the evaluation of gastrointestinal neoplasms in adult anemic patients.” International journal of hematology vol. 96,2 (2012): 214-21. doi:10.1007/s12185-012-1129-3
Locke, Tran, et al. “Hereditary Hemorrhagic Telangiectasia (HHT).” StatPearls, StatPearls Publishing, 11 June 2022.
Muñoz, Manuel et al. “An update on iron physiology.” World journal of gastroenterology vol. 15,37 (2009): 4617-26. doi:10.3748/wjg.15.4617
Pagana, Kathleen Deska, et al. Mosby's Diagnostic and Laboratory Test Reference. 15th ed., Mosby, 2021.
Sandvik, Jorunn et al. “Iron Deficiency and Anemia 10 Years After Roux-en-Y Gastric Bypass for Severe Obesity.” Frontiers in endocrinology vol. 12 679066. 22 Sep. 2021, doi:10.3389/fendo.2021.679066
Skolmowska, Dominika, and Dominika Głąbska. “Effectiveness of Dietary Intervention with Iron and Vitamin C Administered Separately in Improving Iron Status in Young Women.” International journal of environmental research and public health vol. 19,19 11877. 20 Sep. 2022, doi:10.3390/ijerph191911877
Total Iron Binding Capacity (TIBC)
Total Iron Binding Capacity (TIBC) primarily reflects transferrin, the main iron carrier in the blood, and it adjusts according to the body's iron requirements. TIBC decreases with chronic illness, liver disease, inflammation, and inflammatory diets. TIBC increases in iron deficiency to maximize iron transport. However, TIBC is not always the most accurate marker for diagnosing iron deficiency, as it may not change significantly until iron stores are severely depleted. Instead, ferritin is recommended for diagnosing iron deficiency in the absence of inflammation and infection. Moreover, high TIBC has been associated with left ventricular remodeling, which could lead to ventricular dysfunction.
References
Asif, Naveed et al. “Diagnostic Accuracy of Serum Iron and Total Iron Binding Capacity (TIBC) in Iron Deficiency State.” Journal of the College of Physicians and Surgeons--Pakistan : JCPSP vol. 26,12 (2016): 958-961.
Chen, Yan et al. “Total iron binding capacity (TIBC) is a potential biomarker of left ventricular remodelling for patients with iron deficiency anaemia.” BMC cardiovascular disorders vol. 20,1 4. 8 Jan. 2020, doi:10.1186/s12872-019-01320-3
Doherty, Jeanne L et al. “Inflammatory diets are associated with lower total iron binding capacity in sera of young adults.” International journal for vitamin and nutrition research. Internationale Zeitschrift fur Vitamin- und Ernahrungsforschung. Journal international de vitaminologie et de nutrition vol. 93,1 (2023): 9-17. doi:10.1024/0300-9831/a000697
Faruqi, Arjumand. and Shiva Kumar R. Mukkamalla. “Iron Binding Capacity.” StatPearls, StatPearls Publishing, 5 January 2022.
Pagana, Kathleen Deska, et al. Mosby's Diagnostic and Laboratory Test Reference. 15th ed., Mosby, 2021.
Transferrin
Transferrin, the primary iron transport protein in the blood, modulates iron availability by binding it, thus preventing harmful free radical formation and bacterial growth. Its levels decrease with high iron availability and increase during deficiency. Despite its crucial role, it's an imperfect diagnostic tool for iron deficiency as it's a negative acute-phase reactant, decreasing during inflammation and chronic illnesses. Monitoring transferrin levels is valuable in chronic conditions like cirrhosis and type 2 diabetes, where low levels may indicate decreased survival rates and progression to end-stage renal disease, respectively. In addition, low transferrin can signify protein malnutrition, and nutrition intervention can effectively increase its levels.
OPTIMAL DX MEMBERS CLICK HERE for more information on Transferrin
References
Gropper, Sareen S.; Smith, Jack L.; Carr, Timothy P. Advanced Nutrition and Human Metabolism. 8th edition. Wadsworth Publishing Co Inc. 2021.
Kotze, M J et al. “Pathogenic Mechanisms Underlying Iron Deficiency and Iron Overload: New Insights for Clinical Application.” EJIFCC vol. 20,2 108-23. 25 Aug. 2009
Lim, Su-Lin, and Jamie Lye. “Nutritional Intervention Incorporating Expedited 10 g Protein Counter (EP-10) to Improve the Albumin and Transferrin of Chronic Hemodialysis Patients.” ISRN nutrition vol. 2013 396570. 22 Oct. 2012, doi:10.5402/2013/396570
Pagana, Kathleen Deska, et al. Mosby's Diagnostic and Laboratory Test Reference. 15th ed., Mosby, 2021.
Viveiros, André et al. “Transferrin as a predictor of survival in cirrhosis.” Liver transplantation : official publication of the American Association for the Study of Liver Diseases and the International Liver Transplantation Society vol. 24,3 (2018): 343-351. doi:10.1002/lt.24981
Zhao, Lijun et al. “Serum transferrin predicts end-stage Renal Disease in Type 2 Diabetes Mellitus patients.” International journal of medical sciences vol. 17,14 2113-2124. 29 Jul. 2020, doi:10.7150/ijms.46259
%Transferrin Saturation
Transferrin saturation (TSAT) measures the proportion of transferrin in the blood that is carrying iron. Low TSAT can indicate iron deficiency, chronic illness, or inflammation, while high TSAT often signifies iron overload conditions or an increased risk of cardiovascular disease and diabetes. Both low and high TSAT levels can be associated with cardiovascular disease and overall mortality.
OPTIMAL DX MEMBERS CLICK HERE for more information on Transferrin Saturation
References
Ellervik, Christina et al. “Elevated transferrin saturation and risk of diabetes: three population-based studies.” Diabetes care vol. 34,10 (2011): 2256-8. doi:10.2337/dc11-0416
Kotze, M J et al. “Pathogenic Mechanisms Underlying Iron Deficiency and Iron Overload: New Insights for Clinical Application.” EJIFCC vol. 20,2 108-23. 25 Aug. 2009
Mainous, Arch G 3rd et al. “Elevated serum transferrin saturation and mortality.” Annals of family medicine vol. 2,2 (2004): 133-8. doi:10.1370/afm.25
Pagana, Kathleen Deska, et al. Mosby's Diagnostic and Laboratory Test Reference. 15th ed., Mosby, 2021.
Pilar Vaquero, M et al. “Diabesity negatively affects transferrin saturation and iron status. The DICARIVA study.” Diabetes research and clinical practice vol. 172 (2021): 108653. doi:10.1016/j.diabres.2021.108653
Stack, A G et al. “Transferrin saturation ratio and risk of total and cardiovascular mortality in the general population.” QJM : monthly journal of the Association of Physicians vol. 107,8 (2014): 623-33. doi:10.1093/qjmed/hcu045
Unsaturated Binding Capacity (UIBC)
Unsaturated Iron Binding Capacity (UIBC) signifies the available capacity of transferrin to transport more iron in the blood. In iron deficiency, UIBC increases as fewer iron molecules occupy transferrin binding sites, while it decreases in iron overload due to the occupation of more sites by iron. Low UIBC is linked with iron excess conditions, while high UIBC is associated with iron deficiency. UIBC's measurement can be a cost-effective alternative to assessing transferrin saturation and iron stores, but its accuracy can be affected by vitamin B12 deficiency.
References
Åsberg, Arne et al. “The diagnostic accuracy of unbound iron binding capacity (UIBC) as a test for empty iron stores.” Scandinavian journal of clinical and laboratory investigation vol. 73,3 (2013): 208-13. doi:10.3109/00365513.2013.765029
Pagana, Kathleen Deska, et al. Mosby's Diagnostic and Laboratory Test Reference. 15th ed., Mosby, 2021.
Solmaz, Soner et al. “Cobalamin deficiency can mask depleted body iron reserves.” Indian journal of hematology & blood transfusion : an official journal of Indian Society of Hematology and Blood Transfusion vol. 31,2 (2015): 255-8. doi:10.1007/s12288-014-0417-x
Kidney biomarkers are essential indicators for assessing kidney function, diagnosing kidney diseases, and monitoring the progression and response to the treatment of kidney disorders. The kidneys play a crucial role in maintaining health by filtering waste products, regulating electrolyte balance, and controlling blood pressure. Early detection and intervention in kidney diseases can help prevent or delay the progression to more severe conditions, such as chronic kidney disease (CKD) or end-stage renal disease (ESRD).
Blood Urea Nitrogen (BUN)
Blood urea nitrogen (BUN) is a byproduct of protein breakdown, formed in the liver and excreted by the kidneys. Its levels depend on protein intake and liver and kidney function, and it is assessed alongside creatinine and eGFR. Low levels are linked to insufficient protein intake, malnutrition, overhydration, liver failure, and nephrotic syndrome, while high levels are related to kidney failure, gastrointestinal bleeding, excessive protein intake, pancreatitis, and myocardial infarction. The BUN represents the nitrogen portion of urea and accounts for approximately half its molecular weight.
OPTIMAL DX MEMBERS CLICK HERE for more information on Blood Urea Nitrogen (BUN)
References
Arihan, Okan et al. “Blood Urea Nitrogen (BUN) is independently associated with mortality in critically ill patients admitted to ICU.” PloS one vol. 13,1 e0191697. 25 Jan. 2018, doi:10.1371/journal.pone.0191697
Cheng, Anying et al. “Diagnostic performance of initial blood urea nitrogen combined with D-dimer levels for predicting in-hospital mortality in COVID-19 patients.” International journal of antimicrobial agents vol. 56,3 (2020): 106110. doi:10.1016/j.ijantimicag.2020.106110
Dai, Minhui et al. “Blood Urea Nitrogen as a Prognostic Marker in Severe Acute Pancreatitis.” Disease markers vol. 2022 7785497. 29 Mar. 2022, doi:10.1155/2022/7785497
Hall, John E., and Michael E. Hall. Guyton and Hall textbook of medical physiology, 14th ed. Elsevier Health Sciences, 2020.
Horiuchi, Yu et al. “A High Level of Blood Urea Nitrogen Is a Significant Predictor for In-hospital Mortality in Patients with Acute Myocardial Infarction.” International heart journal vol. 59,2 (2018): 263-271. doi:10.1536/ihj.17-009
Hosten, Adrian O. “BUN and Creatinine.” Clinical Methods: The History, Physical, and Laboratory Examinations, edited by H
Kenneth Walker et. al., 3rd ed., Butterworths, 1990.
Kamal, Azra. "Estimation of blood urea (BUN) and serum creatinine level in patients of renal disorder." Indian J Fundam Appl Life Sci 4.4 (2014): 199-202.
Kazory, Amir. “Emergence of blood urea nitrogen as a biomarker of neurohormonal activation in heart failure.” The American journal of cardiology vol. 106,5 (2010): 694-700. doi:10.1016/j.amjcard.2010.04.024
Lin, Suhan et al. “Blood Urea Nitrogen as a Predictor of Severe Acute Pancreatitis Based on the Revised Atlanta Criteria: Timing of Measurement and Cutoff Points.” Canadian journal of gastroenterology & hepatology vol. 2017 (2017): 9592831. doi:10.1155/2017/9592831
Pagana, Kathleen Deska, et al. Mosby's Diagnostic and Laboratory Test Reference. 15th ed., Mosby, 2021.
Seki, Makiko et al. “Blood urea nitrogen is independently associated with renal outcomes in Japanese patients with stage 3-5 chronic kidney disease: a prospective observational study.” BMC nephrology vol. 20,1 115. 2 Apr. 2019, doi:10.1186/s12882-019-1306-1
Wu, Bechien U et al. “Blood urea nitrogen in the early assessment of acute pancreatitis: an international validation study.” Archives of internal medicine vol. 171,7 (2011): 669-76. doi:10.1001/archinternmed.2011.126
Creatinine
Creatinine, a byproduct of muscle metabolism, serves as a vital biomarker of kidney health. Produced as a result of creatine and creatine phosphate metabolism, its level in the body typically reflects muscle mass. The kidneys are responsible for its excretion, thus high creatinine levels may indicate kidney dysfunction, dehydration, muscle injury, excessive exercise, or certain medical conditions and medications. Conversely, low creatinine levels can be suggestive of reduced muscle mass, severe debilitation, muscular dystrophies, and an increased risk of developing type 2 diabetes. Therefore, monitoring creatinine levels is crucial for assessing renal function and overall health.
OPTIMAL DX MEMBERS CLICK HERE for more information on Creatinine
References
Harita, Nobuko et al. “Lower serum creatinine is a new risk factor of type 2 diabetes: the Kansai healthcare study.” Diabetes care vol. 32,3 (2009): 424-6. doi:10.2337/dc08-1265
Hosten, Adrian O. “BUN and Creatinine.” Clinical Methods: The History, Physical, and Laboratory Examinations, edited by H Kenneth Walker et. al., 3rd ed., Butterworths, 1990.
Hu, Huanhuan et al. “Low serum creatinine and risk of diabetes: The Japan Epidemiology Collaboration on Occupational Health Study.” Journal of diabetes investigation vol. 10,5 (2019): 1209-1214. doi:10.1111/jdi.13024
Junge, Wolfgang et al. “Determination of reference intervals for serum creatinine, creatinine excretion and creatinine clearance with an enzymatic and a modified Jaffé method.” Clinica chimica acta; international journal of clinical chemistry vol. 344,1-2 (2004): 137-48. doi:10.1016/j.cccn.2004.02.007
Kashani, Kianoush et al. “Creatinine: From physiology to clinical application.” European journal of internal medicine vol. 72 (2020): 9-14. doi:10.1016/j.ejim.2019.10.025
Kashima, S et al. “Low serum creatinine is a type 2 diabetes risk factor in men and women: The Yuport Health Checkup Center cohort study.” Diabetes & metabolism vol. 43,5 (2017): 460-464. doi:10.1016/j.diabet.2017.04.005
O'Brien, Maureen M et al. “Modest serum creatinine elevation affects adverse outcome after general surgery.” Kidney international vol. 62,2 (2002): 585-92. doi:10.1046/j.1523-1755.2002.00486.x
Pagana, Kathleen Deska, et al. Mosby's Diagnostic and Laboratory Test Reference. 15th ed., Mosby, 2021.
Shahbaz, Hassan. and Mohit Gupta. “Creatinine Clearance.” StatPearls, StatPearls Publishing, 26 July 2021.
Smith, Grace L et al. “Worsening renal function: what is a clinically meaningful change in creatinine during hospitalization with heart failure?.” Journal of cardiac failure vol. 9,1 (2003): 13-25. doi:10.1054/jcaf.2003.3
BUN:Creatinine Ratio
Blood Urea Nitrogen (BUN) and creatinine, byproducts of protein metabolism and muscle activity, respectively, are key markers of kidney function. Their relative levels can signal various health conditions. A low BUN to creatinine ratio might point to renal failure, protein deficiency, severe muscle breakdown, or impaired BUN production due to liver failure. On the other hand, a high ratio could suggest temporary kidney damage, excessive protein consumption, tissue damage, gastrointestinal bleeding, or dehydration. Furthermore, higher ratios are linked to increased mortality risks from myocardial infarction and COVID-19.
OPTIMAL DX MEMBERS CLICK HERE for more information on BUN:Creatinine
References
Hosten, Adrian O. “BUN and Creatinine.” Clinical Methods: The History, Physical, and Laboratory Examinations, edited by H Kenneth Walker et. al., 3rd ed., Butterworths, 1990.
Kim, Hoon et al. “Elevated Blood Urea Nitrogen/Creatinine Ratio Is Associated with Venous Thromboembolism in Patients with Acute Ischemic Stroke.” Journal of Korean Neurosurgical Society vol. 60,6 (2017): 620-626. doi:10.3340/jkns.2016.1010.009
Liu, Feng et al. “Elevated blood urea nitrogen-to-creatinine ratio increased the risk of Coronary Artery Disease in patients living with type 2 diabetes mellitus.” BMC endocrine disorders vol. 22,1 50. 28 Feb. 2022, doi:10.1186/s12902-022-00954-3
Ok, Fesih et al. “Predictive values of blood urea nitrogen/creatinine ratio and other routine blood parameters on disease severity and survival of COVID-19 patients.” Journal of medical virology vol. 93,2 (2021): 786-793. doi:10.1002/jmv.26300
Pagana, Kathleen Deska, et al. Mosby's Diagnostic and Laboratory Test Reference. 15th ed., Mosby, 2021.
Qian, Hao et al. “Predictive value of blood urea nitrogen/creatinine ratio in the long-term prognosis of patients with acute myocardial infarction complicated with acute heart failure.” Medicine vol. 98,11 (2019): e14845. doi:10.1097/MD.0000000000014845
Raymond, Janice L., et al. Krause and Mahan's Food & the Nutrition Care Process. Elsevier, 2021.
Salvador, López Giacoman et al. “A low BUN/creatinine ratio predicts histologically confirmed acute interstitial nephritis.” BMC nephrology vol. 24,1 75. 27 Mar. 2023, doi:10.1186/s12882-023-03118-0
Shen, Song et al. “The blood urea nitrogen/creatinine (BUN/cre) ratio was U-shaped associated with all-cause mortality in general population.” Renal failure vol. 44,1 (2022): 184-190. doi:10.1080/0886022X.2022.2030359
Schrock, Jon W et al. “Elevated blood urea nitrogen/creatinine ratio is associated with poor outcome in patients with ischemic stroke.” Clinical neurology and neurosurgery vol. 114,7 (2012): 881-4. doi:10.1016/j.clineuro.2012.01.031
Tolomeo, Paolo et al. “Independent prognostic importance of blood urea nitrogen to creatinine ratio in heart failure.” European journal of heart failure, 10.1002/ejhf.3114. 20 Dec. 2023, doi:10.1002/ejhf.3114
Zia Ziabari, Seyyed Mahdi et al. “Blood Urea Nitrogen to Creatinine ratio in Differentiation of Upper and Lower Gastrointestinal Bleedings; a Diagnostic Accuracy Study.” Archives of academic emergency medicine vol. 7,1 e30. 2 Jun. 2019
Estimated Glomerular Filtration Rate (eGFR)
The estimated glomerular filtration rate (eGFR) is a measure of kidney function, indicating how well the kidneys can filter out creatinine, a byproduct of muscle metabolism. The eGFR, commonly calculated using variables such as age, gender, and creatinine levels, provides crucial insights into kidney health. A decreasing eGFR can indicate compromised kidney function due to factors such as dehydration, kidney disease, diabetic nephropathy, cirrhosis, congestive heart failure, shock, and aging. Conversely, an increased eGFR may occur with pregnancy, physical exercise, and high cardiac output conditions. Regular monitoring of eGFR is critical, especially in patients with potential kidney complications, including those using nephrotoxic drugs or patients with diabetes.
References
Ernst, Rahel et al. “Polypharmacy and Kidney Function in Community-Dwelling Adults Age 60 Years and Older: A Prospective Observational Study.” Journal of the American Medical Directors Association vol. 21,2 (2020): 254-259.e1. doi:10.1016/j.jamda.2019.07.007
Glassock, Richard J, and Christopher Winearls. “Ageing and the glomerular filtration rate: truths and consequences.” Transactions of the American Clinical and Climatological Association vol. 120 (2009): 419-28.
Miller, W Greg, and Graham R D Jones. “Estimated Glomerular Filtration Rate; Laboratory Implementation and Current Global Status.” Advances in chronic kidney disease vol. 25,1 (2018): 7-13. doi:10.1053/j.ackd.2017.09.013
National Kidney Foundation. Estimated Glomerular Filtration Rate. https://www.kidney.org/kidney-topics/estimated-glomerular-filtration-rate-egfr Updated February 5, 2026.
Nojima, Jun et al. “One-year eGFR decline rate is a good predictor of prognosis of renal failure in patients with type 2 diabetes.” Proceedings of the Japan Academy. Series B, Physical and biological sciences vol. 93,9 (2017): 746-754. doi:10.2183/pjab.93.046
Pagana, Kathleen Deska, et al. Mosby's Diagnostic and Laboratory Test Reference. 15th ed., Mosby, 2021.
Raymond, Janice L., et al. Krause and Mahan's Food & the Nutrition Care Process. Elsevier, 2021.
Creatinine Clearance
Creatinine clearance is a measure of kidney function that assesses the ability of the kidneys to filter creatinine, a waste product of muscle metabolism. Low creatinine clearance can suggest decreased kidney function, conditions like cirrhosis with ascites or dehydration, or changes like decreased muscle mass and aging. Conversely, high creatinine clearance can be seen in situations like pregnancy or high meat consumption.
OPTIMAL DX MEMBERS CLICK HERE for more information on Creatinine Clearance
References
Pagana, Kathleen Deska, et al. Mosby's Diagnostic and Laboratory Test Reference. 15th ed., Mosby, 2021.
Roshanravan, Baback et al. “Creatinine clearance, walking speed, and muscle atrophy: a cohort study.” American journal of kidney diseases : the official journal of the National Kidney Foundation vol. 65,5 (2015): 737-47. doi:10.1053/j.ajkd.2014.10.016
Shahbaz, Hassan. and Mohit Gupta. “Creatinine Clearance.” StatPearls, StatPearls Publishing, 25 July 2022.
Cystatin C
Cystatin C (cysC) is a protein found in all body fluids and tissues, acting as a protease inhibitor to prevent excessive tissue damage and help combat microbial infections. It's a reliable marker for kidney function, with elevated levels associated with an increased risk of renal and cardiovascular diseases. Unlike creatinine, cysC levels aren't influenced by factors such as protein intake, muscle mass, diet, gender, or inflammation, making it more suitable for detecting early kidney function changes. High cysC levels are linked with various health issues, including arterial stiffness, cardiovascular disease, stroke, kidney dysfunction, and hyperthyroidism, while lower levels might suggest a decreased risk of renal and cardiovascular diseases.
OPTIMAL DX MEMBERS CLICK HERE for more information on Cystatin C
References
Amin, Fakhra et al. “Mammalian cystatin and protagonists in brain diseases.” Journal of biomolecular structure & dynamics vol. 38,7 (2020): 2171-2196. doi:10.1080/07391102.2019.1620636
Bevc, Sebastjan et al. “Cystatin C as a predictor of mortality in elderly patients with chronic kidney disease.” The aging male : the official journal of the International Society for the Study of the Aging Male vol. 22,1 (2019): 62-67. doi:10.1080/13685538.2018.1479386
Brodin EE, Braekkan SK, Vik A, Brox J, Hansen JB. Cystatin C is associated with risk of venous thromboembolism in subjects with normal kidney function--the Tromso study. Haematologica. Jul 2012;97(7):1008-1013.
Dhama, Kuldeep et al. “Biomarkers in Stress Related Diseases/Disorders: Diagnostic, Prognostic, and Therapeutic Values.” Frontiers in molecular biosciences vol. 6 91. 18 Oct. 2019, doi:10.3389/fmolb.2019.00091
Dong, Xiaoyu, and Jianfei Nao. “Cystatin C as an index of acute cerebral infraction recurrence: one-year follow-up study.” The International journal of neuroscience vol. 129,1 (2019): 36-41. doi:10.1080/00207454.2018.1503180
El-Metwally, Elham Mohammad, et al. "Level of cystatin C in functional thyroid disorders and its relation to GFR." Comparative Clinical Pathology 26 (2017): 1141-1147.
Elsayed, Mohamed Shawky et al. “Serum cystatin C as an indicator for early detection of diabetic nephropathy in type 2 diabetes mellitus.” Diabetes & metabolic syndrome vol. 13,1 (2019): 374-381. doi:10.1016/j.dsx.2018.08.017
Fernando, Sanduni, and Kevan R Polkinghorne. “Cystatin C: not just a marker of kidney function.” Jornal brasileiro de nefrologia vol. 42,1 (2020): 6-7. doi:10.1590/2175-8239-JBN-2019-0240
Gao, Dong et al. “Correlations of serum cystatin C and hs-CRP with vascular endothelial cell injury in patients with systemic lupus erythematosus.” Panminerva medica vol. 60,4 (2018): 151-155. doi:10.23736/S0031-0808.18.03466-3
Ho, Jennifer E et al. “Protein Biomarkers of Cardiovascular Disease and Mortality in the Community.” Journal of the American Heart Association vol. 7,14 e008108. 13 Jul. 2018, doi:10.1161/JAHA.117.008108
Kaneko, Rei et al. “Serum cystatin C level is associated with carotid arterial wall elasticity in subjects with type 2 diabetes mellitus: A potential marker of early-stage atherosclerosis.” Diabetes research and clinical practice vol. 139 (2018): 43-51. doi:10.1016/j.diabres.2018.02.003
Kar, Sumit et al. “Cystatin C Is a More Reliable Biomarker for Determining eGFR to Support Drug Development Studies.” Journal of clinical pharmacology vol. 58,10 (2018): 1239-1247. doi:10.1002/jcph.1132
Pagana, Kathleen Deska, et al. Mosby's Diagnostic and Laboratory Test Reference. 15th ed., Mosby, 2021.
Pandey, Vikas Kumar et al. “Study of Serum Cystatin C and Serum Creatinine in Different Stages of Chronic Kidney Disease Patients.” The Journal of the Association of Physicians of India vol. 70,4 (2022): 11-12.
Shah, Aaliya, and Bilqees Bano. “Cystatins in Health and Diseases.” International journal of peptide research and therapeutics vol. 15,1 (2009): 43. doi:10.1007/s10989-008-9160-1
Shen, Yueping et al. “High-sensitivity C-reactive protein and cystatin C independently and jointly predict all-cause mortality among the middle-aged and elderly Chinese population.” Clinical biochemistry vol. 65 (2019): 7-14. doi:10.1016/j.clinbiochem.2018.12.012
Su, I-Min et al. “Serum cystatin C is independently associated with aortic arterial stiffness in patients with type 2 diabetes.” Clinica chimica acta; international journal of clinical chemistry vol. 480 (2018): 114-118. doi:10.1016/j.cca.2018.02.007
Lipid biomarkers are essential indicators of cardiometabolic health and are used to assess the risk of developing heart disease. Lipids, such as cholesterol and triglycerides, play crucial roles in cell structure, energy metabolism, and hormone synthesis. However, dysregulation and modification of lipids in circulation can contribute to atherosclerosis, a condition characterized by the buildup of plaque in the arterial walls, increasing the risk of heart attack, stroke, and peripheral artery disease. Oxidation of cholesterol, especially LDL-C, plays a significant role in the development of atherosclerosis. When LDL particles become oxidized, they are more readily taken up by macrophages, immune cells that infiltrate the arterial walls. These macrophages transform into foam cells, which can lead to atherosclerotic plaque formation. Oxidized LDL (oxLDL) is recognized as a pro-inflammatory and pro-atherogenic molecule, further contributing to the progression of cardiovascular disease.
Cholesterol, Total
Cholesterol is a crucial compound for creating cell membranes, steroid hormones, vitamin D, bile acids, and the protective myelin sheath around nerve cells. Although essential, oxidized cholesterol embedded in blood vessels can contribute to atherosclerosis and cardiovascular disease (CVD). Low cholesterol is linked to malnutrition, depression, aggressive behavior, and neurodegenerative disease, including Parkinson"s, while high levels can result from genetic factors, hypothyroidism, or be associated with CVD when oxidized, carried mainly by low-density lipoproteins, or connected to other CVD risk factors.
OPTIMAL DX MEMBERS CLICK HERE for more information on Cholesterol, Total
References
Agranoff BW, Benjamins JA, Hajra AK. Properties of Brain Lipids. In: Siegel GJ, Agranoff BW, Albers RW, et al., editors. Basic Neurochemistry: Molecular, Cellular and Medical Aspects. 6th edition. Philadelphia: Lippincott-Raven; 1999. Available from:
Aminov, Zafar et al. “Analysis of the effects of exposure to polychlorinated biphenyls and chlorinated pesticides on serum lipid levels in residents of Anniston, Alabama.” Environmental health : a global access science source vol. 12 108. 11 Dec. 2013, doi:10.1186/1476-069X-12-108
Berger, Samantha et al. “Dietary cholesterol and cardiovascular disease: a systematic review and meta-analysis.” The American journal of clinical nutrition vol. 102,2 (2015): 276-94. doi:10.3945/ajcn.114.100305
Berghoff, Stefan A et al. “Dietary cholesterol promotes repair of demyelinated lesions in the adult brain.” Nature communications vol. 8 14241. 24 Jan. 2017, doi:10.1038/ncomms14241
Biondi, Bernadette, and David S Cooper. “The clinical significance of subclinical thyroid dysfunction.” Endocrine reviews vol. 29,1 (2008): 76-131. doi:10.1210/er.2006-0043
Cabrera, Marcos Aparecido Sarria et al. “Lipids and all-cause mortality among older adults: a 12-year follow-up study.” TheScientificWorldJournal vol. 2012 (2012): 930139. doi:10.1100/2012/930139
Craig, Micah. and Ahmad Malik. “Biochemistry, Cholesterol.” StatPearls, StatPearls Publishing, 17 April 2019.
Fernandez-Friera, Leticia et al. “Normal LDL-Cholesterol Levels Are Associated With Subclinical Atherosclerosis in the Absence of Risk Factors.” Journal of the American College of Cardiology vol. 70,24 (2017): 2979-2991. doi:10.1016/j.jacc.2017.10.024
Fulks M, Stout RL, Dolan VF. Albumin and all‐cause mortality risk in insurance applicants. J Insur Med. 2010;42: 11–17.
Hu, Jie et al. “Cellular cholesterol delivery, intracellular processing and utilization for biosynthesis of steroid hormones.” Nutrition & metabolism vol. 7 47. 1 Jun. 2010, doi:10.1186/1743-7075-7-47
Huff T, Boyd B, Jialal I. Physiology, Cholesterol. [Updated 2020 Apr 15]. In: StatPearls [Internet]. Treasure Island (FL): StatPearls Publishing; 2020 Jan-. Available from: This book is distributed under the terms of the Creative Commons Attribution 4.0 International License ( ).
Jin, Uram et al. “Cholesterol Metabolism in the Brain and Its Association with Parkinson's Disease.” Experimental neurobiology vol. 28,5 (2019): 554-567. doi:10.5607/en.2019.28.5.554
Jung, Kyong Yeun et al. “Association between thyroid function and lipid profiles, apolipoproteins, and high-density lipoprotein function.” Journal of clinical lipidology vol. 11,6 (2017): 1347-1353. doi:10.1016/j.jacl.2017.08.015.
Kotwal, Anupam et al. “Treatment of Thyroid Dysfunction and Serum Lipids: A Systematic Review and Meta-analysis.” The Journal of clinical endocrinology and metabolism vol. 105,12 (2020): dgaa672. doi:10.1210/clinem/dgaa672
Mahan, L. K., & Raymond, J. L. (2016). Krause's food & the nutrition care process. Elsevier Health Sciences.
Michalopoulou, G et al. “High serum cholesterol levels in persons with 'high-normal' TSH levels: should one extend the definition of subclinical hypothyroidism?.” European journal of endocrinology vol. 138,2 (1998): 141-5. doi:10.1530/eje.0.1380141
Nago, Naoki et al. “Low cholesterol is associated with mortality from stroke, heart disease, and cancer: the Jichi Medical School Cohort Study.” Journal of epidemiology vol. 21,1 (2011): 67-74. doi:10.2188/jea.je20100065
Nantsupawat, Nopakoon et al. “Appropriate Total cholesterol cut-offs for detection of abnormal LDL cholesterol and non-HDL cholesterol among low cardiovascular risk population.” Lipids in health and disease vol. 18,1 28. 26 Jan. 2019, doi:10.1186/s12944-019-0975-x
Orozco-Beltran, Domingo et al. “Lipid profile, cardiovascular disease and mortality in a Mediterranean high-risk population: The ESCARVAL-RISK study.” PloS one vol. 12,10 e0186196. 18 Oct. 2017, doi:10.1371/journal.pone.0186196 Correction
Pagana, Kathleen Deska, et al. Mosby's Diagnostic and Laboratory Test Reference. 15th ed., Mosby, 2021.
Petursson, Halfdan et al. “Is the use of cholesterol in mortality risk algorithms in clinical guidelines valid? Ten years prospective data from the Norwegian HUNT 2 study.” Journal of evaluation in clinical practice vol. 18,1 (2012): 159-68. doi:10.1111/j.1365-2753.2011.01767.x
Rizos, C V et al. “Effects of thyroid dysfunction on lipid profile.” The open cardiovascular medicine journal vol. 5 (2011): 76-84. doi:10.2174/1874192401105010076
Schade, David S et al. “Cholesterol Review: A Metabolically Important Molecule.” Endocrine practice : official journal of the American College of Endocrinology and the American Association of Clinical Endocrinologists vol. 26,12 (2020): 1514-1523. doi:10.4158/EP-2020-0347
Snipes, G J, and U Suter. “Cholesterol and myelin.” Sub-cellular biochemistry vol. 28 (1997): 173-204. doi:10.1007/978-1-4615-5901-6_7
Stamler, J et al. “Relationship of baseline serum cholesterol levels in 3 large cohorts of younger men to long-term coronary, cardiovascular, and all-cause mortality and to longevity.” JAMA vol. 284,3 (2000): 311-8. doi:10.1001/jama.284.3.311
Tsoupras, Alexandros et al. “Inflammation, not Cholesterol, Is a Cause of Chronic Disease.” Nutrients vol. 10,5 604. 12 May. 2018, doi:10.3390/nu10050604
Whitney, E. N., & Rolfes, S. R. (2008). Understanding nutrition (11th ed.). Belmont, CA: Thomson/Wadsworth.
Yi, Sang-Wook et al. “Total cholesterol and all-cause mortality by sex and age: a prospective cohort study among 12.8 million adults.” Scientific reports vol. 9,1 1596. 7 Feb. 2019, doi:10.1038/s41598-018-38461-y
Zhang, Zhiying et al. “Evaluation of Blood Biomarkers Associated with Risk of Malnutrition in Older Adults: A Systematic Review and Meta-Analysis.” Nutrients vol. 9,8 829. 3 Aug. 2017, doi:10.3390/nu9080829
Zozina, Vladlena I et al. “Coenzyme Q10 in Cardiovascular and Metabolic Diseases: Current State of the Problem.” Current cardiology reviews vol. 14,3 (2018): 164-174. doi:10.2174/1573403X14666180416115428
Zubeldia-Brenner, L et al. “Developmental and Functional Effects of Steroid Hormones on the Neuroendocrine Axis and Spinal Cord.” Journal of neuroendocrinology vol. 28,7 (2016): 10.1111/jne.12401. doi:10.1111/jne.12401
LDL Cholesterol
Low-density lipoproteins (LDL) carry leftover cholesterol after triglycerides are cleaved from very low-density lipoproteins. Elevated levels of LDL cholesterol (LDL-C), especially when the particles are small, dense, and prone to oxidation, can contribute to the development of cardiovascular disease. However, surprisingly, low levels of LDL-C can also increase the risk of all-cause mortality and intracerebral hemorrhage. LDL-C levels may be influenced by genetic factors, diet, and the size of the LDL particles themselves, which can range from small and dense (more atherogenic) to larger and less dense (less atherogenic). Therefore, assessing LDL-C alone is insufficient to gauge cardiovascular risk or mortality, and other factors, such as inflammation, HDL levels, the triglyceride/HDL-C ratio, oxidative stress, and LDL particle size, should be considered for a comprehensive assessment.
OPTIMAL DX MEMBERS CLICK HERE for more information on LDL Cholesterol
References
Fernandez-Friera, Leticia et al. “Normal LDL-Cholesterol Levels Are Associated With Subclinical Atherosclerosis in the Absence of Risk Factors.” Journal of the American College of Cardiology vol. 70,24 (2017): 2979-2991. doi:10.1016/j.jacc.2017.10.024
Ivanova, Ekaterina A et al. “Small Dense Low-Density Lipoprotein as Biomarker for Atherosclerotic Diseases.” Oxidative medicine and cellular longevity vol. 2017 (2017): 1273042. doi:10.1155/2017/1273042
Jiang, Zhenghui Gordon et al. “Low LDL-C and high HDL-C levels are associated with elevated serum transaminases amongst adults in the United States: a cross-sectional study.” PloS one vol. 9,1 e85366. 15 Jan. 2014, doi:10.1371/journal.pone.0085366
Linton, MacRae F, et al. “The Role of Lipids and Lipoproteins in Atherosclerosis.” Endotext, edited by Kenneth R Feingold et. al., MDText.com, Inc., 3 January 2019.
Lupton, Joshua R et al. “Deficient serum 25-hydroxyvitamin D is associated with an atherogenic lipid profile: The Very Large Database of Lipids (VLDL-3) study.” Journal of clinical lipidology vol. 10,1 (2016): 72-81.e1. doi:10.1016/j.jacl.2015.09.006
Ma, Chaoran et al. “Low-density lipoprotein cholesterol and risk of intracerebral hemorrhage: A prospective study.” Neurology vol. 93,5 (2019): e445-e457. doi:10.1212/WNL.0000000000007853
Marz, Winfried et al. “HDL cholesterol: reappraisal of its clinical relevance.” Clinical research in cardiology : official journal of the German Cardiac Society vol. 106,9 (2017): 663-675. doi:10.1007/s00392-017-1106-1
Millan, Jesus et al. “Lipoprotein ratios: Physiological significance and clinical usefulness in cardiovascular prevention.” Vascular health and risk management vol. 5 (2009): 757-65.
Natella, Fausta et al. “Coffee drinking induces incorporation of phenolic acids into LDL and increases the resistance of LDL to ex vivo oxidation in humans.” The American journal of clinical nutrition vol. 86,3 (2007): 604-9. doi:10.1093/ajcn/86.3.604
Orozco-Beltran, Domingo et al. “Lipid profile, cardiovascular disease and mortality in a Mediterranean high-risk population: The ESCARVAL-RISK study.” PloS one vol. 12,10 e0186196. 18 Oct. 2017, doi:10.1371/journal.pone.0186196 Correction
Pagana, Kathleen Deska, et al. Mosby's Diagnostic and Laboratory Test Reference. 15th ed., Mosby, 2021.
Penson, Peter E et al. “Associations between very low concentrations of low density lipoprotein cholesterol, high sensitivity C-reactive protein, and health outcomes in the Reasons for Geographical and Racial Differences in Stroke (REGARDS) study.” European heart journal vol. 39,40 (2018): 3641-3653. doi:10.1093/eurheartj/ehy533
Ravnskov, Uffe et al. “Lack of an association or an inverse association between low-density-lipoprotein cholesterol and mortality in the elderly: a systematic review.” BMJ open vol. 6,6 e010401. 12 Jun. 2016, doi:10.1136/bmjopen-2015-010401
Singh, Nivedita et al. “Reduced Antioxidant Potential of LDL Is Associated With Increased Susceptibility to LDL Peroxidation in Type II Diabetic Patients.” International journal of endocrinology and metabolism vol. 10,4 (2012): 582-6. doi:10.5812/ijem.5029
Talebi, Sepide et al. “The beneficial effects of nutraceuticals and natural products on small dense LDL levels, LDL particle number and LDL particle size: a clinical review.” Lipids in health and disease vol. 19,1 66. 11 Apr. 2020, doi:10.1186/s12944-020-01250-6
Wang, Bo et al. “Malnutrition affects cholesterol paradox in coronary artery disease: a 41,229 Chinese cohort study.” Lipids in health and disease vol. 20,1 36. 19 Apr. 2021, doi:10.1186/s12944-021-01460-6
Weigel, Thaddeus K et al. “Oxidized cholesterol species as signaling molecules in the brain: diabetes and Alzheimer's disease.” Neuronal signaling vol. 3,4 (2019): NS20190068. doi:10.1042/NS20190068
Wongcharoen, Wanwarang et al. “Is non-HDL-cholesterol a better predictor of long-term outcome in patients after acute myocardial infarction compared to LDL-cholesterol? : a retrospective study.” BMC cardiovascular disorders vol. 17,1 10. 5 Jan. 2017, doi:10.1186/s12872-016-0450-9
Oxidized LDL
Oxidized low-density lipoprotein (oxLDL), which has been modified through oxidation, carries compounds associated with atherosclerosis and other health conditions, including metabolic syndrome, hypothyroidism, and coronary artery disease. High levels of oxLDL exacerbate oxidative stress and inflammation, leading to endothelial damage and atherosclerosis. Dietary modifications, such as the increased intake of high-antioxidant foods and omega-3 fatty acids, can mitigate oxidation and reduce these risks. As such, oxLDL is not only a crucial marker of oxidative stress but also a predictive factor for early-stage coronary artery disease and metabolic syndrome.
Standard Range:
Quest below 60.00 U/L
Labcorp 10.00 – 170.00 ng/mL
The ODX Range:
Quest 0.00 - 32.00 U/L
Labcorp 0.00 – 108.00 ng/mL
OPTIMAL DX MEMBERS CLICK HERE for more information on Oxidized LDL
References
Ali, Wahid, et al. "Oxidized LDL as a biomarker in metabolic syndrome." J Diabetes Metab 8.764 (2017): 2.
Bansal, Sanjiv Kumar, and Rakhee Yadav. “A Study of the Extended Lipid Profile including Oxidized LDL, Small Dense LDL, Lipoprotein (a) and Apolipoproteins in the Assessment of Cardiovascular Risk in Hypothyroid Patients.” Journal of clinical and diagnostic research : JCDR vol. 10,6 (2016): BC04-8. doi:10.7860/JCDR/2016/19775.8067
Cicero, Arrigo F G et al. “Serum uric acid and markers of low-density lipoprotein oxidation in nonsmoking healthy subjects: data from the Brisighella Heart Study.” Polskie Archiwum Medycyny Wewnetrznej vol. 124,12 (2014): 661-8. doi:10.20452/pamw.2548
Gao, Shen et al. “Circulating Oxidized Low-Density Lipoprotein Levels Independently Predict 10-Year Progression of Subclinical Carotid Atherosclerosis: A Community-Based Cohort Study.” Journal of atherosclerosis and thrombosis vol. 25,10 (2018): 1032-1043. doi:10.5551/jat.43299
Holvoet, P et al. “Circulating oxidized LDL is a useful marker for identifying patients with coronary artery disease.” Arteriosclerosis, thrombosis, and vascular biology vol. 21,5 (2001): 844-8. doi:10.1161/01.atv.21.5.844
Holvoet, Paul et al. “Association between circulating oxidized low-density lipoprotein and incidence of the metabolic syndrome.” JAMA vol. 299,19 (2008): 2287-93. doi:10.1001/jama.299.19.2287
Ivanova, Ekaterina A et al. “Small Dense Low-Density Lipoprotein as Biomarker for Atherosclerotic Diseases.” Oxidative medicine and cellular longevity vol. 2017 (2017): 1273042. doi:10.1155/2017/1273042
Linton, MacRae F, et al. “The Role of Lipids and Lipoproteins in Atherosclerosis.” Endotext, edited by Kenneth R Feingold et. al., MDText.com, Inc., 3 January 2019.
Meisinger, Christa et al. “Plasma oxidized low-density lipoprotein, a strong predictor for acute coronary heart disease events in apparently healthy, middle-aged men from the general population.” Circulation vol. 112,5 (2005): 651-7. doi:10.1161/CIRCULATIONAHA.104.529297
Natella, Fausta et al. “Coffee drinking induces incorporation of phenolic acids into LDL and increases the resistance of LDL to ex vivo oxidation in humans.” The American journal of clinical nutrition vol. 86,3 (2007): 604-9. doi:10.1093/ajcn/86.3.604
Parthasarathy, Sampath et al. “Oxidized low-density lipoprotein.” Methods in molecular biology (Clifton, N.J.) vol. 610 (2010): 403-17. doi:10.1007/978-1-60327-029-8_24
Poznyak, Anastasia V et al. “Oxidative Stress and Antioxidants in Atherosclerosis Development and Treatment.” Biology vol. 9,3 60. 21 Mar. 2020, doi:10.3390/biology9030060
Raikou, Vaia et al. “Oxidized Low-Density Lipoprotein Serum Concentrations and Cardiovascular Morbidity in End Stage of Renal Disease.” Journal of cardiovascular development and disease vol. 5,3 35. 21 Jun. 2018, doi:10.3390/jcdd5030035
Ramos-Arellano, Luz E et al. “Circulating CD36 and oxLDL levels are associated with cardiovascular risk factors in young subjects.” BMC cardiovascular disorders vol. 14 54. 28 Apr. 2014, doi:10.1186/1471-2261-14-54
Salvayre, R et al. “Oxidative theory of atherosclerosis and antioxidants.” Biochimie vol. 125 (2016): 281-96. doi:10.1016/j.biochi.2015.12.014
Weigel, Thaddeus K et al. “Oxidized cholesterol species as signaling molecules in the brain: diabetes and Alzheimer's disease.” Neuronal signaling vol. 3,4 (2019): NS20190068. doi:10.1042/NS20190068
Small Dense LDL-Cholesterol (sdLDL-C)
Small dense low-density lipoprotein cholesterol (sdLDL-C) is a type of cholesterol that is highly susceptible to oxidation, making it more likely to contribute to atherosclerosis and heart disease. High levels have been linked to numerous health conditions, including cardiovascular disease, metabolic syndrome, diabetes, and subclinical hypothyroidism. Even in patients taking statins, a higher sdLDL-C indicates a residual risk of cardiovascular events. sdLDL-C is a risk factor for coronary heart disease, independent of other conventional risk factors. Furthermore, genetic factors, including single nucleotide polymorphisms, influence sdLDL-C levels. Therefore, managing sdLDL-C levels through measures like diet and exercise is critical in mitigating risks associated with cardiovascular and metabolic diseases.
Standard Range: Below 50 mg/dL (1.3. mmol/L)
The ODX Range: 1 - 36 mg/dL (0.026 – 0.93 mmol/L)
OPTIMAL DX MEMBERS CLICK HERE for more information on sdLDL-C
References
Ai, Masumi et al. “Small dense LDL cholesterol and coronary heart disease: results from the Framingham Offspring Study.” Clinical chemistry vol. 56,6 (2010): 967-76. doi:10.1373/clinchem.2009.137489
Fan, Jiahua et al. “Small dense LDL cholesterol is associated with metabolic syndrome traits independently of obesity and inflammation.” Nutrition & metabolism vol. 16 7. 21 Jan. 2019, doi:10.1186/s12986-019-0334-y
Hoogeveen, Ron C et al. “Small dense low-density lipoprotein-cholesterol concentrations predict risk for coronary heart disease: the Atherosclerosis Risk In Communities (ARIC) study.” Arteriosclerosis, thrombosis, and vascular biology vol. 34,5 (2014): 1069-77. doi:10.1161/ATVBAHA.114.303284
Ikezaki, Hiroaki et al. “Small Dense Low-Density Lipoprotein Cholesterol Is the Most Atherogenic Lipoprotein Parameter in the Prospective Framingham Offspring Study.” Journal of the American Heart Association vol. 10,5 (2021): e019140. doi:10.1161/JAHA.120.019140
Ivanova, Ekaterina A et al. “Small Dense Low-Density Lipoprotein as Biomarker for Atherosclerotic Diseases.” Oxidative medicine and cellular longevity vol. 2017 (2017): 1273042. doi:10.1155/2017/1273042
Liou, Lathan, and Stephen Kaptoge. “Association of small, dense LDL-cholesterol concentration and lipoprotein particle characteristics with coronary heart disease: A systematic review and meta-analysis.” PloS one vol. 15,11 e0241993. 9 Nov. 2020, doi:10.1371/journal.pone.0241993
Saric, Maida Seferovic et al. “Dyslipidemia in subclinical hypothyroidism requires assessment of small dense low density lipoprotein cholesterol (sdLDL-C).” Romanian journal of internal medicine = Revue roumaine de medecine interne vol. 55,3 (2017): 159-166. doi:10.1515/rjim-2017-0015
Superko, Harold, and Brenda Garrett. “Small Dense LDL: Scientific Background, Clinical Relevance, and Recent Evidence Still a Risk Even with 'Normal' LDL-C Levels.” Biomedicines vol. 10,4 829. 1 Apr. 2022, doi:10.3390/biomedicines10040829
Satoh, Noriko et al. “Small dense LDL-cholesterol relative to LDL-cholesterol is a strong independent determinant of hypoadiponectinemia in metabolic syndrome.” Circulation journal : official journal of the Japanese Circulation Society vol. 72,6 (2008): 932-9. doi:10.1253/circj.72.932
VLDL Cholesterol
Very low-density lipoproteins (VLDLs) are lipoproteins that primarily transport triglycerides and cholesterol in the bloodstream. After VLDL deposits triglycerides, it transforms into intermediate-density lipoprotein and then low-density lipoprotein. The cholesterol left on VLDL is known as remnant cholesterol, which has been associated with an increased risk of cardiovascular diseases (CVD), stroke, and diabetes. High VLDL-C levels are linked to CVD, hypothyroidism, and liver disease. Managing VLDL-C levels is essential as high levels have been linked to a higher risk of major adverse cardiovascular events, metabolic syndrome, and vitamin D insufficiency.
OPTIMAL DX MEMBERS CLICK HERE for more information on VLDL-C
References
Balling, Mie et al. “VLDL Cholesterol Accounts for One-Half of the Risk of Myocardial Infarction Associated With apoB-Containing Lipoproteins.” Journal of the American College of Cardiology vol. 76,23 (2020): 2725-2735. doi:10.1016/j.jacc.2020.09.610
Castaner, Olga et al. “Remnant Cholesterol, Not LDL Cholesterol, Is Associated With Incident Cardiovascular Disease.” Journal of the American College of Cardiology vol. 76,23 (2020): 2712-2724. doi:10.1016/j.jacc.2020.10.008
Gentile, Marco et al. “Association between Very Low-Density Lipoprotein Cholesterol (VLDL-C) and Carotid Intima-Media Thickness in Postmenopausal Women Without Overt Cardiovascular Disease and on LDL-C Target Levels.” Journal of clinical medicine vol. 9,5 1422. 11 May. 2020, doi:10.3390/jcm9051422
Heidemann, Britt E et al. “The relation between VLDL-cholesterol and risk of cardiovascular events in patients with manifest cardiovascular disease.” International journal of cardiology vol. 322 (2021): 251-257. doi:10.1016/j.ijcard.2020.08.030
Lupton, Joshua R et al. “Deficient serum 25-hydroxyvitamin D is associated with an atherogenic lipid profile: The Very Large Database of Lipids (VLDL-3) study.” Journal of clinical lipidology vol. 10,1 (2016): 72-81.e1. doi:10.1016/j.jacl.2015.09.006
Prenner, Stuart B et al. “Very low density lipoprotein cholesterol associates with coronary artery calcification in type 2 diabetes beyond circulating levels of triglycerides.” Atherosclerosis vol. 236,2 (2014): 244-50. doi:10.1016/j.atherosclerosis.2014.07.008
Raymond, Janice L., et al. Krause and Mahan's Food & the Nutrition Care Process. Elsevier, 2021.
Schade, David S et al. “Cholesterol Review: A Metabolically Important Molecule.” Endocrine practice : official journal of the American College of Endocrinology and the American Association of Clinical Endocrinologists vol. 26,12 (2020): 1514-1523. doi:10.4158/EP-2020-0347
Xie, Guobo et al. “Remnant Cholesterol is an Independent Predictor of New-Onset Diabetes: A Single-Center Cohort Study.” Diabetes, metabolic syndrome and obesity : targets and therapy vol. 14 4735-4745. 3 Dec. 2021, doi:10.2147/DMSO.S341285
HDL Cholesterol (HDL-C)
High-density lipoprotein (HDL) collects cholesterol from around the body and transports it back to the liver. While it is primarily beneficial, it can become harmful if modified by inflammation or immune responses. Low HDL cholesterol (HDL-C) is linked to cardiovascular diseases (CVD), metabolic syndrome, diabetes, inflammation, certain genetic factors, and liver disease. High HDL-C is associated with genetic factors, excessive exercise, and an increase in all-cause mortality. Very high or low HDL-C levels need to be evaluated alongside other cardiovascular and genetic risk factors. It is crucial to note that while the level of HDL-C may indicate cardiovascular risk, the functionality of the HDL molecule also plays a significant role in its cardioprotective benefits.
Standard Range: 46 - 100 mg/dL (1.19 - 2.59 mmol/L)
The ODX Range: 55 – 93 mg/dL (1.42 – 2.41 mmol/L)
References
Bardagjy, Allison S, and Francene M Steinberg. “Relationship Between HDL Functional Characteristics and Cardiovascular Health and Potential Impact of Dietary Patterns: A Narrative Review.” Nutrients vol. 11,6 1231. 30 May. 2019, doi:10.3390/nu11061231
Cho, Kyung-Hyun. “The Current Status of Research on High-Density Lipoproteins (HDL): A Paradigm Shift from HDL Quantity to HDL Quality and HDL Functionality.” International journal of molecular sciences vol. 23,7 3967. 2 Apr. 2022, doi:10.3390/ijms23073967
de Miranda Teixeira, Raissa et al. “HDL Particle Size and Functionality Comparison between Patients with and without Confirmed Acute Myocardial Infarction.” Cardiology research and practice vol. 2019 3074602. 3 Mar. 2019, doi:10.1155/2019/3074602
Jiang, Zhenghui Gordon et al. “Low LDL-C and high HDL-C levels are associated with elevated serum transaminases amongst adults in the United States: a cross-sectional study.” PloS one vol. 9,1 e85366. 15 Jan. 2014, doi:10.1371/journal.pone.0085366
Lee, Jane J et al. “Cholesterol Efflux Capacity and Its Association With Adverse Cardiovascular Events: A Systematic Review and Meta-Analysis.” Frontiers in cardiovascular medicine vol. 8 774418. 13 Dec. 2021, doi:10.3389/fcvm.2021.774418
Lupton, Joshua R et al. “Deficient serum 25-hydroxyvitamin D is associated with an atherogenic lipid profile: The Very Large Database of Lipids (VLDL-3) study.” Journal of clinical lipidology vol. 10,1 (2016): 72-81.e1. doi:10.1016/j.jacl.2015.09.006
Madsen, Christian M et al. “Lipoprotein(a)-Lowering by 50 mg/dL (105 nmol/L) May Be Needed to Reduce Cardiovascular Disease 20% in Secondary Prevention: A Population-Based Study.” Arteriosclerosis, thrombosis, and vascular biology vol. 40,1 (2020): 255-266. doi:10.1161/ATVBAHA.119.312951
Marz, Winfried et al. “HDL cholesterol: reappraisal of its clinical relevance.” Clinical research in cardiology: official journal of the German Cardiac Society vol. 106,9 (2017): 663-675. doi:10.1007/s00392-017-1106-1
Millan, Jesus et al. “Lipoprotein ratios: Physiological significance and clinical usefulness in cardiovascular prevention.” Vascular health and risk management vol. 5 (2009): 757-65.
Orozco-Beltran, Domingo et al. “Lipid profile, cardiovascular disease and mortality in a Mediterranean high-risk population: The ESCARVAL-RISK study.” PloS one vol. 12,10 e0186196. 18 Oct. 2017, doi:10.1371/journal.pone.0186196 Correction
Pagana, Kathleen Deska, et al. Mosby's Diagnostic and Laboratory Test Reference. 15th ed., Mosby, 2021.
Rizos, C V et al. “Effects of thyroid dysfunction on lipid profile.” The open cardiovascular medicine journal vol. 5 (2011): 76-84. doi:10.2174/1874192401105010076
Shah, Prediman K, and Dalgisio Lecis. “Inflammation in atherosclerotic cardiovascular disease.” F1000Research vol. 8 F1000 Faculty Rev-1402. 9 Aug. 2019, doi:10.12688/f1000research.18901.1
Van Name, Jonathan P. and Saurabh Sharma. “Low HDL Cholesterol.” StatPearls, StatPearls Publishing, 2 August 2025.
von Eckardstein, Arnold et al. “High-density lipoprotein revisited: biological functions and clinical relevance.” European heart journal vol. 44,16 (2023): 1394-1407. doi:10.1093/eurheartj/ehac605
Wilkins, John T, and Henrique S Seckler. “HDL modification: recent developments and their relevance to atherosclerotic cardiovascular disease.” Current opinion in lipidology vol. 30,1 (2019): 24-29. doi:10.1097/MOL.0000000000000571
Non-HDL Cholesterol
Non-HDL cholesterol is calculated by subtracting HDL cholesterol from the total cholesterol level. It encompasses all types of cholesterol in the blood except HDL. Higher levels of non-HDL cholesterol are linked with an increased risk of cardiovascular diseases like heart attacks and strokes. Non-HDL cholesterol is considered a more reliable indicator of heart disease risk than LDL cholesterol alone, especially for individuals on statin medications. However, this measure doesn't provide details about the size, number, or oxidation status of cholesterol particles, which are also important factors in assessing cardiovascular risk. Low levels of non-HDL cholesterol generally suggest a lower risk of heart disease, but extremely low levels might indicate other health issues, such as malnutrition.
Standard Range: 0 - 130 mg/dL (0 - 3.37 mmol/L)
The ODX Range: 70 – 99 mg/dL (1.18 – 2.56 mmol/L)
OPTIMAL DX MEMBERS CLICK HERE for more information on Non-HDL-C
References
Acevedo, Mónica et al. [Total/HDL cholesterol ratio and non HDL cholesterol as predictors for increased intima media thickness]. Revista medica de Chile vol. 140,8 (2012): 969-76. doi:10.4067/S0034-98872012000800001
Adhyaru, Bhavin B, and Terry A Jacobson. “New Cholesterol Guidelines for the Management of Atherosclerotic Cardiovascular Disease Risk: A Comparison of the 2013 American College of Cardiology/American Heart Association Cholesterol Guidelines with the 2014 National Lipid Association Recommendations for Patient-Centered Management of Dyslipidemia.” Endocrinology and metabolism clinics of North America vol. 45,1 (2016): 17-37. doi:10.1016/j.ecl.2015.09.002
Arnett, Donna K et al. “2019 ACC/AHA Guideline on the Primary Prevention of Cardiovascular Disease: Executive Summary: A Report of the American College of Cardiology/American Heart Association Task Force on Clinical Practice Guidelines.” Journal of the American College of Cardiology vol. 74,10 (2019): 1376-1414. doi:10.1016/j.jacc.2019.03.009
Castaner, Olga et al. “Remnant Cholesterol, Not LDL Cholesterol, Is Associated With Incident Cardiovascular Disease.” Journal of the American College of Cardiology vol. 76,23 (2020): 2712-2724. doi:10.1016/j.jacc.2020.10.008
Heidemann, Britt E et al. “The relation between VLDL-cholesterol and risk of cardiovascular events in patients with manifest cardiovascular disease.” International journal of cardiology vol. 322 (2021): 251-257. doi:10.1016/j.ijcard.2020.08.030
Johannesen, Camilla Ditlev Lindhardt et al. “Apolipoprotein B and Non-HDL Cholesterol Better Reflect Residual Risk Than LDL Cholesterol in Statin-Treated Patients.” Journal of the American College of Cardiology vol. 77,11 (2021): 1439-1450. doi:10.1016/j.jacc.2021.01.027
Lupton, Joshua R et al. “Deficient serum 25-hydroxyvitamin D is associated with an atherogenic lipid profile: The Very Large Database of Lipids (VLDL-3) study.” Journal of clinical lipidology vol. 10,1 (2016): 72-81.e1. doi:10.1016/j.jacl.2015.09.006
NCD Risk Factor Collaboration (NCD-RisC). “Repositioning of the global epicentre of non-optimal cholesterol.” Nature vol. 582,7810 (2020): 73-77. doi:10.1038/s41586-020-2338-1
Pagana, Kathleen Deska; Pagana, Timothy J.; Pagana, Theresa N. Mosby's Diagnostic and Laboratory Test Reference. Elsevier Health Sciences. 2019.
Schade, David S et al. “Cholesterol Review: A Metabolically Important Molecule.” Endocrine practice : official journal of the American College of Endocrinology and the American Association of Clinical Endocrinologists vol. 26,12 (2020): 1514-1523. doi:10.4158/EP-2020-0347
Sniderman, Allan et al. “Why is non-high-density lipoprotein cholesterol a better marker of the risk of vascular disease than low-density lipoprotein cholesterol?.” Journal of clinical lipidology vol. 4,3 (2010): 152-5. doi:10.1016/j.jacl.2010.03.005
Wang, Dianhui et al. “Higher non-HDL-cholesterol to HDL-cholesterol ratio linked with increased nonalcoholic steatohepatitis.” Lipids in health and disease vol. 17,1 67. 3 Apr. 2018, doi:10.1186/s12944-018-0720-x
Wang, Kun et al. “Non-HDL-cholesterol to HDL-cholesterol ratio is a better predictor of new-onset non-alcoholic fatty liver disease than non-HDL-cholesterol: a cohort study.” Lipids in health and disease vol. 17,1 196. 21 Aug. 2018, doi:10.1186/s12944-018-0848-8
Wen, Jia et al. “Associations of non-high-density lipoprotein cholesterol, triglycerides and the total cholesterol/HDL-c ratio with arterial stiffness independent of low-density lipoprotein cholesterol in a Chinese population.” Hypertension research : official journal of the Japanese Society of Hypertension vol. 42,8 (2019): 1223-1230. doi:10.1038/s41440-019-0251-5
Wongcharoen, Wanwarang et al. “Is non-HDL-cholesterol a better predictor of long-term outcome in patients after acute myocardial infarction compared to LDL-cholesterol? : a retrospective study.” BMC cardiovascular disorders vol. 17,1 10. 5 Jan. 2017, doi:10.1186/s12872-016-0450-9
Total Cholesterol to HDL-C Ratio
The ratio of total cholesterol to HDL-cholesterol (TC/HDL-C) offers insights into the body's cholesterol metabolism and processing. This ratio, also known as the atherogenic or Castelli Index, is a more reliable predictive indicator of cardiovascular disease (CVD) than isolated biomarkers like LDL-C. A rising ratio signals a relative decrease in HDL, the lipoprotein that eliminates excess cholesterol. High TC/HDL-C ratios are linked to an increased risk of atherosclerosis, carotid plaque, non-alcoholic fatty liver disease, and glucose dysregulation, while lower ratios are generally seen as favorable. Overall, a balance in this ratio is crucial for optimal health.
Standard Range: 0.00 - 5.00 Ratio
The ODX Range: 0.00 - 3.00 Ratio
OPTIMAL DX MEMBERS CLICK HERE for more information on Total Cholesterol:HDL-C Ratio
References
Acevedo, Mónica et al. [Total/HDL cholesterol ratio and non HDL cholesterol as predictors for increased intima media thickness]. Revista medica de Chile vol. 140,8 (2012): 969-76. doi:10.4067/S0034-98872012000800001
Calling, Susanna et al. “Total cholesterol/HDL-C ratio versus non-HDL-C as predictors for ischemic heart disease: a 17-year follow-up study of women in southern Sweden.” BMC cardiovascular disorders vol. 21,1 163. 5 Apr. 2021, doi:10.1186/s12872-021-01971-1
Jeppesen, J et al. “Individuals with high total cholesterol/HDL cholesterol ratios are insulin resistant.” Journal of internal medicine vol. 243,4 (1998): 293-8. doi:10.1046/j.1365-2796.1998.00301.x
Kappelle, P J W H et al. “Apolipoprotein B/A-I and total cholesterol/high-density lipoprotein cholesterol ratios both predict cardiovascular events in the general population independently of nonlipid risk factors, albuminuria and C-reactive protein.” Journal of internal medicine vol. 269,2 (2011): 232-42. doi:10.1111/j.1365-2796.2010.02323.x
Millan, Jesus et al. “Lipoprotein ratios: Physiological significance and clinical usefulness in cardiovascular prevention.” Vascular health and risk management vol. 5 (2009): 757-65.
Orozco-Beltran, Domingo et al. “Lipid profile, cardiovascular disease and mortality in a Mediterranean high-risk population: The ESCARVAL-RISK study.” PloS one vol. 12,10 e0186196. 18 Oct. 2017, doi:10.1371/journal.pone.0186196
Pagana, Kathleen Deska, et al. Mosby's Diagnostic and Laboratory Test Reference. 15th ed., Mosby, 2021.
Quispe, Renato et al. “Total cholesterol/HDL-cholesterol ratio discordance with LDL-cholesterol and non-HDL-cholesterol and incidence of atherosclerotic cardiovascular disease in primary prevention: The ARIC study.” European journal of preventive cardiology vol. 27,15 (2020): 1597-1605. doi:10.1177/2047487319862401
Ren, Xiao Yu et al. “Total cholesterol to high-density lipoprotein cholesterol ratio is a significant predictor of nonalcoholic fatty liver: Jinchang cohort study.” Lipids in health and disease vol. 18,1 47. 11 Feb. 2019, doi:10.1186/s12944-019-0984-9
Wen, Jia et al. “Associations of non-high-density lipoprotein cholesterol, triglycerides and the total cholesterol/HDL-c ratio with arterial stiffness independent of low-density lipoprotein cholesterol in a Chinese population.” Hypertension research : official journal of the Japanese Society of Hypertension vol. 42,8 (2019): 1223-1230. doi:10.1038/s41440-019-0251-5
Yu, Dahai et al. “Total/high density lipoprotein cholesterol and cardiovascular disease (re)hospitalization nadir in type 2 diabetes.” Journal of lipid research vol. 59,9 (2018): 1745-1750. doi:10.1194/jlr.P084269
Zhang, Zhiqiang et al. “Association of total cholesterol to high-density lipoprotein cholesterol ratio with diabetes risk: a retrospective study of Chinese individuals.” Scientific reports vol. 15,1 16261. 9 May. 2025, doi:10.1038/s41598-025-87277-0
LDL Cholesterol to HDL-C Ratio
The LDL-C to HDL-C ratio (LDL-C/HDL-C) represents the balance between cholesterol distribution (LDL) and cholesterol removal (HDL) in the body. A higher LDL-C/HDL-C ratio is linked to a heightened risk of atherosclerosis, major adverse cardiac events (MACE), ischemic stroke, non-alcoholic fatty liver disease (NAFLD), and diabetes, especially in individuals with hypertension. Conversely, a lower LDL-C/HDL-C ratio is generally considered healthier unless LDL cholesterol levels drop to unhealthily low levels. This ratio thus provides an important biomarker for cardiovascular risk assessment. It is noteworthy, however, that statin therapy may affect the prognostic value of the LD-C/HDL-C ratio following an ischemic stroke, necessitating further research in this area.
OPTIMAL DX MEMBERS CLICK HERE for more information on LDL-C to LDL-C Ratio
References
Fernandez, Maria Luz, and Densie Webb. “The LDL to HDL cholesterol ratio as a valuable tool to evaluate coronary heart disease risk.” Journal of the American College of Nutrition vol. 27,1 (2008): 1-5. doi:10.1080/07315724.2008.10719668
Hong, Mengyang et al. “Contribution and interaction of the low-density lipoprotein cholesterol to high-density lipoprotein cholesterol ratio and triglyceride to diabetes in hypertensive patients: A cross-sectional study.” Journal of diabetes investigation vol. 10,1 (2019): 131-138. doi:10.1111/jdi.12856
Liu, Li et al. “Association of LDL-C/HDL-C Ratio With Stroke Outcomes Within 1 Year After Onset: A Hospital-Based Follow-Up Study.” Frontiers in neurology vol. 11 408. 15 May. 2020, doi:10.3389/fneur.2020.00408
Qin, Pei et al. “Low-Density Lipoprotein Cholesterol/High-Density Lipoprotein Cholesterol Ratio and Carotid Intima-Media Thickness: A Cohort Study in China.” Lipids vol. 56,1 (2021): 59-68. doi:10.1002/lipd.12274
Zhong, Zhixiong et al. “Assessment of the LDL-C/HDL-C ratio as a predictor of one year clinical outcomes in patients with acute coronary syndromes after percutaneous coronary intervention and drug-eluting stent implantation.” Lipids in health and disease vol. 18,1 40. 2 Feb. 2019, doi:10.1186/s12944-019-0979-6
Zou, Yang et al. “LDL/HDL cholesterol ratio is associated with new-onset NAFLD in Chinese non-obese people with normal lipids: a 5-year longitudinal cohort study.” Lipids in health and disease vol. 20,1 28. 25 Mar. 2021, doi:10.1186/s12944-021-01457-1
Triglycerides
Triglycerides, a type of fat found in the diet, body fat, and blood, are made up of a glycerol backbone and three fatty acid types. Post-meal, triglyceride levels rise but should return to normal shortly. Persistently high triglyceride levels indicate metabolic dysfunction and are linked to several conditions, including obesity, cardiovascular disease, metabolic syndrome, mitochondrial dysfunction, and pancreatitis. On the other hand, low levels may suggest malabsorption, inadequate intake, liver impairment, or hyperthyroidism.
Standard Range: 0.00 - 150.00 mg/dL (0.00 - 1.69 mmol/L)
The ODX Range: 50 - 80 mg/dL (0.56 - 0.90 mmol/L)
OPTIMAL DX MEMBERS CLICK HERE for more information on Triglycerides
References
Aberra, Tsion et al. “The association between triglycerides and incident cardiovascular disease: What is "optimal"?.” Journal of clinical lipidology vol. 14,4 (2020): 438-447.e3. doi:10.1016/j.jacl.2020.04.009
Alcantara, Leticia M et al. “Low triglyceride levels are associated with a better metabolic control in patients with type 1 diabetes.” Diabetology & metabolic syndrome vol. 3 22. 2 Sep. 2011, doi:10.1186/1758-5996-3-22
Aminov, Zafar et al. “Analysis of the effects of exposure to polychlorinated biphenyls and chlorinated pesticides on serum lipid levels in residents of Anniston, Alabama.” Environmental health : a global access science source vol. 12 108. 11 Dec. 2013, doi:10.1186/1476-069X-12-108
Arsenault, Benoit J et al. “Lipid parameters for measuring risk of cardiovascular disease.” Nature reviews. Cardiology vol. 8,4 (2011): 197-206. doi:10.1038/nrcardio.2010.223
Gropper, Sareen S.; Smith, Jack L.; Carr, Timothy P. Advanced Nutrition and Human Metabolism. 8th edition. Wadsworth Publishing Co Inc. 2021.
Hong, Mengyang et al. “Contribution and interaction of the low-density lipoprotein cholesterol to high-density lipoprotein cholesterol ratio and triglyceride to diabetes in hypertensive patients: A cross-sectional study.” Journal of diabetes investigation vol. 10,1 (2019): 131-138. doi:10.1111/jdi.12856
Jiang, Z G et al. “Low-fasting triglyceride levels are associated with non-invasive markers of advanced liver fibrosis among adults in the United States.” Alimentary pharmacology & therapeutics vol. 42,1 (2015): 106-16. doi:10.1111/apt.13216
Klempfner, Robert et al. “Elevated Triglyceride Level Is Independently Associated With Increased All-Cause Mortality in Patients With Established Coronary Heart Disease: Twenty-Two-Year Follow-Up of the Bezafibrate Infarction Prevention Study and Registry.” Circulation. Cardiovascular quality and outcomes vol. 9,2 (2016): 100-8. doi:10.1161/CIRCOUTCOMES.115.002104
Le-Ha, Chi et al. “Hypothalamic-pituitary-adrenal axis activity under resting conditions and cardiovascular risk factors in adolescents.” Psychoneuroendocrinology vol. 66 (2016): 118-24. doi:10.1016/j.psyneuen.2016.01.002
Moon, Sang Yi et al. “Associations between non-insulin-based insulin resistance surrogate markers and liver-related outcomes in metabolic dysfunction-associated steatotic liver disease: a nationwide cohort study in South Korea.” BMC gastroenterology vol. 25,1 274. 18 Apr. 2025, doi:10.1186/s12876-025-03877-0
Pagana, Kathleen Deska, et al. Mosby's Diagnostic and Laboratory Test Reference. 15th ed., Mosby, 2021.
Parhofer, Klaus G, and Ulrich Laufs. “The Diagnosis and Treatment of Hypertriglyceridemia.” Deutsches Arzteblatt international vol. 116,49 (2019): 825-832. doi:10.3238/arztebl.2019.0825
Reshef, Lea et al. “Glyceroneogenesis and the triglyceride/fatty acid cycle.” The Journal of biological chemistry vol. 278,33 (2003): 30413-6. doi:10.1074/jbc.R300017200
Takaeko, Yuji et al. “Lower triglyceride levels are associated with better endothelial function.” Journal of clinical lipidology vol. 15,3 (2021): 500-511. doi:10.1016/j.jacl.2021.04.004
Thomsen, Mette et al. “Low nonfasting triglycerides and reduced all-cause mortality: a mendelian randomization study.” Clinical chemistry vol. 60,5 (2014): 737-46. doi:10.1373/clinchem.2013.219881
White, Khendi T et al. “Identifying an Optimal Cutpoint for the Diagnosis of Hypertriglyceridemia in the Nonfasting State.” Clinical chemistry vol. 61,9 (2015): 1156-63. doi:10.1373/clinchem.2015.241752
Triglyceride to HDL-C Ratio
The ratio of triglycerides to HDL-C (TG:HDL) is a key indicator of lipid metabolism and cardiometabolic risk. A high ratio suggests an increase in triglycerides and a decrease in HDL, linked to conditions such as glucose intolerance, metabolic syndrome, hypertension, cardiovascular disease, and major adverse cardiovascular events. A lower ratio is typically desired, though it may be associated with an increased risk of short-term mortality following an ischemic stroke. The TG/HDL-C ratio can help assess risk for various diseases, and specific cut-offs have been proposed to identify risk levels in different populations.
Standard Range: 0.00 - 2.00 Ratio
OPTIMAL DX MEMBERS CLICK HERE for more information on Triglyceride:HDL-C Ratio
References
Chu, Shou-Yu et al. “Risk assessment of metabolic syndrome in adolescents using the triglyceride/high-density lipoprotein cholesterol ratio and the total cholesterol/high-density lipoprotein cholesterol ratio.” Annals of pediatric endocrinology & metabolism vol. 24,1 (2019): 41-48. doi:10.6065/apem.2019.24.1.41
Gomes-Filho, Isaac S et al. “Periodontitis and its higher levels of severity are associated with the triglyceride/high density lipoprotein cholesterol ratio.” Journal of periodontology vol. 92,11 (2021): 1509-1521. doi:10.1002/JPER.21-0004
Fan, Nengguang et al. “Triglycerides to high-density lipoprotein cholesterol ratio as a surrogate for nonalcoholic fatty liver disease: a cross-sectional study.” Lipids in health and disease vol. 18,1 39. 2 Feb. 2019, doi:10.1186/s12944-019-0986-7
Hajian-Tilaki, Karimollah et al. “Triglyceride to high-density lipoprotein cholesterol and low-density lipoprotein cholestrol to high-density lipoprotein cholesterol ratios are predictors of cardiovascular risk in Iranian adults: Evidence from a population-based cross-sectional study.” Caspian journal of internal medicine vol. 11,1 (2020): 53-61. doi:10.22088/cjim.11.1.53
Moriyama, Kengo. “The Association between the Triglyceride to High-density Lipoprotein Cholesterol Ratio and Low-density Lipoprotein Subclasses.” Internal medicine (Tokyo, Japan) vol. 59,21 (2020): 2661-2669. doi:10.2169/internalmedicine.4954-20
Scicali, Roberto et al. “High TG to HDL ratio plays a significant role on atherosclerosis extension in prediabetes and newly diagnosed type 2 diabetes subjects.” Diabetes/metabolism research and reviews vol. 37,2 (2021): e3367. doi:10.1002/dmrr.3367
Sultani, Rohullah et al. “Elevated Triglycerides to High-Density Lipoprotein Cholesterol (TG/HDL-C) Ratio Predicts Long-Term Mortality in High-Risk Patients.” Heart, lung & circulation vol. 29,3 (2020): 414-421. doi:10.1016/j.hlc.2019.03.019
Wakabayashi, Ichiro, and Takashi Daimon. “Comparison of discrimination for cardio-metabolic risk by different cut-off values of the ratio of triglycerides to HDL cholesterol.” Lipids in health and disease vol. 18,1 156. 27 Jul. 2019, doi:10.1186/s12944-019-1098-0
Yeh, Wei-Chung et al. “Elevated triglyceride-to-HDL cholesterol ratio is an indicator for insulin resistance in middle-aged and elderly Taiwanese population: a cross-sectional study.” Lipids in health and disease vol. 18,1 176. 11 Oct. 2019, doi:10.1186/s12944-019-1123-3
Start creating true practice success. An Optimal DX account will help you deliver insights into your patient’s health and generate intuitive, comprehensive Functional Health Reports and customer blood test-specific treatment plans.
Lipoproteins are complex particles composed of lipids and proteins that transport lipids, such as cholesterol and triglycerides, throughout the bloodstream. Apolipoproteins are the protein components of lipoproteins and play crucial roles in lipid transport, metabolism, and the regulation of lipoprotein function. Lipoprotein(a), also known as Lp(a), is a unique lipoprotein with a structural similarity to low-density lipoprotein cholesterol (LDL-C) but contains an additional apolipoprotein, apolipoprotein(a), bound to apolipoprotein B-100. Major apolipoproteins include apolipoprotein A-1 and apolipoprotein B. These apolipoproteins are associated with various lipoproteins, such as high-density lipoprotein (HDL), low-density lipoprotein (LDL), and very-low-density lipoprotein (VLDL), and play essential roles in lipid transport and metabolism. Lipoprotein(a), or Lp(a), is of particular interest due to its association with an increased risk of cardiovascular disease. Elevated Lp(a) levels are considered an independent risk factor for coronary artery disease, aortic valve stenosis, and thrombosis.
Apolipoprotein A-1 (Apo A-1)
Apolipoprotein A-1 (Apo A-1), the primary protein in high-density lipoprotein (HDL), plays a significant role in cholesterol management and blood clotting. Low levels can indicate a higher risk for cardiovascular disease, diabetes, and kidney dysfunction, while high levels are generally cardioprotective. Lifestyle changes, such as diet modification and exercise, along with certain medications, can influence Apo A-1 levels. As a marker, Apo A-1 proves more sensitive in identifying cardiovascular diseases and atherosclerosis than traditional lipid markers.
OPTIMAL DX MEMBERS CLICK HERE for more information on Apolipoprotein A-1
References
Ankit, B S et al. “Stronger relationship of serum apolipoprotein A-1 and B with diabetic retinopathy than traditional lipids.” Indian journal of endocrinology and metabolism vol. 21,1 (2017): 102-105. doi:10.4103/2230-8210.196030
As, Shilpasree et al. “A study of serum apolipoprotein A1, apolipoprotein B and lipid profile in stroke.” Journal of clinical and diagnostic research : JCDR vol. 7,7 (2013): 1303-6. doi:10.7860/JCDR/2013/5269.3123
Bardagjy, Allison S, and Francene M Steinberg. “Relationship Between HDL Functional Characteristics and Cardiovascular Health and Potential Impact of Dietary Patterns: A Narrative Review.” Nutrients vol. 11,6 1231. 30 May. 2019, doi:10.3390/nu11061231
Florvall, Gösta et al. “Apolipoprotein A1 is a stronger prognostic marker than are HDL and LDL cholesterol for cardiovascular disease and mortality in elderly men.” The journals of gerontology. Series A, Biological sciences and medical sciences vol. 61,12 (2006): 1262-6. doi:10.1093/gerona/61.12.1262
Haji Aghajani, Mohammad et al. “The association between apolipoprotein A-1 plasma level and premature coronary artery disease: A systematic review and meta-analysis.” International journal of clinical practice vol. 75,11 (2021): e14578. doi:10.1111/ijcp.14578
Pagana, Kathleen Deska, et al. Mosby's Diagnostic and Laboratory Test Reference. 15th ed., Mosby, 2021.
Rahim, Salma et al. “Serum Apo A-1 and Its Role as a Biomarker of Coronary Artery Disease.” Cureus vol. 8,12 e941. 24 Dec. 2016, doi:10.7759/cureus.941
Yaseen, Rehab Ibrahim et al. “The relation between Apo B/ApoA-1 ratio and the severity of coronary artery disease in patients with acute coronary syndrome.” The Egyptian heart journal : (EHJ) : official bulletin of the Egyptian Society of Cardiology vol. 73,1 24. 16 Mar. 2021, doi:10.1186/s43044-021-00150-z
Apolipoprotein B (Apo B)
Apolipoprotein B (Apo B), the primary protein component of LDL and VLDL, is crucial in the initiation of atherosclerosis and contributes to the formation of harmful plaques. Elevated Apo B levels are linked with several health conditions, including genetic hyperlipoproteinemia, hypothyroidism, obesity, and diabetic complications. Conversely, lower levels might be associated with conditions such as hyperthyroidism, chronic anemia, and malnutrition. Apo B plays an important role in predicting the severity of coronary artery disease (CAD) and diabetic retinopathy, and it is significantly associated with obesity-related complications.
Standard Range: 52.00 - 80.00 mg/dL (0.52 - 0.80 g/L)
The ODX Range: 52.00 - 80.00 mg/dL (0.52 - 0.80 g/L)
OPTIMAL DX MEMBERS CLICK HERE for more information on Apolipoprotein B
References
Ankit, B S et al. “Stronger relationship of serum apolipoprotein A-1 and B with diabetic retinopathy than traditional lipids.” Indian journal of endocrinology and metabolism vol. 21,1 (2017): 102-105. doi:10.4103/2230-8210.196030
Bissonnette, Simon et al. “High plasma apolipoprotein B identifies obese subjects who best ameliorate white adipose tissue dysfunction and glucose-induced hyperinsulinemia after a hypocaloric diet.” The American journal of clinical nutrition vol. 108,1 (2018): 62-76. doi:10.1093/ajcn/nqy070
Johannesen, Camilla Ditlev Lindhardt et al. “Apolipoprotein B and Non-HDL Cholesterol Better Reflect Residual Risk Than LDL Cholesterol in Statin-Treated Patients.” Journal of the American College of Cardiology vol. 77,11 (2021): 1439-1450. doi:10.1016/j.jacc.2021.01.027
Ohwada, Takayuki et al. “Apolipoprotein B correlates with intra-plaque necrotic core volume in stable coronary artery disease.” PloS one vol. 14,2 e0212539. 19 Feb. 2019, doi:10.1371/journal.pone.0212539
Pagana, Kathleen Deska, et al. Mosby's Diagnostic and Laboratory Test Reference. 15th ed., Mosby, 2021.
Sniderman, Allan D et al. “Apolipoprotein B Particles and Cardiovascular Disease: A Narrative Review.” JAMA cardiology vol. 4,12 (2019): 1287-1295. doi:10.1001/jamacardio.2019.3780
Yaseen, Rehab Ibrahim et al. “The relation between ApoB/ApoA-1 ratio and the severity of coronary artery disease in patients with acute coronary syndrome.” The Egyptian heart journal : (EHJ) : official bulletin of the Egyptian Society of Cardiology vol. 73,1 24. 16 Mar. 2021, doi:10.1186/s43044-021-00150-z
Apo B/Apo A-1 Ratio
The ratio of Apolipoprotein B (Apo B) to Apolipoprotein A-1 (Apo A-1) is a significant indicator of cardiometabolic disorders, including atherosclerosis, myocardial infarction, stroke, and metabolic syndrome. A higher ApoB/A-1 ratio reflects increased cardiovascular and cardiometabolic risk, as Apo B is associated with potentially harmful LDL and Apo A-1 with protective HDL. Thus, the ApoB/A-1 ratio is a potent tool for assessing cardiovascular disease risk, surpassing traditional biomarkers such as cholesterol levels. This ratio can also predict the risk of metabolic syndrome.
Standard Range:
Male: 0.00 - 0.77 Ratio
Female: 0.00 – 0.63 Ratio
The ODX Range: 0.00 - 0.60 Ratio
OPTIMAL DX MEMBERS CLICK HERE for more information on ApoB/Apo A-1 Ratio
References
Ankit, B S et al. “Stronger relationship of serum apolipoprotein A-1 and B with diabetic retinopathy than traditional lipids.” Indian journal of endocrinology and metabolism vol. 21,1 (2017): 102-105. doi:10.4103/2230-8210.196030
Budianto, Iskandar R et al. “The association between Apolipoprotein A1, Apolipoprotein B and their ratio with diabetes-related neuropathy in elderly patients.” Diabetic medicine : a journal of the British Diabetic Association vol. 43,3 (2026): e70227. doi:10.1111/dme.70227
Fu, Chao et al. “Association between the ApoB/ApoA1 ratio and both the severity and mortality of metabolic dysfunction-associated fatty liver disease.” BMC gastroenterology vol. 25,1 650. 26 Sep. 2025, doi:10.1186/s12876-025-04130-4
Jing F, Mao Y, Guo J, et al. The value of Apolipoprotein B/Apolipoprotein A1 ratio for metabolic syndrome diagnosis in a Chinese population: a cross-sectional study. Lipids Health Dis. 2014;13:81. Published 2014 May 14. doi:10.1186/1476-511X-13-81
Ivert, Torbjörn et al. “Elevated Apolipoprotein B/A-1 Ratio is Associated With an Increased Risk of Aortic Stenosis: Experience From the AMORIS Cohort.” Heart, lung & circulation vol. 30,7 (2021): 1050-1057. doi:10.1016/j.hlc.2020.12.005
Liu, Dong et al. “Association of the Apo B/ApoA-I ratio with stroke risk: Findings from the China Health and Nutrition Survey (CHNS).” Nutrition, metabolism, and cardiovascular diseases : NMCD vol. 32,1 (2022): 203-209. doi:10.1016/j.numecd.2021.09.033
Lima, Luciana Moreira et al. “Apo B/apo A-I ratio and cardiovascular risk prediction.” Arquivos brasileiros de cardiologia vol. 88,6 (2007): e187-90. doi:10.1590/s0066-782x2007000600014
Panayiotou, A et al. “ApoB/ApoA1 ratio and subclinical atherosclerosis.” International angiology : a journal of the International Union of Angiology vol. 27,1 (2008): 74-80.
Reynoso-Villalpando, Gabriela Lizet et al. “ApoB/ApoA1 ratio and non-HDL-cholesterol/HDL-cholesterol ratio are associated to metabolic syndrome in patients with type 2 diabetes mellitus subjects and to ischemic cardiomyopathy in diabetic women.” Endocrinologia, diabetes y nutricion vol. 66,8 (2019): 502-511. doi:10.1016/j.endinu.2019.03.019
Tamang, Hem Kumar et al. “Apo B/Apo A-I Ratio is Statistically A Better Predictor of Cardiovascular Disease (CVD) than Conventional Lipid Profile: A Study from Kathmandu Valley, Nepal.” Journal of clinical and diagnostic research : JCDR vol. 8,2 (2014): 34-6. doi:10.7860/JCDR/2014/7588.4000
Tian, Min et al. “Comparison of Apolipoprotein B/A1 ratio, Framingham risk score and TC/HDL-c for predicting clinical outcomes in patients undergoing percutaneous coronary intervention.” Lipids in health and disease vol. 18,1 202. 19 Nov. 2019, doi:10.1186/s12944-019-1144-y
Walldius, Göran et al. “The apoB/apoA-I ratio is better than the cholesterol ratios to estimate the balance between plasma proatherogenic and antiatherogenic lipoproteins and to predict coronary risk.” Clinical chemistry and laboratory medicine vol. 42,12 (2004): 1355-63. doi:10.1515/CCLM.2004.254
Yaseen, Rehab Ibrahim et al. “The relation between ApoB/ApoA-1 ratio and the severity of coronary artery disease in patients with acute coronary syndrome.” The Egyptian heart journal : (EHJ) : official bulletin of the Egyptian Society of Cardiology vol. 73,1 24. 16 Mar. 2021, doi:10.1186/s43044-021-00150-z
Lipoprotein(a)
Lipoprotein (a), or Lp(a), is a lipoprotein made up of Apo A attached to Apo B and is considered highly atherogenic and damaging to vascular endothelium. Elevated Lp(a) levels are associated with a higher risk of major cardiac and cerebrovascular events, whereas lower levels can occur due to malnutrition, alcoholism, and liver disease. Lp(a) level is considered an independent risk factor for atherosclerosis and, therefore, has a significant impact on health. Adopting a plant-based diet for a month has been found to significantly decrease Lp(a) levels, alongside other risk markers for cardiovascular disease.
Standard Range: 0.00 - 75.00 nmol/L
The ODX Range: 0.00 - 18.00 nmol/L
OPTIMAL DX MEMBERS CLICK HERE for more information on Lipoprotein(a)
References
Capoulade, Romain et al. “Oxidized Phospholipids, Lipoprotein(a), and Progression of Calcific Aortic Valve Stenosis.” Journal of the American College of Cardiology vol. 66,11 (2015): 1236-1246. doi:10.1016/j.jacc.2015.07.020
Langsted, Anne et al. “Elevated Lipoprotein(a) and Risk of Ischemic Stroke.” Journal of the American College of Cardiology vol. 74,1 (2019): 54-66. doi:10.1016/j.jacc.2019.03.524
Madsen, Christian M et al. “Lipoprotein(a)-Lowering by 50 mg/dL (105 nmol/L) May Be Needed to Reduce Cardiovascular Disease 20% in Secondary Prevention: A Population-Based Study.” Arteriosclerosis, thrombosis, and vascular biology vol. 40,1 (2020): 255-266. doi:10.1161/ATVBAHA.119.312951
Mitsuda, Takayuki et al. “Lipoprotein(a) levels predict adverse vascular events after acute myocardial infarction.” Heart and vessels vol. 31,12 (2016): 1923-1929. doi:10.1007/s00380-016-0823-0
Muramatsu, Yusuke et al. “Lipoprotein (a) level is associated with plaque vulnerability in patients with coronary artery disease: An optical coherence tomography study.” International journal of cardiology. Heart & vasculature vol. 24 100382. 13 Jun. 2019, doi:10.1016/j.ijcha.2019.100382
Najjar, Rami S et al. “Consumption of a defined, plant-based diet reduces lipoprotein(a), inflammation, and other atherogenic lipoproteins and particles within 4 weeks.” Clinical cardiology vol. 41,8 (2018): 1062-1068. doi:10.1002/clc.23027
Pagana, Kathleen Deska, et al. Mosby's Diagnostic and Laboratory Test Reference. 15th ed., Mosby, 2021.
Tsimikas, Sotirios. “A Test in Context: Lipoprotein(a): Diagnosis, Prognosis, Controversies, and Emerging Therapies.” Journal of the American College of Cardiology vol. 69,6 (2017): 692-711. doi:10.1016/j.jacc.2016.11.042
Lipoprotein subfractionation takes a closer look at the lipoproteins that carry cholesterol, triglycerides, antioxidants, and other compounds through the blood. This technology allows for the assessment of the size, density, and particle number of different lipoprotein classes, including VLDL, LDL, and HDL. NMR spectroscopy: NMR utilizes the magnetic properties of certain atomic nuclei to determine the physical and chemical properties of molecules. In the context of lipoprotein subfractionation, NMR measures the signals generated by lipoprotein particles in a blood sample. The size and concentration of different lipoprotein subclasses can be determined based on the characteristics of their NMR signals. NMR lipoprotein subfractionation can provide information on various lipoprotein subclasses, such as small and large LDL particles, small and large HDL particles, and intermediate-density lipoprotein (IDL) particles.
LDL Particle Number (LDL-P) (NMR)
Measuring low-density lipoprotein particle number (LDL-P) is a more effective method for evaluating cardiovascular risk and detecting subclinical disease than solely measuring LDL cholesterol. High LDL-P is linked to other cardiovascular risk factors, such as inflammation, insulin resistance, hypertriglyceridemia, and increased coronary artery calcium score. A low LDL-P may not hold clinical significance.
OPTIMAL DX MEMBERS CLICK HERE for more information on LDL Particle Number (LDL-P)
References
Cromwell, William C et al. “LDL Particle Number and Risk of Future Cardiovascular Disease in the Framingham Offspring Study - Implications for LDL Management.” Journal of clinical lipidology vol. 1,6 (2007): 583-92. doi:10.1016/j.jacl.2007.10.001
Feingold, Kenneth R. “Utility of Advanced Lipoprotein Testing in Clinical Practice.” Endotext, edited by Kenneth R Feingold et. al., MDText.com, Inc., 3 January 2023.
Garshick, M et al. “Reduction in dietary trans fat intake is associated with decreased LDL particle number in a primary prevention population.” Nutrition, metabolism, and cardiovascular diseases : NMCD vol. 24,1 (2014): 100-6. doi:10.1016/j.numecd.2013.06.003
Langlois, Michel R et al. “Quantifying Atherogenic Lipoproteins: Current and Future Challenges in the Era of Personalized Medicine and Very Low Concentrations of LDL Cholesterol. A Consensus Statement from EAS and EFLM.” Clinical chemistry vol. 64,7 (2018): 1006-1033. doi:10.1373/clinchem.2018.287037
Malave, Hector et al. “Evaluation of low-density lipoprotein particle number distribution in patients with type 2 diabetes mellitus with low-density lipoprotein cholesterol <50 mg/dl and non-high-density lipoprotein cholesterol <80 mg/dl.” The American journal of cardiology vol. 110,5 (2012): 662-5. doi:10.1016/j.amjcard.2012.04.046
Superko, Harold, and Brenda Garrett. “Small Dense LDL: Scientific Background, Clinical Relevance, and Recent Evidence Still a Risk Even with 'Normal' LDL-C Levels.” Biomedicines vol. 10,4 829. 1 Apr. 2022, doi:10.3390/biomedicines10040829
Talebi, Sepide et al. “The beneficial effects of nutraceuticals and natural products on small dense LDL levels, LDL particle number and LDL particle size: a clinical review.” Lipids in health and disease vol. 19,1 66. 11 Apr. 2020, doi:10.1186/s12944-020-01250-6
Varvel, Stephen A et al. “Discordance between apolipoprotein B and low-density lipoprotein particle number is associated with insulin resistance in clinical practice.” Journal of clinical lipidology vol. 9,2 (2015): 247-55. doi:10.1016/j.jacl.2014.11.005
LDL Particle Size (NMR)
Low-density lipoprotein (LDL) particles, responsible for the transportation of cholesterol in the blood, differ in size and associated cardiovascular risk. Small dense LDL (sdLDL) particles are more susceptible to oxidation and glycation, making them a greater risk factor for cardiovascular diseases and insulin resistance. The risk associated with LDL particles can be mitigated through lifestyle changes such as weight loss, regular exercise, and a healthy plant-based diet. These changes, along with certain natural products and foods, can help reduce the number of LDL particles and increase their size. Large LDL particles are considered cardioprotective and are associated with reduced cardiovascular disease risk and lower triglyceride levels.
Standard Range: 20.0 – 22.3 nm
The ODX Range: 20.50 – 22.30 nm
OPTIMAL DX MEMBERS CLICK HERE for more information on NMR LDL Size
References
Afanasieva, O I et al. Kardiologiia vol. 56,6 (2016): 5-11. doi:10.18565/cardio.2016.6.5-11
Aneni, Ehimen C et al. “Lipoprotein Sub-Fractions by Ion-Mobility Analysis and Its Association with Subclinical Coronary Atherosclerosis in High-Risk Individuals.” Journal of atherosclerosis and thrombosis vol. 26,1 (2019): 50-63. doi:10.5551/jat.40741
Bowden, Rodney G et al. “LDL particle size and number compared with LDL cholesterol and risk categorization in end-stage renal disease patients.” Journal of nephrology vol. 24,6 (2011): 771-7. doi:10.5301/JN.2011.6376
Chiu, Sally et al. “Effects of a very high saturated fat diet on LDL particles in adults with atherogenic dyslipidemia: A randomized controlled trial.” PloS one vol. 12,2 e0170664. 6 Feb. 2017, doi:10.1371/journal.pone.0170664
Davy, Brenda M et al. “High-fiber oat cereal compared with wheat cereal consumption favorably alters LDL-cholesterol subclass and particle numbers in middle-aged and older men.” The American journal of clinical nutrition vol. 76,2 (2002): 351-8. doi:10.1093/ajcn/76.2.351
Dodin, Sylvie et al. “Flaxseed on cardiovascular disease markers in healthy menopausal women: a randomized, double-blind, placebo-controlled trial.” Nutrition (Burbank, Los Angeles County, Calif.) vol. 24,1 (2008): 23-30. doi:10.1016/j.nut.2007.09.003
Ivanova, Ekaterina A et al. “Small Dense Low-Density Lipoprotein as Biomarker for Atherosclerotic Diseases.” Oxidative medicine and cellular longevity vol. 2017 (2017): 1273042. doi:10.1155/2017/1273042
Lamarche B, Tchernof A, Moorjani S, et al. Small, dense low-density lipoprotein particles as a predictor of the risk of ischemic heart disease in men. Prospective results from the Quebec Cardiovascular Study. Circulation. 1997 Jan 7;95(1):69-75.
Liou, Lathan, and Stephen Kaptoge. “Association of small, dense LDL-cholesterol concentration and lipoprotein particle characteristics with coronary heart disease: A systematic review and meta-analysis.” PloS one vol. 15,11 e0241993. 9 Nov. 2020, doi:10.1371/journal.pone.0241993
Talebi, Sepide et al. “The beneficial effects of nutraceuticals and natural products on small dense LDL levels, LDL particle number and LDL particle size: a clinical review.” Lipids in health and disease vol. 19,1 66. 11 Apr. 2020, doi:10.1186/s12944-020-01250-6
Witte, D R et al. “Study of agreement between LDL size as measured by nuclear magnetic resonance and gradient gel electrophoresis.” Journal of lipid research vol. 45,6 (2004): 1069-76. doi:10.1194/jlr.M300395-JLR200
Small LDL-P (sdLDL) (NMR)
Small dense low-density lipoprotein particles (sdLDLs) are more closely associated with an increased risk of cardiovascular diseases (CVD) than LDL-cholesterol due to their higher susceptibility to oxidation, making them more atherogenic. High sdLDLs are linked to conditions like elevated triglycerides, metabolic syndrome, diabetes, and arthritis. A lower level of sdLDLs is considered healthier and can be achieved through a balanced diet, physical exercise, and specific nutrition supplements. sdLDLs are regarded as reliable indicators for detecting CVD and metabolic syndrome, and their presence can indicate up to a three-fold increased risk of coronary heart disease. Certain lifestyle changes, alongside the consumption of natural substances like phytosterols, polyphenols, omega-3 fatty acids, and a Mediterranean-style diet, can help reduce sdLDL levels.
Standard Range: 0.00 – 1408.00 nmol/L
The ODX Range: 0.00 – 467.00 nmol/L
OPTIMAL DX MEMBERS CLICK HERE for more information on NMR Small Dense LDLs
References
Feingold, Kenneth R. “Utility of Advanced Lipoprotein Testing in Clinical Practice.” Endotext, edited by Kenneth R Feingold et. al., MDText.com, Inc., 3 January 2023.
Froyen, Erik. “The effects of fat consumption on low-density lipoprotein particle size in healthy individuals: a narrative review.” Lipids in health and disease vol. 20,1 86. 6 Aug. 2021, doi:10.1186/s12944-021-01501-0
Gerber, Philipp A et al. “Small, dense LDL: an update.” Current opinion in cardiology vol. 32,4 (2017): 454-459. doi:10.1097/HCO.0000000000000410
Ivanova, Ekaterina A et al. “Small Dense Low-Density Lipoprotein as Biomarker for Atherosclerotic Diseases.” Oxidative medicine and cellular longevity vol. 2017 (2017): 1273042. doi:10.1155/2017/1273042
Lee, Yujin et al. “Effects of Dark Chocolate and Almonds on Cardiovascular Risk Factors in Overweight and Obese Individuals: A Randomized Controlled-Feeding Trial.” Journal of the American Heart Association vol. 6,12 e005162. 29 Nov. 2017, doi:10.1161/JAHA.116.005162
Nikolic, Dragana et al. “Lipoprotein subfractions in metabolic syndrome and obesity: clinical significance and therapeutic approaches.” Nutrients vol. 5,3 928-48. 18 Mar. 2013, doi:10.3390/nu5030928
Parra, Eliane Soler et al. “HDL size is more accurate than HDL cholesterol to predict carotid subclinical atherosclerosis in individuals classified as low cardiovascular risk.” PloS one vol. 9,12 e114212. 3 Dec. 2014, doi:10.1371/journal.pone.0114212
Sæther, Julie Caroline et al. “Small LDL subfractions are associated with coronary atherosclerosis despite no differences in conventional lipids.” Physiological genomics vol. 55,1 (2023): 16-26. doi:10.1152/physiolgenomics.00098.2022
Superko HR. Advanced lipoprotein testing and subfractionation are clinically useful. Circulation. 2009;119:2383-2395.
Superko, Harold, and Brenda Garrett. “Small Dense LDL: Scientific Background, Clinical Relevance, and Recent Evidence Still a Risk Even with 'Normal' LDL-C Levels.” Biomedicines vol. 10,4 829. 1 Apr. 2022, doi:10.3390/biomedicines10040829
Talebi, Sepide et al. “The beneficial effects of nutraceuticals and natural products on small dense LDL levels, LDL particle number and LDL particle size: a clinical review.” Lipids in health and disease vol. 19,1 66. 11 Apr. 2020, doi:10.1186/s12944-020-01250-6
Vekic, Jelena et al. “Atherosclerosis Development and Progression: The Role of Atherogenic Small, Dense LDL.” Medicina (Kaunas, Lithuania) vol. 58,2 299. 16 Feb. 2022, doi:10.3390/medicina58020299
HDL Particle Number (HDL-P) (NMR)
High-density lipoprotein (HDL) particles have cardioprotective, antioxidant, and anti-inflammatory properties and play a crucial role in reverse cholesterol transport. A low HDL particle number (HDL-P) is associated with an increased cardiovascular risk and acute inflammation, while a high HDL-P is generally linked to genetic factors. Environmental factors such as air pollution can affect the functionality of HDL, and a healthy diet can support the number and function of HDL particles. HDL-P has been suggested as a superior biomarker compared to HDL cholesterol (HDL-C) for assessing cardiovascular risk, and has an inverse relationship with cardiovascular diseases.
Standard Range: 21.10 – 43.40 µmol/L
The ODX Range: 32.8 – 43.40 µmol/L
OPTIMAL DX MEMBERS CLICK HERE for more information on NMR HDL-P
References
Bardagjy, Allison S, and Francene M Steinberg. “Relationship Between HDL Functional Characteristics and Cardiovascular Health and Potential Impact of Dietary Patterns: A Narrative Review.” Nutrients vol. 11,6 1231. 30 May. 2019, doi:10.3390/nu11061231
Bell, Griffith et al. “Association of Air Pollution Exposures With High-Density Lipoprotein Cholesterol and Particle Number: The Multi-Ethnic Study of Atherosclerosis.” Arteriosclerosis, thrombosis, and vascular biology vol. 37,5 (2017): 976-982. doi:10.1161/ATVBAHA.116.308193
Cho, Kyung-Hyun. “The Current Status of Research on High-Density Lipoproteins (HDL): A Paradigm Shift from HDL Quantity to HDL Quality and HDL Functionality.” International journal of molecular sciences vol. 23,7 3967. 2 Apr. 2022, doi:10.3390/ijms23073967
de Miranda Teixeira, Raissa et al. “HDL Particle Size and Functionality Comparison between Patients with and without Confirmed Acute Myocardial Infarction.” Cardiology research and practice vol. 2019 3074602. 3 Mar. 2019, doi:10.1155/2019/3074602
Duparc, Thibaut et al. “Serum level of HDL particles are independently associated with long-term prognosis in patients with coronary artery disease: The GENES study.” Scientific reports vol. 10,1 8138. 18 May. 2020, doi:10.1038/s41598-020-65100-2
Lee, Jane J et al. “Cholesterol Efflux Capacity and Its Association With Adverse Cardiovascular Events: A Systematic Review and Meta-Analysis.” Frontiers in cardiovascular medicine vol. 8 774418. 13 Dec. 2021, doi:10.3389/fcvm.2021.774418
Ljunggren, Stefan A et al. “Persistent organic pollutants distribution in lipoprotein fractions in relation to cardiovascular disease and cancer.” Environment international vol. 65 (2014): 93-9. doi:10.1016/j.envint.2013.12.017
Mackey, Rachel H et al. “High-density lipoprotein cholesterol and particle concentrations, carotid atherosclerosis, and coronary events: MESA (multi-ethnic study of atherosclerosis).” Journal of the American College of Cardiology vol. 60,6 (2012): 508-16. doi:10.1016/j.jacc.2012.03.060
Marz, Winfried et al. “HDL cholesterol: reappraisal of its clinical relevance.” Clinical research in cardiology: official journal of the German Cardiac Society vol. 106,9 (2017): 663-675. doi:10.1007/s00392-017-1106-1
Orozco-Beltran, Domingo et al. “Lipid profile, cardiovascular disease and mortality in a Mediterranean high-risk population: The ESCARVAL-RISK study.” PloS one vol. 12,10 e0186196. 18 Oct. 2017, doi:10.1371/journal.pone.0186196 Correction
Pagana, Kathleen Deska, et al. Mosby's Diagnostic and Laboratory Test Reference. 15th ed., Mosby, 2021.
Shah, Prediman K, and Dalgisio Lecis. “Inflammation in atherosclerotic cardiovascular disease.” F1000Research vol. 8 F1000 Faculty Rev-1402. 9 Aug. 2019, doi:10.12688/f1000research.18901.1
Trieb, Markus et al. “Atrial fibrillation is associated with alterations in HDL function, metabolism, and particle number.” Basic research in cardiology vol. 114,4 27. 8 May. 2019, doi:10.1007/s00395-019-0735-0
Wada, Yasuaki et al. “A More Oxidized Plasma Albumin Redox State and Lower Plasma HDL Particle Number Reflect Low-Protein Diet Ingestion in Adult Rats.” The Journal of nutrition vol. 150,2 (2020): 256-266. doi:10.1093/jn/nxz223
Wilkins, John T, and Henrique S Seckler. “HDL modification: recent developments and their relevance to atherosclerotic cardiovascular disease.” Current opinion in lipidology vol. 30,1 (2019): 24-29. doi:10.1097/MOL.0000000000000571
HDL Particle Size (NMR)
High-density lipoproteins (HDLs) are complex particles that scavenge cholesterol from various tissues and return it to the liver for disposal. The size of these particles can influence their function and health benefits. Larger HDL particles are generally considered more protective against cardiovascular disease and diabetes, while smaller HDL particles may also offer health benefits, potentially in neuroprotection. Environmental factors, such as obesity, can influence HDL size and functionality, while certain dietary and lifestyle choices can support healthy HDL levels. However, the exact implications of HDL particle size on overall health continue to be the subject of ongoing research.
Standard Range: 8.3 – 10.50 nm
The ODX Range: 9.00 – 10.50 nm
OPTIMAL DX MEMBERS CLICK HERE for more information on NMR HDL Size
References
Bardagjy, Allison S, and Francene M Steinberg. “Relationship Between HDL Functional Characteristics and Cardiovascular Health and Potential Impact of Dietary Patterns: A Narrative Review.” Nutrients vol. 11,6 1231. 30 May. 2019, doi:10.3390/nu11061231
Beekman, Marian et al. “Lifestyle-Intervention-Induced Reduction of Abdominal Fat Is Reflected by a Decreased Circulating Glycerol Level and an Increased HDL Diameter.” Molecular nutrition & food research vol. 64,10 (2020): e1900818. doi:10.1002/mnfr.201900818
Camont, Laurent et al. “Biological activities of HDL subpopulations and their relevance to cardiovascular disease.” Trends in molecular medicine vol. 17,10 (2011): 594-603. doi:10.1016/j.molmed.2011.05.013
Cleveland Heart Lab. NMR. https://www.clevelandheartlab.com/tests/lipoprotein-fractionation-nmr-with-lipids/
DiMarco, Diana M et al. “Intake of up to 3 Eggs per Day Is Associated with Changes in HDL Function and Increased Plasma Antioxidants in Healthy, Young Adults.” The Journal of nutrition vol. 147,3 (2017): 323-329. doi:10.3945/jn.116.241877
Duparc, Thibaut et al. “Serum level of HDL particles are independently associated with long-term prognosis in patients with coronary artery disease: The GENES study.” Scientific reports vol. 10,1 8138. 18 May. 2020, doi:10.1038/s41598-020-65100-2
Kontush, Anatol. “HDL particle number and size as predictors of cardiovascular disease.” Frontiers in pharmacology vol. 6 218. 5 Oct. 2015, doi:10.3389/fphar.2015.00218
Lappegard, Knut Tore et al. “High-Density Lipoprotein Subfractions: Much Ado about Nothing or Clinically Important?.” Biomedicines vol. 9,7 836. 18 Jul. 2021, doi:10.3390/biomedicines9070836
Labcorp. Understanding the NMR Lipoprofile. https://www.labcorp.com/tests/related-documents/L15035
Lappegad, Knut Tore et al. “High-Density Lipoprotein Subfractions: Much Ado about Nothing or Clinically Important?.” Biomedicines vol. 9,7 836. 18 Jul. 2021, doi:10.3390/biomedicines9070836 This article is an open access article distributed under the terms and conditions of the Creative Commons Attribution (CC BY) license (https://creativecommons.org/licenses/by/4.0/).
Martinez, Ashley E et al. “The small HDL particle hypothesis of Alzheimer's disease.” Alzheimer's & dementia : the journal of the Alzheimer's Association vol. 19,2 (2023): 391-404. doi:10.1002/alz.12649
Parra, Eliane Soler et al. “HDL size is more accurate than HDL cholesterol to predict carotid subclinical atherosclerosis in individuals classified as low cardiovascular risk.” PloS one vol. 9,12 e114212. 3 Dec. 2014, doi:10.1371/journal.pone.0114212
Wilkins, John T, and Henrique S Seckler. “HDL modification: recent developments and their relevance to atherosclerotic cardiovascular disease.” Current opinion in lipidology vol. 30,1 (2019): 24-29. doi:10.1097/MOL.0000000000000571
Large HDL Particles (NMR)
Large High-Density Lipoprotein (HDL) particles, which are typically associated with lower cardiovascular risk, may offer a better measure of cardiovascular health than traditional HDL cholesterol (HDL-C) levels. Factors such as inflammation, obesity, and menopause can affect concentrations of these large HDL particles, leading to varying health implications among individuals with type 1 and type 2 diabetes. Nutritional interventions, such as consuming high-fiber nutrient-rich snack bars or eggs, have shown potential in increasing concentrations of large HDL particles, with higher concentrations considered cardioprotective. Meanwhile, low levels are linked with obesity, insulin resistance, metabolic syndrome, and increased risk of type 2 diabetes.
Standard Range: 3.5 – 50.00 µmol/L
The ODX Range: 7.2 – 50.00 µmol/L
OPTIMAL DX MEMBERS CLICK HERE for more information on NMR Large HDL Particles
References
Ahmed, Mohamad O et al. “HDL particle size is increased and HDL-cholesterol efflux is enhanced in type 1 diabetes: a cross-sectional study.” Diabetologia vol. 64,3 (2021): 656-667. doi:10.1007/s00125-020-05320-3
DiMarco, Diana M et al. “Intake of up to 3 Eggs per Day Is Associated with Changes in HDL Function and Increased Plasma Antioxidants in Healthy, Young Adults.” The Journal of nutrition vol. 147,3 (2017): 323-329. doi:10.3945/jn.116.241877
El Harchaoui, Karim et al. “High-density lipoprotein particle size and concentration and coronary risk.” Annals of internal medicine vol. 150,2 (2009): 84-93. doi:10.7326/0003-4819-150-2-200901200-00006
El Khoudary, Samar R et al. “HDL (High-Density Lipoprotein) Subclasses, Lipid Content, and Function Trajectories Across the Menopause Transition: SWAN-HDL Study.” Arteriosclerosis, thrombosis, and vascular biology vol. 41,2 (2021): 951-961. doi:10.1161/ATVBAHA.120.315355
Mietus-Snyder, Michele L et al. “A nutrient-dense, high-fiber, fruit-based supplement bar increases HDL cholesterol, particularly large HDL, lowers homocysteine, and raises glutathione in a 2-wk trial.” FASEB journal : official publication of the Federation of American Societies for Experimental Biology vol. 26,8 (2012): 3515-27. doi:10.1096/fj.11-201558
Mutharasan, R Kannan et al. “HDL efflux capacity, HDL particle size, and high-risk carotid atherosclerosis in a cohort of asymptomatic older adults: the Chicago Healthy Aging Study.” Journal of lipid research vol. 58,3 (2017): 600-606. doi:10.1194/jlr.P069039
Parra, Eliane Soler et al. “HDL size is more accurate than HDL cholesterol to predict carotid subclinical atherosclerosis in individuals classified as low cardiovascular risk.” PloS one vol. 9,12 e114212. 3 Dec. 2014, doi:10.1371/journal.pone.0114212
Sokooti, Sara et al. “HDL Particle Subspecies and Their Association With Incident Type 2 Diabetes: The PREVEND Study.” The Journal of clinical endocrinology and metabolism vol. 106,6 (2021): 1761-1772. doi:10.1210/clinem/dgab075
Vekic, Jelena et al. “High serum uric acid and low-grade inflammation are associated with smaller LDL and HDL particles.” Atherosclerosis vol. 203,1 (2009): 236-42. doi:10.1016/j.atherosclerosis.2008.05.047
Wilkins, John T, and Henrique S Seckler. “HDL modification: recent developments and their relevance to atherosclerotic cardiovascular disease.” Current opinion in lipidology vol. 30,1 (2019): 24-29. doi:10.1097/MOL.0000000000000571
VLDL Size (NMR)
Very low-density lipoprotein (VLDL) is a triglyceride-rich lipoprotein that transforms into Low-Density Lipoprotein (LDL) as it circulates and releases its triglyceride content. Larger VLDL particles carry more triglycerides, with larger particles associated with a higher risk of cardiovascular disease, insulin resistance, diabetes, pre-diabetes, and metabolic-associated fatty liver disease. Differentiating between the sizes of VLDL particles is crucial, as larger particles may contribute to cardiometabolic risk even without elevated total triglycerides. Smaller VLDL particles are linked to reduced cardiometabolic risk, while larger particles are associated with various health risks including cardiovascular disease and type 2 diabetes.
Standard Range: 41.10 – 61.70 nm
The ODX Range: 0.00 – 47.10 nm
OPTIMAL DX MEMBERS CLICK HERE for more information on NMR VLDL Size
References
Adiels, Martin et al. “Overproduction of very low-density lipoproteins is the hallmark of the dyslipidemia in the metabolic syndrome.” Arteriosclerosis, thrombosis, and vascular biology vol. 28,7 (2008): 1225-36. doi:10.1161/ATVBAHA.107.160192
Colhoun, Helen M et al. “Lipoprotein subclasses and particle sizes and their relationship with coronary artery calcification in men and women with and without type 1 diabetes.” Diabetes vol. 51,6 (2002): 1949-56. doi:10.2337/diabetes.51.6.1949
de Carvalho, Luiz Sérgio F., et al. "Biomarkers in Disease: Diabetes Methods, Discoveries, and Applications." Biomarkers in Diabetes. Cham: Springer International Publishing, 2022. 395-409.
German, J Bruce et al. “Lipoproteins: When size really matters.” Current opinion in colloid & interface science vol. 11,2-3 (2006): 171-183. doi:10.1016/j.cocis.2005.11.006
Ginsberg, Henry N et al. “Triglyceride-rich lipoproteins and their remnants: metabolic insights, role in atherosclerotic cardiovascular disease, and emerging therapeutic strategies-a consensus statement from the European Atherosclerosis Society.” European heart journal vol. 42,47 (2021): 4791-4806. doi:10.1093/eurheartj/ehab551
Lucero, Diego et al. “Predominance of large VLDL particles in metabolic syndrome, detected by size exclusion liquid chromatography.” Clinical biochemistry vol. 45,4-5 (2012): 293-7. doi:10.1016/j.clinbiochem.2011.12.013
Pagana, Kathleen Deska, et al. Mosby's Diagnostic and Laboratory Test Reference. 15th ed., Mosby, 2021.
Sokooti, Sara et al. “Triglyceride-rich lipoprotein and LDL particle subfractions and their association with incident type 2 diabetes: the PREVEND study.” Cardiovascular diabetology vol. 20,1 156. 28 Jul. 2021, doi:10.1186/s12933-021-01348-w
van Tienhoven-Wind, Lynnda, and Robin P F Dullaart. “Low normal thyroid function as a determinant of increased large very low density lipoprotein particles.” Clinical biochemistry vol. 48,7-8 (2015): 489-94. doi:10.1016/j.clinbiochem.2015.01.015
Large VLDL Particle Number (NMR)
Large Very low-density lipoprotein (VLDL) particles pose an increased risk for cardiovascular and cardiometabolic diseases and are identified as a key indicator for metabolic syndrome and a higher likelihood of type 2 diabetes. High levels of large VLDLs are associated with a variety of health issues, including atherosclerosis, coronary artery disease, insulin resistance, and type 2 diabetes. Conversely, low levels of large VLDLs suggest a decreased risk of these conditions and indicate better overall metabolic health. This dynamic signifies the role of large VLDLs as potential targets for improving metabolic health and reducing cardiometabolic risk. Factors like lifestyle, diet, and body weight also influence the levels of large VLDLs, providing avenues for intervention.
Conventional Lab Range: 0.00 – 16.00 nmol/L
The ODX Range: 0.00 – 3.70 nmol/L
OPTIMAL DX MEMBERS CLICK HERE for more information on NMR Large VLDL-P
References
Adiels, Martin et al. “Overproduction of very low-density lipoproteins is the hallmark of the dyslipidemia in the metabolic syndrome.” Arteriosclerosis, thrombosis, and vascular biology vol. 28,7 (2008): 1225-36. doi:10.1161/ATVBAHA.107.160192
Bays, Harold E et al. “Icosapent ethyl, a pure EPA omega-3 fatty acid: effects on lipoprotein particle concentration and size in patients with very high triglyceride levels (the MARINE study).” Journal of clinical lipidology vol. 6,6 (2012): 565-72. doi:10.1016/j.jacl.2012.07.001
Chapman, M John et al. “Triglyceride-rich lipoproteins and high-density lipoprotein cholesterol in patients at high risk of cardiovascular disease: evidence and guidance for management.” European heart journal vol. 32,11 (2011): 1345-61. doi:10.1093/eurheartj/ehr112
Colhoun, Helen M et al. “Lipoprotein subclasses and particle sizes and their relationship with coronary artery calcification in men and women with and without type 1 diabetes.” Diabetes vol. 51,6 (2002): 1949-56. doi:10.2337/diabetes.51.6.1949
Hämäläinen, Päivi et al. “Hemoglobin level and lipoprotein particle size.” Lipids in health and disease vol. 17,1 10. 10 Jan. 2018, doi:10.1186/s12944-018-0655-2
Heeren, Joerg, and Ludger Scheja. “Metabolic-associated fatty liver disease and lipoprotein metabolism.” Molecular metabolism vol. 50 (2021): 101238. doi:10.1016/j.molmet.2021.101238
Koba, Shinji et al. “Small dense LDL phenotype is associated with postprandial increases of large VLDL and remnant-like particles in patients with acute myocardial infarction.” Atherosclerosis vol. 170,1 (2003): 131-40. doi:10.1016/s0021-9150(03)00245-4
Mäntyselkä, Pekka et al. “Weight change and lipoprotein particle concentration and particle size: a cohort study with 6.5-year follow-up.” Atherosclerosis vol. 223,1 (2012): 239-43. doi:10.1016/j.atherosclerosis.2012.05.005
Pagana, Kathleen Deska, et al. Mosby's Diagnostic and Laboratory Test Reference. 15th ed., Mosby, 2021.
Phillips, Catherine M, and Ivan J Perry. “Lipoprotein particle subclass profiles among metabolically healthy and unhealthy obese and non-obese adults: does size matter?.” Atherosclerosis vol. 242,2 (2015): 399-406. Doi:10.1016/j.atherosclerosis.2015.07.040
Si, Jiahui et al. “Improved lipidomic profile mediates the effects of adherence to healthy lifestyles on coronary heart disease.” eLife vol. 10 e60999. 9 Feb. 2021, doi:10.7554/eLife.60999
van Tienhoven-Wind, Lynnda, and Robin P F Dullaart. “Low normal thyroid function as a determinant of increased large very low density lipoprotein particles.” Clinical biochemistry vol. 48,7-8 (2015): 489-94. doi:10.1016/j.clinbiochem.2015.01.015
Wojczynski, Mary K et al. “High-fat meal effect on LDL, HDL, and VLDL particle size and number in the Genetics of Lipid-Lowering Drugs and Diet Network (GOLDN): an interventional study.” Lipids in health and disease vol. 10 181. 18 Oct. 2011, doi:10.1186/1476-511X-10-181
Lipoprotein subfractionation is the process of separating lipoprotein particles into distinct subclasses based on size, density, and other physicochemical properties. This analysis provides a more comprehensive understanding of an individual's lipid profile and helps to identify potential cardiovascular risk factors even if their traditional lipid panel appears normal. Ion mobility: Ion mobility is an analytical technique that separates gas-phase ions based on their size, shape, and charge. In lipoprotein subfractionation, ion mobility separates lipoprotein particles by their size and density using an electric field. As the lipoprotein ions travel through a buffer gas, their mobility is influenced by their size, resulting in separation. Ion mobility has the advantage of directly measuring the particle size without relying on the indirect properties of NMR signals. The technique can reveal detailed information about lipoprotein size distribution, which has been associated with cardiovascular disease risk.
LDL Particle Number (ION)
LDL Particle Number (ION) measurement offers a more accurate assessment of cardiovascular risk and subclinical disease compared to LDL cholesterol measurement. Depleted LDL particles can still contribute to atherosclerosis, and a higher number of LDL particles may be associated with additional CVD risk factors like inflammation, insulin resistance, hypertriglyceridemia, and increased coronary artery calcium score. A low LDL particle number might not hold clinical significance.
OPTIMAL DX MEMBERS CLICK HERE for more information on LDL Particle Number (ION)
References
Cromwell, William C et al. “LDL Particle Number and Risk of Future Cardiovascular Disease in the Framingham Offspring Study - Implications for LDL Management.” Journal of clinical lipidology vol. 1,6 (2007): 583-92. doi:10.1016/j.jacl.2007.10.001
Feingold, Kenneth R. “Utility of Advanced Lipoprotein Testing in Clinical Practice.” Endotext, edited by Kenneth R Feingold et. al., MDText.com, Inc., 3 January 2023.
Garshick, M et al. “Reduction in dietary trans fat intake is associated with decreased LDL particle number in a primary prevention population.” Nutrition, metabolism, and cardiovascular diseases : NMCD vol. 24,1 (2014): 100-6. doi:10.1016/j.numecd.2013.06.003
Langlois, Michel R et al. “Quantifying Atherogenic Lipoproteins: Current and Future Challenges in the Era of Personalized Medicine and Very Low Concentrations of LDL Cholesterol. A Consensus Statement from EAS and EFLM.” Clinical chemistry vol. 64,7 (2018): 1006-1033. doi:10.1373/clinchem.2018.287037
Malave, Hector et al. “Evaluation of low-density lipoprotein particle number distribution in patients with type 2 diabetes mellitus with low-density lipoprotein cholesterol <50 mg/dl and non-high-density lipoprotein cholesterol <80 mg/dl.” The American journal of cardiology vol. 110,5 (2012): 662-5. doi:10.1016/j.amjcard.2012.04.046
Superko, Harold, and Brenda Garrett. “Small Dense LDL: Scientific Background, Clinical Relevance, and Recent Evidence Still a Risk Even with 'Normal' LDL-C Levels.” Biomedicines vol. 10,4 829. 1 Apr. 2022, doi:10.3390/biomedicines10040829
Talebi, Sepide et al. “The beneficial effects of nutraceuticals and natural products on small dense LDL levels, LDL particle number and LDL particle size: a clinical review.” Lipids in health and disease vol. 19,1 66. 11 Apr. 2020, doi:10.1186/s12944-020-01250-6
Varvel, Stephen A et al. “Discordance between apolipoprotein B and low-density lipoprotein particle number is associated with insulin resistance in clinical practice.” Journal of clinical lipidology vol. 9,2 (2015): 247-55. doi:10.1016/j.jacl.2014.11.005
Small LDLs (ION)
Small low-density lipoprotein (LDL) particles are identified as significant risk factors for cardiovascular diseases due to their susceptibility to oxidation and propensity to infiltrate arterial walls. These particles are associated with several health conditions, such as elevated triglycerides, metabolic syndrome, diabetes, and arthritis. The level of small LDL particles is a better predictor of cardiovascular risk than LDL-cholesterol alone. The reduction of small LDLs through a healthy diet, nutritional supplements, and lifestyle changes contributes to a decreased risk of cardiometabolic diseases and promotes better overall health. Thus, interventions targeting small LDL levels can potentially reduce the prevalence of cardiovascular diseases.
Standard Range: 0.00 – 141.99 nmol/L
The ODX Range: 0.00 – 141.99 nmol/L
OPTIMAL DX MEMBERS CLICK HERE for more information on Small LDLs (ION)
References
Ceponiene, Indre et al. “Association of Coronary Calcium, Carotid Wall Thickness, and Carotid Plaque Progression With Low-Density Lipoprotein and High-Density Lipoprotein Particle Concentration Measured by Ion Mobility (From Multiethnic Study of Atherosclerosis [MESA]).” The American journal of cardiology vol. 142 (2021): 52-58. doi:10.1016/j.amjcard.2020.11.026
Feingold, Kenneth R. “Utility of Advanced Lipoprotein Testing in Clinical Practice.” Endotext, edited by Kenneth R Feingold et. al., MDText.com, Inc., 3 January 2023.
Froyen, Erik. “The effects of fat consumption on low-density lipoprotein particle size in healthy individuals: a narrative review.” Lipids in health and disease vol. 20,1 86. 6 Aug. 2021, doi:10.1186/s12944-021-01501-0
Gerber, Philipp A et al. “Small, dense LDL: an update.” Current opinion in cardiology vol. 32,4 (2017): 454-459. doi:10.1097/HCO.0000000000000410
Ivanova, Ekaterina A et al. “Small Dense Low-Density Lipoprotein as Biomarker for Atherosclerotic Diseases.” Oxidative medicine and cellular longevity vol. 2017 (2017): 1273042. doi:10.1155/2017/1273042
Lee, Yujin et al. “Effects of Dark Chocolate and Almonds on Cardiovascular Risk Factors in Overweight and Obese Individuals: A Randomized Controlled-Feeding Trial.” Journal of the American Heart Association vol. 6,12 e005162. 29 Nov. 2017, doi:10.1161/JAHA.116.005162
Parra, Eliane Soler et al. “HDL size is more accurate than HDL cholesterol to predict carotid subclinical atherosclerosis in individuals classified as low cardiovascular risk.” PloS one vol. 9,12 e114212. 3 Dec. 2014, doi:10.1371/journal.pone.0114212
Sæther, Julie Caroline et al. “Small LDL subfractions are associated with coronary atherosclerosis despite no differences in conventional lipids.” Physiological genomics vol. 55,1 (2023): 16-26. doi:10.1152/physiolgenomics.00098.2022
Superko HR. Advanced lipoprotein testing and subfractionation are clinically useful. Circulation. 2009;119:2383-2395.
Superko, Harold, and Brenda Garrett. “Small Dense LDL: Scientific Background, Clinical Relevance, and Recent Evidence Still a Risk Even with 'Normal' LDL-C Levels.” Biomedicines vol. 10,4 829. 1 Apr. 2022, doi:10.3390/biomedicines10040829
Talebi, Sepide et al. “The beneficial effects of nutraceuticals and natural products on small dense LDL levels, LDL particle number and LDL particle size: a clinical review.” Lipids in health and disease vol. 19,1 66. 11 Apr. 2020, doi:10.1186/s12944-020-01250-6
Vekic, Jelena et al. “Atherosclerosis Development and Progression: The Role of Atherogenic Small, Dense LDL.” Medicina (Kaunas, Lithuania) vol. 58,2 299. 16 Feb. 2022, doi:10.3390/medicina58020299
Medium LDLs (ION)
Medium-sized low-density lipoprotein (LDL) particles, while not as extensively studied as small LDL particles, may also contribute to an elevated risk of cardiovascular disease (CVD). These medium LDLs are linked to an atherogenic pattern called phenotype B, characterized by smaller LDLs, larger HDLs, increased triglycerides, and heightened risk for CVD, metabolic syndrome, insulin resistance, and type 2 diabetes. Genetic factors can influence LDL and HDL sizes, and there's evidence that medium LDLs may be associated with increased coronary artery calcium in individuals at high risk of cardiometabolic dysfunction. Therefore, maintaining lower levels of medium LDLs can suggest a lower risk of cardiovascular disease.
Standard Range: 0.00 – 214.99 nmol/L
The ODX Range: 0.00 – 214.99 nmol/L
OPTIMAL DX MEMBERS CLICK HERE for more information on Medium LDLs (ION)
References
Aneni, Ehimen C et al. “Lipoprotein Sub-Fractions by Ion-Mobility Analysis and Its Association with Subclinical Coronary Atherosclerosis in High-Risk Individuals.” Journal of atherosclerosis and thrombosis vol. 26,1 (2019): 50-63. doi:10.5551/jat.40741
Ceponiene, Indre et al. “Association of Coronary Calcium, Carotid Wall Thickness, and Carotid Plaque Progression With Low-Density Lipoprotein and High-Density Lipoprotein Particle Concentration Measured by Ion Mobility (From Multiethnic Study of Atherosclerosis [MESA]).” The American journal of cardiology vol. 142 (2021): 52-58. doi:10.1016/j.amjcard.2020.11.026
Musunuru, Kiran et al. “Ion mobility analysis of lipoprotein subfractions identifies three independent axes of cardiovascular risk.” Arteriosclerosis, thrombosis, and vascular biology vol. 29,11 (2009): 1975-80. doi:10.1161/ATVBAHA.109.190405
Large HDLs (ION)
High-density lipoproteins (HDLs) play a crucial role in cholesterol metabolism and cardiovascular health, with larger HDL particles being particularly associated with reduced cardiovascular disease (CVD) risk. Factors such as inflammation, obesity, and menopause can influence the concentrations of large HDLs. These large HDL particles are considered cardioprotective, and their levels can be increased through nutritional interventions. Low levels of large HDLs may indicate an increased risk of cardiometabolic disorders, whereas high levels are linked to a lower risk of CVD, better HDL efflux, and potentially a protective effect in conditions such as type 1 diabetes.
Standard Range: 6729.01 – 10000.00 nmol/L
The ODX Range: 6729.01 – 10000.00 nmol/L
OPTIMAL DX MEMBERS CLICK HERE for more information on Large LDLs (ION)
References
Ahmed, Mohamad O et al. “HDL particle size is increased and HDL-cholesterol efflux is enhanced in type 1 diabetes: a cross-sectional study.” Diabetologia vol. 64,3 (2021): 656-667. doi:10.1007/s00125-020-05320-3
DiMarco, Diana M et al. “Intake of up to 3 Eggs per Day Is Associated with Changes in HDL Function and Increased Plasma Antioxidants in Healthy, Young Adults.” The Journal of nutrition vol. 147,3 (2017): 323-329. doi:10.3945/jn.116.241877
El Harchaoui, Karim et al. “High-density lipoprotein particle size and concentration and coronary risk.” Annals of internal medicine vol. 150,2 (2009): 84-93. doi:10.7326/0003-4819-150-2-200901200-00006
El Khoudary, Samar R et al. “HDL (High-Density Lipoprotein) Subclasses, Lipid Content, and Function Trajectories Across the Menopause Transition: SWAN-HDL Study.” Arteriosclerosis, thrombosis, and vascular biology vol. 41,2 (2021): 951-961. doi:10.1161/ATVBAHA.120.315355
Mietus-Snyder, Michele L et al. “A nutrient-dense, high-fiber, fruit-based supplement bar increases HDL cholesterol, particularly large HDL, lowers homocysteine, and raises glutathione in a 2-wk trial.” FASEB journal : official publication of the Federation of American Societies for Experimental Biology vol. 26,8 (2012): 3515-27. doi:10.1096/fj.11-201558
Musunuru K, Orho-Melander M, Caulfield MP, et al. Ion mobility analysis of lipoprotein subfractions identifies three independent axes of cardiovascular risk. Arterioscler Thromb Vac Biol. 2009;29:1975-1980.
Mutharasan, R Kannan et al. “HDL efflux capacity, HDL particle size, and high-risk carotid atherosclerosis in a cohort of asymptomatic older adults: the Chicago Healthy Aging Study.” Journal of lipid research vol. 58,3 (2017): 600-606. doi:10.1194/jlr.P069039
Parra, Eliane Soler et al. “HDL size is more accurate than HDL cholesterol to predict carotid subclinical atherosclerosis in individuals classified as low cardiovascular risk.” PloS one vol. 9,12 e114212. 3 Dec. 2014, doi:10.1371/journal.pone.0114212
Sokooti, Sara et al. “HDL Particle Subspecies and Their Association With Incident Type 2 Diabetes: The PREVEND Study.” The Journal of clinical endocrinology and metabolism vol. 106,6 (2021): 1761-1772. doi:10.1210/clinem/dgab075
Vekic, Jelena et al. “High serum uric acid and low-grade inflammation are associated with smaller LDL and HDL particles.” Atherosclerosis vol. 203,1 (2009): 236-42. doi:10.1016/j.atherosclerosis.2008.05.047
Wilkins, John T, and Henrique S Seckler. “HDL modification: recent developments and their relevance to atherosclerotic cardiovascular disease.” Current opinion in lipidology vol. 30,1 (2019): 24-29. doi:10.1097/MOL.0000000000000571
LDL Peak Size (ION)
Cholesterol is transported in the bloodstream primarily by various sizes of low-density lipoprotein (LDL) particles. Smaller and denser particles pose a higher risk for cardiovascular disease and insulin resistance. These smaller particles are more susceptible to oxidation and glycation, leading to potential atherosclerosis. Lifestyle interventions such as weight loss, regular exercise, a healthy plant-based diet, and consumption of certain natural foods and products can help reduce the number of LDL particles and increase their size, thereby reducing cardiovascular risk. Lower LDL size is associated with increased heart disease risk, while larger LDL size is linked to cardioprotective effects.
Standard Range: 222.91 – 500 Angstrom
The ODX Range: 257.00 – 500 Angstrom
OPTIMAL DX MEMBERS CLICK HERE for more information on LDL Peak Size (ION)
References
Afanasieva, O I et al. Kardiologiia vol. 56,6 (2016): 5-11. doi:10.18565/cardio.2016.6.5-11
Aneni, Ehimen C et al. “Lipoprotein Sub-Fractions by Ion-Mobility Analysis and Its Association with Subclinical Coronary Atherosclerosis in High-Risk Individuals.” Journal of atherosclerosis and thrombosis vol. 26,1 (2019): 50-63. doi:10.5551/jat.40741
Bowden, Rodney G et al. “LDL particle size and number compared with LDL cholesterol and risk categorization in end-stage renal disease patients.” Journal of nephrology vol. 24,6 (2011): 771-7. doi:10.5301/JN.2011.6376
Chiu, Sally et al. “Effects of a very high saturated fat diet on LDL particles in adults with atherogenic dyslipidemia: A randomized controlled trial.” PloS one vol. 12,2 e0170664. 6 Feb. 2017, doi:10.1371/journal.pone.0170664
Davy, Brenda M et al. “High-fiber oat cereal compared with wheat cereal consumption favorably alters LDL-cholesterol subclass and particle numbers in middle-aged and older men.” The American journal of clinical nutrition vol. 76,2 (2002): 351-8. doi:10.1093/ajcn/76.2.351
Dodin, Sylvie et al. “Flaxseed on cardiovascular disease markers in healthy menopausal women: a randomized, double-blind, placebo-controlled trial.” Nutrition (Burbank, Los Angeles County, Calif.) vol. 24,1 (2008): 23-30. doi:10.1016/j.nut.2007.09.003
Ivanova, Ekaterina A et al. “Small Dense Low-Density Lipoprotein as Biomarker for Atherosclerotic Diseases.” Oxidative medicine and cellular longevity vol. 2017 (2017): 1273042. doi:10.1155/2017/1273042
Lamarche B, Tchernof A, Moorjani S, et al. Small, dense low-density lipoprotein particles as a predictor of the risk of ischemic heart disease in men. Prospective results from the Quebec Cardiovascular Study. Circulation. 1997 Jan 7;95(1):69-75.
Liou, Lathan, and Stephen Kaptoge. “Association of small, dense LDL-cholesterol concentration and lipoprotein particle characteristics with coronary heart disease: A systematic review and meta-analysis.” PloS one vol. 15,11 e0241993. 9 Nov. 2020, doi:10.1371/journal.pone.0241993
Nikolic, Dragana et al. “Lipoprotein subfractions in metabolic syndrome and obesity: clinical significance and therapeutic approaches.” Nutrients vol. 5,3 928-48. 18 Mar. 2013, doi:10.3390/nu5030928
Witte, D R et al. “Study of agreement between LDL size as measured by nuclear magnetic resonance and gradient gel electrophoresis.” Journal of lipid research vol. 45,6 (2004): 1069-76. doi:10.1194/jlr.M300395-JLR200
Superko, Harold, and Brenda Garrett. “Small Dense LDL: Scientific Background, Clinical Relevance, and Recent Evidence Still a Risk Even with 'Normal' LDL-C Levels.” Biomedicines vol. 10,4 829. 1 Apr. 2022, doi:10.3390/biomedicines10040829
Talebi, Sepide et al. “The beneficial effects of nutraceuticals and natural products on small dense LDL levels, LDL particle number and LDL particle size: a clinical review.” Lipids in health and disease vol. 19,1 66. 11 Apr. 2020, doi:10.1186/s12944-020-01250-6
LDL Pattern Risk: Optimal Pattern A; High Risk Pattern B (ION)
Cholesterol is transported in the bloodstream primarily by various sizes of low-density lipoprotein (LDL) particles. Smaller and denser particles pose a higher risk for cardiovascular disease and insulin resistance. These smaller particles are more susceptible to oxidation and glycation, leading to potential atherosclerosis. Lifestyle interventions such as weight loss, regular exercise, a healthy plant-based diet, and consumption of certain natural foods and products can help reduce the number of LDL particles and increase their size, thereby reducing cardiovascular risk. Lower LDL size is associated with increased heart disease risk, while larger LDL size is linked to cardioprotective effects.
Pattern A is associated with larger, more buoyant LDL particles and a reduced risk of developing cardiovascular disease, especially with elevated apoB.
Pattern B is associated with small, dense LDL, increased risk of atherogenic cardiovascular disease, insulin resistance, and genetic factors. However, some research indicates that pattern B presenting after myocardial infarction may be associated with decreased all-cause mortality.
OPTIMAL DX MEMBERS CLICK HERE for more information on LDL Pattern Risk
References
Ivanova, Ekaterina A et al. “Small Dense Low-Density Lipoprotein as Biomarker for Atherosclerotic Diseases.” Oxidative medicine and cellular longevity vol. 2017 (2017): 1273042. doi:10.1155/2017/1273042
Nikolic, Dragana et al. “Lipoprotein subfractions in metabolic syndrome and obesity: clinical significance and therapeutic approaches.” Nutrients vol. 5,3 928-48. 18 Mar. 2013, doi:10.3390/nu5030928
Pokharel, Yashashwi et al. “Association of low-density lipoprotein pattern with mortality after myocardial infarction: Insights from the TRIUMPH study.” Journal of clinical lipidology vol. 11,6 (2017): 1458-1470.e4. doi:10.1016/j.jacl.2017.09.002
Superko HR. Advanced lipoprotein testing and subfractionation are clinically useful. Circulation. 2009;119:2383-2395.
Talebi, Sepide et al. “The beneficial effects of nutraceuticals and natural products on small dense LDL levels, LDL particle number and LDL particle size: a clinical review.” Lipids in health and disease vol. 19,1 66. 11 Apr. 2020, doi:10.1186/s12944-020-01250-6
Want to see the impact Optimal DX Software’s analytical, interpretive, and tracking functionality can have on your practice? Sign up for an ODX Account and find out for yourself.
Liver and gallbladder biomarkers play essential roles in assessing the function and health of these organs, which are critical for various metabolic processes, detoxification, and digestion in the human body. Monitoring these biomarkers can help diagnose liver and gallbladder diseases, evaluate the severity of the conditions, and monitor response to therapy. Many liver and gallbladder biomarkers also reflect cardiometabolic health, nutrition status, and oxidative stress exposure.
Alkaline Phosphatase (Alk Phos, ALP)
Alkaline phosphatase (ALP) is a metabolic enzyme found mainly in the liver and bone but has important functions in the intestine and kidney as well. The enzyme operates best in an alkaline environment and has different variants, or isoenzymes, which can be traced back to the tissue they originate from. Low levels of ALP can signify malnutrition, hypothyroidism, celiac disease, and deficiencies in key nutrients like vitamin C, B12, zinc, magnesium, and phosphorus. Conversely, high levels of ALP are seen in situations of bone growth and healing, liver and bone disease, gallbladder disorders, intestinal ischemia, rheumatoid arthritis, fatty liver disease, sarcopenia, and metabolic syndrome. Thus, ALP levels can be a useful indicator of various health conditions.
OPTIMAL DX MEMBERS CLICK HERE for more information on Alkaline Phosphatase
References
Bhattarai, Tirtha et al. “Correlation of common biochemical markers for bone turnover, serum calcium, and alkaline phosphatase in post-menopausal women.” The Malaysian journal of medical sciences : MJMS vol. 21,1 (2014): 58-61.
Estaki, Mehrbod et al. “Interplay between intestinal alkaline phosphatase, diet, gut microbes and immunity.” World journal of gastroenterology vol. 20,42 (2014): 15650-6. doi:10.3748/wjg.v20.i42.15650
Kalahasthi, Ravibabu, et al. "Assessment of diagnostic accuracy and optimal cut points of blood lead levels on serum proteins among workers exposed to Pb at a lead battery plant." Int J Med Biochem 2.3 (2019): 81-7.
Kasarala, George, and Hans L Tillmann. “Standard liver tests.” Clinical liver disease vol. 8,1 13-18. 26 Jul. 2016, doi:10.1002/cld.562
Langlois, M et al. “Serum vitamin C concentration is low in peripheral arterial disease and is associated with inflammation and severity of atherosclerosis.” Circulation vol. 103,14 (2001): 1863-8. doi:10.1161/01.cir.103.14.1863
Lee, Han-Bin et al. “Association between Serum Alkaline Phosphatase Level and Cerebral Small Vessel Disease.” PloS one vol. 10,11 e0143355. 18 Nov. 2015, doi:10.1371/journal.pone.0143355
Lee, Jun-Hyuk et al. “Relationship between Serum Alkaline Phosphatase and Low Muscle Mass Index Among Korean Adults: A Nationwide Population-Based Study.” Biomolecules vol. 11,6 842. 5 Jun. 2021, doi:10.3390/biom11060842
Lowe, Dhruv, et al. “Alkaline Phosphatase.” StatPearls, StatPearls Publishing, 11 August 2021.
Lum, G. “Significance of low serum alkaline phosphatase activity in a predominantly adult male population.” Clinical chemistry vol. 41,4 (1995): 515-8.
Mahmoodian, F et al. “Regulation and properties of bone alkaline phosphatase during vitamin C deficiency in guinea pigs.” Archives of biochemistry and biophysics vol. 336,1 (1996): 86-96. doi:10.1006/abbi.1996.0535
Pagana, Kathleen Deska, et al. Mosby's Diagnostic and Laboratory Test Reference. 15th ed., Mosby, 2021.
Ray, Chinmaya Sundar, et al. "Low alkaline phosphatase (ALP) in adult population an indicator of zinc (Zn) and magnesium (Mg) deficiency." Current Research in Nutrition and Food Science Journal 5.3 (2017): 347-352.
Ren, Yongkui et al. “Serum alkaline phosphatase levels are associated with coronary artery calcification patterns and plaque vulnerability.” Catheterization and cardiovascular interventions : official journal of the Society for Cardiac Angiography & Interventions vol. 97 Suppl 2 (2021): 1055-1062. doi:10.1002/ccd.29642
Ryu, W-S et al. “Increased serum alkaline phosphatase as a predictor of long-term mortality after stroke.” Neurology vol. 75,22 (2010): 1995-2002. doi:10.1212/WNL.0b013e3181ff966a
Ryu, Wi-Sun et al. “High serum alkaline phosphatase in relation to cerebral small vessel disease.” Atherosclerosis vol. 232,2 (2014): 313-8. doi:10.1016/j.atherosclerosis.2013.11.047
Sahin, Irfan et al. “Correlation between the serum alkaline phosphatase level and the severity of coronary artery disease.” Coronary artery disease vol. 25,4 (2014): 349-52. doi:10.1097/MCA.0000000000000080
Lee, Jun-Hyuk et al. “Relationship between Serum Alkaline Phosphatase and Low Muscle Mass Index Among Korean Adults: A Nationwide Population-Based Study.” Biomolecules vol. 11,6 842. 5 Jun. 2021, doi:10.3390/biom11060842
Sharma, Ujjawal et al. “Alkaline phosphatase: an overview.” Indian journal of clinical biochemistry : IJCB vol. 29,3 (2014): 269-78. doi:10.1007/s12291-013-0408-y
Sohrabi, Masoudreza et al. “Serum Alkaline Phosphate Level Associates with Metabolic Syndrome Components Regardless of Non-Alcoholic Fatty Liver; A Population-Based Study in Northern Iran.” Middle East journal of digestive diseases vol. 15,3 (2023): 175-179. doi:10.34172/mejdd.2023.340
Thapa, P B et al. “Serum gamma glutamyl transferase and alkaline phosphatase in acute cholecystitis.” Journal of Nepal Health Research Council vol. 8,2 (2010): 78-81.
Aspartate Aminotransferase (AST)
Aspartate aminotransferase (AST) is a metabolic enzyme primarily found in muscle, liver, and various other tissues. It is involved in gluconeogenesis, i.e., the conversion of amino acids into glucose. The AST enzyme also plays a role in maintaining cellular energy balance, and changes in its levels might reflect adverse health conditions, including coronary artery disease (CAD).
Low AST levels are associated with chronic liver disease, kidney disease, and vitamin B6 deficiency, while elevated levels can indicate tissue damage, muscle breakdown, and liver disease.
Furthermore, both low and high AST levels have been associated with increased cardiac mortality. An increase in AST can be seen in acute liver obstructions or inflammations and can stay elevated with ongoing liver dysfunction.
Standard Range: 10.00 - 35.00 IU/L
The ODX Range: 10.00 - 26.00 IU/L
References
Jiang, Zhenghui Gordon et al. “Low LDL-C and high HDL-C levels are associated with elevated serum transaminases amongst adults in the United States: a cross-sectional study.” PloS one vol. 9,1 e85366. 15 Jan. 2014, doi:10.1371/journal.pone.0085366
Lala, Vasimahmed, et al. “Liver Function Tests.” StatPearls, StatPearls Publishing, 20 August 2021
Ndrepepa, Gjin et al. “Aspartate aminotransferase and mortality in patients with ischemic heart disease.” Nutrition, metabolism, and cardiovascular diseases : NMCD vol. 30,12 (2020): 2335-2342. doi:10.1016/j.numecd.2020.07.033
Ndrepepa, Gjin. "Aspartate aminotransferase and cardiovascular disease—a narrative review." J. Lab. Precis. Med 6.6 (2021).
Pagana, Kathleen Deska, et al. Mosby's Diagnostic and Laboratory Test Reference. 15th ed., Mosby, 2021.
Shen, Jianying et al. “Correlation of serum alanine aminotransferase and aspartate aminotransferase with coronary heart disease.” International journal of clinical and experimental medicine vol. 8,3 4399-404. 15 Mar. 2015
Zhang, Peng et al. “Determination of the upper cut-off values of serum alanine aminotransferase and aspartate aminotransferase in Chinese.” World journal of gastroenterology vol. 21,8 (2015): 2419-24. doi:10.3748/wjg.v21.i8.2419
Alanine Aminotransferase (ALT)
Alanine transaminase (ALT) is an enzyme predominantly found in the liver but also in the heart, skeletal muscle, and kidneys, and it is instrumental in gluconeogenesis, converting amino acids into glucose for energy. Low ALT levels might indicate frailty, aging, and increased mortality risk due to cancer and cardiovascular diseases, while high levels are associated with liver pathology, cardiovascular risk, and metabolic disorders like insulin resistance, obesity, and type 2 diabetes. Elevations in ALT can be triggered by alcohol ingestion, certain medications, exercise, and various diseases, such as hepatitis, cirrhosis, and diabetes. Interestingly, moderate alcohol and coffee intake may protect against ALT elevation. The alteration in ALT levels may not only indicate liver dysfunction but also metabolic and cardiovascular disorders, suggesting a potential need to adjust the conventional upper cut-off values for ALT.
Standard Range: 6.00 - 29.00 IU/L
The ODX Range: 10.00 - 26.00 IU/L
References
Bjornsson, Helgi Kristinn et al. “A prospective study on the causes of notably raised alanine aminotransferase (ALT).” Scandinavian journal of gastroenterology vol. 51,5 (2016): 594-600. doi: 10.3109/00365521.2015.1121516
Heard, Kennon J et al. “Serum alanine aminotransferase elevation during 10 days of acetaminophen use in nondrinkers.” Pharmacotherapy vol. 30,8 (2010): 818-22. doi:10.1592/phco.30.8.818
Kasarala, George, and Hans L Tillmann. “Standard liver tests.” Clinical liver disease vol. 8,1 13-18. 26 Jul. 2016, doi:10.1002/cld.562
Ke, Pan et al. “Association of the serum transaminase with mortality among the US elderly population.” Journal of gastroenterology and hepatology, 10.1111/jgh.15815. 1 Mar. 2022, doi:10.1111/jgh.15815
Lala, Vasimahmed, et al. “Liver Function Tests.” StatPearls, StatPearls Publishing, 20 August 2021
Liu Z, Que S, Xu J, Peng T. Alanine aminotransferase-old biomarker and new concept: a review. Int J Med Sci. 2014 Jun 26;11(9):925-35.
Moriles, Kevin E. and Samy A. Azer. “Alanine Amino Transferase.” StatPearls, StatPearls Publishing, 9 May 2021.
Pagana, Kathleen Deska, et al. Mosby's Diagnostic and Laboratory Test Reference. 15th ed., Mosby, 2021.
Ruhl, Constance E, and James E Everhart. “Upper limits of normal for alanine aminotransferase activity in the United States population.” Hepatology (Baltimore, Md.) vol. 55,2 (2012): 447-54. doi:10.1002/hep.24725
Shen, Jianying et al. “Correlation of serum alanine aminotransferase and aspartate aminotransferase with coronary heart disease.” International journal of clinical and experimental medicine vol. 8,3 4399-404. 15 Mar. 2015
Zhang, Peng et al. “Determination of the upper cut-off values of serum alanine aminotransferase and aspartate aminotransferase in Chinese.” World journal of gastroenterology vol. 21,8 (2015): 2419-24. doi:10.3748/wjg.v21.i8.2419
AST:ALT Ratio
The ratio of AST to ALT, also known as the De Ritis ratio, provides insights into liver fibrosis, muscle and tissue damage, and cardiovascular risk, even when individual biomarkers are within normal range. This ratio can significantly increase with worsening liver fibrosis or severe muscle damage. High AST:ALT ratios may be associated with worsening liver disease, cardiovascular risk, stroke severity, and prostate cancer. Conversely, a low AST:ALT ratio could indicate insulin resistance and a heightened risk for metabolic syndrome. Therefore, the De Ritis ratio is a valuable tool in assessing health status across various medical conditions.
Standard Range: 0.00 - 1.00 Ratio
The ODX Range: 0.00 - 1.00 Ratio
OPTIMAL DX MEMBERS CLICK HERE for more information on AST:ALT Ratio
References
Chen, Wangyang et al. “Elevated AST/ALT ratio is associated with all-cause mortality and cancer incident.” Journal of clinical laboratory analysis vol. 36,5 (2022): e24356. doi:10.1002/jcla.24356
Djakpo, Dodji Kossi et al. “The significance of transaminase ratio (AST/ALT) in acute myocardial infarction.” Archives of medical sciences. Atherosclerotic diseases vol. 5 e279-e283. 26 Dec. 2020, doi:10.5114/amsad.2020.103028
Gao, Fan et al. “De Ritis ratio (AST/ALT) as an independent predictor of poor outcome in patients with acute ischemic stroke.” Neuropsychiatric disease and treatment vol. 13 1551-1557. 15 Jun. 2017, doi:10.2147/NDT.S139316
Hall P, Cash J. What is the real function of the liver 'function' tests? Ulster Med J. 2012 Jan;81(1):30-6.
Kasarala, George, and Hans L Tillmann. “Standard liver tests.” Clinical liver disease vol. 8,1 13-18. 26 Jul. 2016, doi:10.1002/cld.562
Liu, Hui et al. “The association between AST/ALT ratio and all-cause and cardiovascular mortality in patients with hypertension.” Medicine vol. 100,31 (2021): e26693. doi:10.1097/MD.0000000000026693
Rief P, Pichler M, Raggam R, et al. The AST/ALT (De-Ritis) ratio: A novel marker for critical limb ischemia in peripheral arterial occlusive disease patients. Medicine (Baltimore). 2016 Jun;95(24):e3843.
Steininger, Matthias et al. “De-Ritis Ratio Improves Long-Term Risk Prediction after Acute Myocardial Infarction.” Journal of clinical medicine vol. 7,12 474. 23 Nov. 2018, doi:10.3390/jcm7120474
Visaria, Aayush et al. “Association between aspartate aminotransferase-to-alanine aminotransferase ratio and insulin resistance among US adults.” European journal of gastroenterology & hepatology vol. 34,3 (2022): 316-323. doi:10.1097/MEG.0000000000002215
Wang, Yanan et al. “AST to ALT ratio and risk of hemorrhagic transformation in patients with acute ischemic stroke.” Neurological research vol. 42,11 (2020): 980-986. doi:10.1080/01616412.2020.1796403
Woreta TA, Alqahtani SA. Evaluation of abnormal liver tests. Med Clin North Am. 2014 Jan;98(1):1-16.
Zhou, Jiatong et al. “AST/ALT ratio as a significant predictor of the incidence risk of prostate cancer.” Cancer medicine vol. 9,15 (2020): 5672-5677. doi:10.1002/cam4.3086
Gamma-Glutamyl Transferase (GGT)
Gamma-glutamyl transferase (GGT) is an enzyme that plays a critical role in the production and recycling of glutathione, a crucial antioxidant. High GGT levels may reflect oxidative stress, toxin exposure, antioxidant deficiency, and liver and cardiovascular diseases, among other health issues. Environmental toxins can increase GGT levels, prompting further investigation. On the contrary, low GGT levels could indicate nutrient deficiencies (e.g., magnesium, B6) or the impact of certain medications. Importantly, GGT levels within the conventional lab range, but on the higher side, are associated with metabolic dysfunction, cardiovascular complications, and dementia.
Standard Range: 3.00 - 85.00 IU/L
The ODX Range: 10.00 - 17.00 IU/L
References
Bradley, Ryan et al. “Associations between total serum GGT activity and metabolic risk: MESA.” Biomarkers in medicine vol. 7,5 (2013): 709-21. doi:10.2217/bmm.13.71
Chun, Hyejin et al. “Association of serum γ-glutamyltransferase level and incident prehypertension in Korean men.” Journal of Korean medical science vol. 28,11 (2013): 1603-8. doi:10.3346/jkms.2013.28.11.1603
Fiorentini, Diana et al. “Magnesium: Biochemistry, Nutrition, Detection, and Social Impact of Diseases Linked to Its Deficiency.” Nutrients vol. 13,4 1136. 30 Mar. 2021, doi:10.3390/nu13041136
Koenig, Gerald, and` Stephanie Seneff. “Gamma-Glutamyltransferase: A Predictive Biomarker of Cellular Antioxidant Inadequacy and Disease Risk.” Disease markers vol. 2015 (2015): 818570. doi:10.1155/2015/818570
Kunutsor, Setor K. “Gamma-glutamyltransferase-friend or foe within?.” Liver international : official journal of the International Association for the Study of the Liver vol. 36,12 (2016): 1723-1734. doi:10.1111/liv.13221
Lee, You-Bin et al. “Gamma-glutamyl transferase variability and risk of dementia: A nationwide study.” International journal of geriatric psychiatry vol. 35,10 (2020): 1105-1114. doi:10.1002/gps.5332
Ndrepepa, Gjin, and Adnan Kastrati. “Gamma-glutamyl transferase and cardiovascular disease.” Annals of translational medicine vol. 4,24 (2016): 481. doi:10.21037/atm.2016.12.27
Neuman, Manuela G et al. “Gamma glutamyl transferase - an underestimated marker for cardiovascular disease and the metabolic syndrome.” Journal of pharmacy & pharmaceutical sciences : a publication of the Canadian Society for Pharmaceutical Sciences, Societe canadienne des sciences pharmaceutiques vol. 23,1 (2020): 65-74. doi:10.18433/jpps30923
Noland, Diana, Jeanne A. Drisko, and Leigh Wagner, eds. Integrative and functional medical nutrition therapy: principles and practices. Springer Nature, 2020.
Pagana, Kathleen Deska, et al. Mosby's Diagnostic and Laboratory Test Reference. 15th ed., Mosby, 2021.
Pizzorno, Joseph. “Glutathione!.” Integrative medicine (Encinitas, Calif.) vol. 13,1 (2014): 8-12.
Ryoo, J H et al. “Clinical association between serum γ-glutamyltransferase levels and the development of insulin resistance in Korean men: a 5-year follow-up study.” Diabetic medicine : a journal of the British Diabetic Association vol. 31,4 (2014): 455-61. doi:10.1111/dme.12315
Thapa, P B et al. “Serum gamma glutamyl transferase and alkaline phosphatase in acute cholecystitis.” Journal of Nepal Health Research Council vol. 8,2 (2010): 78-81.
Thomas, L. (Ed.). (1998). Clinical laboratory diagnostics: use and assessment of clinical laboratory results. TH-books Verlagsgesellschaft.
Van Hemelrijck, Mieke et al. “Gamma-glutamyltransferase and risk of cancer in a cohort of 545,460 persons - the Swedish AMORIS study.” European journal of cancer (Oxford, England : 1990) vol. 47,13 (2011): 2033-41. doi:10.1016/j.ejca.2011.03.010
Wannamethee, S G et al. “The value of gamma-glutamyltransferase in cardiovascular risk prediction in men without diagnosed cardiovascular disease or diabetes.” Atherosclerosis vol. 201,1 (2008): 168-75. doi:10.1016/j.atherosclerosis.2008.01.019
Xu, Yu et al. “Cross-sectional and longitudinal association of serum alanine aminotransaminase and γ-glutamyltransferase with metabolic syndrome in middle-aged and elderly Chinese people.” Journal of diabetes vol. 3,1 (2011): 38-47. doi:10.1111/j.1753-0407.2010.00111.x
Yousefzadeh, Gholamreza et al. “Role of gamma-glutamyl transferase (GGT) in diagnosis of impaired glucose tolerance and metabolic syndrome: a prospective cohort research from the Kerman Coronary Artery Disease Risk Study (KERCADRS).” Diabetes & metabolic syndrome vol. 6,4 (2012): 190-4. doi:10.1016/j.dsx.2012.08.013
Lactate Dehydrogenase (LDH)
Lactate dehydrogenase (LDH) is an enzyme that plays a key role in energy production, particularly under conditions of limited oxygen. Elevated LDH levels may indicate liver disease, metabolic disorders, muscle or organ injury, inflammation, infection, or toxin exposure. Unusually low LDH levels are less common and might point to genetic disorders, overconsumption of ascorbic acid, or hypoglycemia. Levels of LDH within the bloodstream can increase due to various factors, such as increased anaerobic metabolism or damage to tissues like the liver, muscle, kidney, pancreas, or other organs. Given its involvement in various health conditions, it is used as a biomarker in the diagnosis of certain diseases and in assessing the severity of conditions like COVID-19 or sepsis.
Standard Range: 100.00 - 200.00 IU/L
The ODX Range: 140.00 - 200.00 IU/L
References
Chaudhari, Shubhangi, and Suparna Bindu. "Correlation of lactate dehydrogenase in megaloblastic anemia." Int J Curr Med and Appl Sci 9.1 (2015): 28-32.
Coskun, R et al. “A retrospective review of intensive care management of organophosphate insecticide poisoning: Single center experience.” Nigerian journal of clinical practice vol. 18,5 (2015): 644-50. doi:10.4103/1119-3077.158962
Dmour, Hussein H et al. “Assessment of Lactate Dehydrogenase Levels Among Diabetic Patients Treated in the Outpatient Clinics at King Hussein Medical Center, Royal Medical Services, Jordan.” Medical archives (Sarajevo, Bosnia and Herzegovina) vol. 74,5 (2020): 384-386. doi:10.5455/medarh.2020.74.384-386
Farhana, A., & Lappin, S. L. (2023). Biochemistry, Lactate Dehydrogenase. In StatPearls. StatPearls Publishing.
Gaikwad, Amrapali L., and D. S. Jadhav. "Utility of serum lactate dehydrogenase in the diagnosis of megaloblastic anemia." Int J Res Med Sci 6 (2018): 3051-3056.
Gao, Yongchao et al. “Risk of Metformin in Patients With Type 2 Diabetes With COVID-19: A Preliminary Retrospective Report.” Clinical and translational science vol. 13,6 (2020): 1055-1059. doi:10.1111/cts.12897
Henderson, Gregory C. “The diabetic brain during hypoglycemia: in the midst of plenty of lactate.” Diabetes vol. 62,9 (2013): 3024-6. doi:10.2337/db13-0914
Henry, Brandon Michael et al. “Lactate dehydrogenase levels predict coronavirus disease 2019 (COVID-19) severity and mortality: A pooled analysis.” The American journal of emergency medicine vol. 38,9 (2020): 1722-1726. doi:10.1016/j.ajem.2020.05.073
Hernández, Antonio F et al. “Influence of exposure to pesticides on serum components and enzyme activities of cytotoxicity among intensive agriculture farmers.” Environmental research vol. 102,1 (2006): 70-6. doi:10.1016/j.envres.2006.03.00
Hsieh, Yu-Shan et al. “Is the level of serum lactate dehydrogenase a potential biomarker for glucose monitoring with type 2 diabetes mellitus?.” Frontiers
Li, Chang et al. “Elevated Lactate Dehydrogenase (LDH) level as an independent risk factor for the severity and mortality of COVID-19.” Aging vol. 12,15 (2020): 15670-15681. doi:10.18632/aging.103770
Lu, Jun et al. “Lactate dehydrogenase is associated with 28-day mortality in patients with sepsis: a retrospective observational study.” The Journal of surgical research vol. 228 (2018): 314-321. doi:10.1016/j.jss.2018.03.035
MG, Makloph, et al. "Do Lab Parameter Could be used as Indicators of Severity in Case of Acute Cholinestrase Inhibitor Insecticides?." Indian Journal of Forensic Medicine & Toxicology 15.2 (2021).
Pagana, Kathleen Deska, et al. Mosby's Diagnostic and Laboratory Test Reference. 15th ed., Mosby, 2021.
Rehman, T., et al. "Combined Effect of Age and Exposure on the Levels of Different Serum Enzymes in Workers of Pesticides Formulation Factories, Pakistan." Biochem Physiol 7.238 (2018): 2.
Wu, Li-Wei et al. “Examining the association between serum lactic dehydrogenase and all-cause mortality in patients with metabolic syndrome: a retrospective observational study.” BMJ open vol. 6,5 e011186. 23 May. 2016, doi:10.1136/bmjopen-2016-011186
Bilirubin, Total
Bilirubin, produced during the breakdown of red blood cells, is typically excreted in bile. However, when present in excess in the bloodstream, it often signifies liver or gallbladder disorders, inflammation, an accelerated breakdown of red blood cells, or the effects of certain medications. Distinguishing between conjugated and unconjugated forms of bilirubin helps identify the cause of an increase. Low total bilirubin has been linked to cardiovascular disease, stroke, metabolic syndrome, and diabetic peripheral neuropathy. On the other hand, high total bilirubin is typically associated with liver and gallbladder disorders, inflammation, and the influence of specific medications.
Standard Range: 0.20 - 1.20 mg/dL (3.42 - 20.52 µmol/L)
The ODX Range: 0.5 – 0.90 mg/dL (8.55 – 15.39 µmol/L)
OPTIMAL DX MEMBERS CLICK HERE for more information on Total Bilirubin
References
Akboga, Mehmet Kadri et al. “Association of serum total bilirubin level with severity of coronary atherosclerosis is linked to systemic inflammation.” Atherosclerosis vol. 240,1 (2015): 110-4. doi:10.1016/j.atherosclerosis.2015.02.051
Gillaspie, Devin B et al. “Total bilirubin trend as a predictor of common bile duct stones in acute cholecystitis and symptomatic cholelithiasis.” American journal of surgery vol. 217,1 (2019): 98-102. doi:10.1016/j.amjsurg.2018.06.011
Giral, Philippe et al. “Plasma bilirubin and gamma-glutamyltransferase activity are inversely related in dyslipidemic patients with metabolic syndrome: relevance to oxidative stress.” Atherosclerosis vol. 210,2 (2010): 607-13. doi:10.1016/j.atherosclerosis.2009.12.026
Kim, Eun Sook et al. “Inverse association between serum total bilirubin levels and diabetic peripheral neuropathy in patients with type 2 diabetes.” Endocrine vol. 50,2 (2015): 405-12. doi:10.1007/s12020-015-0583-0
Kunutsor, Setor K et al. “Circulating total bilirubin and risk of incident cardiovascular disease in the general population.” Arteriosclerosis, thrombosis, and vascular biology vol. 35,3 (2015): 716-24. doi:10.1161/ATVBAHA.114.304929
Lai, Xuefeng et al. “Direct, indirect and total bilirubin and risk of incident coronary heart disease in the Dongfeng-Tongji cohort.” Annals of medicine vol. 50,1 (2018): 16-25. doi:10.1080/07853890.2017.1377846
Lan, Yang et al. “Is serum total bilirubin a predictor of prognosis in arteriosclerotic cardiovascular disease? A meta-analysis.” Medicine vol. 98,42 (2019): e17544.
Pagana, Kathleen Deska, et al. Mosby's Diagnostic and Laboratory Test Reference. 15th ed., Mosby, 2021.
Perlstein, Todd S et al. “Serum total bilirubin level, prevalent stroke, and stroke outcomes: NHANES 1999-2004.” The American journal of medicine vol. 121,9 (2008): 781-788.e1. doi:10.1016/j.amjmed.2008.03.045
Shiraishi, Makoto et al. “Potential impact of the joint association of total bilirubin and gamma-glutamyltransferase with metabolic syndrome.” Diabetology & metabolic syndrome vol. 11 12. 4 Feb. 2019, doi:10.1186/s13098-019-0408-z
Singh, Anand, et al. “Unconjugated Hyperbilirubinemia.” StatPearls, StatPearls Publishing, 6 December 2021.
Suh, Sunghwan et al. “Relationship between serum bilirubin levels and cardiovascular disease.” PloS one vol. 13,2 e0193041. 15 Feb. 2018, doi:10.1371/journal.pone.0193041
Zeng, Dehui, et al. "Serum Lipid, Total Bile Acid and Total Bilirubin Levels are the Risk Factors of Gallstones." (2020).
Zhong, Ping et al. “Association of circulating total bilirubin level with ischemic stroke: a systemic review and meta-analysis of observational evidence.” Annals of translational medicine vol. 7,14 (2019): 335. doi:10.21037/atm.2019.06.71
Bilirubin, Direct
Direct bilirubin, the conjugated form of bilirubin in circulation, is made water-soluble by the liver for easy excretion in bile. Higher levels may indicate conditions such as gallstones, obstruction of the extrahepatic duct, liver metastases, or increased cardiovascular disease risk. In contrast, lower levels of direct bilirubin could suggest metabolic syndrome or the presence of smaller, more atherogenic LDL particles. Notably, direct bilirubin also functions as a potent antioxidant.
Standard Range: 0.00 - 0.20 mg/dL (0.00 - 3.42 µmol/L
The ODX Range: 0.11 - 0.15 mg/dL (1.88 – 2.57 µmol/L)
OPTIMAL DX MEMBERS CLICK HERE for more information on Direct Bilirubin
References
Kwon, Y-J et al. “Direct bilirubin is associated with low-density lipoprotein subfractions and particle size in overweight and centrally obese women.” Nutrition, metabolism, and cardiovascular diseases : NMCD vol. 28,10 (2018): 1021-1028. doi:10.1016/j.numecd.2018.05.013
Lai, Xuefeng et al. “Direct, indirect and total bilirubin and risk of incident coronary heart disease in the Dongfeng-Tongji cohort.” Annals of medicine vol. 50,1 (2018): 16-25. doi:10.1080/07853890.2017.1377846
Lee, Han Ah et al. “Direct Bilirubin Is More Valuable than Total Bilirubin for Predicting Prognosis in Patients with Liver Cirrhosis.” Gut and liver vol. 15,4 (2021): 599-605. doi:10.5009/gnl20171
Li C, et al. The Nonlinear Relationship Between Total Bilirubin and Coronary Heart Disease: A Dose-Response Meta-Analysis. Front Cardiovasc Med. 2022;8:761520. doi:10.3389/fcvm.2021.761520
Li J, et al. The predictive effect of direct-indirect bilirubin ratio on clinical events in acute coronary syndrome. BMC Cardiovasc Disord. 2022;22(1):478. doi:10.1186/s12872-022-02894-1
Li, Xiao-Hong et al. “Direct Bilirubin Levels and Risk of Metabolic Syndrome in Healthy Chinese Men.” BioMed research international vol. 2017 (2017): 9621615. doi:10.1155/2017/9621615
Nagae, Masaharu et al. “Association of direct bilirubin level with postoperative outcome in critically ill postoperative patients.” Korean journal of anesthesiology vol. 71,1 (2018): 30-36. doi:10.4097/kjae.2018.71.1.30
Pagana, Kathleen Deska, et al. Mosby's Diagnostic and Laboratory Test Reference. 15th ed., Mosby, 2021.
Song Y, Li W. Relationship between elevated serum direct bilirubin and atrial fibrillation risk among patients with coronary artery disease. Front Med (Lausanne). 2025;12:1405682. doi:10.3389/fmed.2025.1405682
Tian, Jianbo et al. “Association between bilirubin and risk of Non-Alcoholic Fatty Liver Disease based on a prospective cohort study.” Scientific reports vol. 6 31006. 3 Aug. 2016, doi:10.1038/srep31006
Zuo L, et al. Dose-Response Association Between Bilirubin and Cardiovascular Disease: A Systematic Review and Meta-analysis. Angiology. 2022;73(10):911-919. doi:10.1177/00033197211059693
Bilirubin, Indirect
Indirect unconjugated bilirubin, making up 70-85% of circulating bilirubin, serves as a strong antioxidant that can hinder LDL-C oxidation and thus lower cardiovascular disease risk and atherosclerosis. Lower levels of this bilirubin type can be indicative of severe carotid stenosis, coronary heart disease, or liver inflammation and fibrosis. However, higher levels may point to conditions such as hepatitis, cirrhosis, hemolytic jaundice, or various forms of anemia. Its role as an antioxidant may also help prevent the progression from fatty liver disease to steatohepatitis.
Standard Range: 0.20 - 1.20 mg/dL (3.42 - 20.52 µmol/L)
The ODX Range: 0.40 - 0.75 mg/dL (6.84 – 12.83 µmol/L)
OPTIMAL DX MEMBERS CLICK HERE for more information on Indirect Bilirubin
References
Hao, Hao et al. “Association of total bilirubin and indirect bilirubin content with metabolic syndrome among Kazakhs in Xinjiang.” BMC endocrine disorders vol. 20,1 110. 22 Jul. 2020, doi:10.1186/s12902-020-00563-y
Lai, Xuefeng et al. “Direct, indirect and total bilirubin and risk of incident coronary heart disease in the Dongfeng-Tongji cohort.” Annals of medicine vol. 50,1 (2018): 16-25. doi:10.1080/07853890.2017.1377846
Lapenna, Domenico et al. “Association of serum bilirubin with oxidant damage of human atherosclerotic plaques and the severity of atherosclerosis.” Clinical and experimental medicine vol. 18,1 (2018): 119-124. doi:10.1007/s10238-017-0470-5
Pagana, Kathleen Deska, et al. Mosby's Diagnostic and Laboratory Test Reference. 15th ed., Mosby, 2021.
Singh, Anand, et al. “Unconjugated Hyperbilirubinemia.” StatPearls, StatPearls Publishing, 6 December 2021.
Salomone, Federico et al. “Unconjugated bilirubin, a potent endogenous antioxidant, is decreased in patients with non-alcoholic steatohepatitis and advanced fibrosis.” Journal of gastroenterology and hepatology vol. 28,7 (2013): 1202-8. doi:10.1111/jgh.12155
Minerals are essential inorganic elements that play vital roles in various physiological processes in the human body. They are necessary for maintaining overall health and wellness, contributing to functions such as bone formation, enzyme activity, nerve function, fluid balance, and more. Minerals can be classified into two categories: macrominerals (or major minerals) and trace minerals. Both categories are crucial to maintaining optimal health, albeit in different quantities. Macrominerals minerals are required in relatively larger amounts compared to trace minerals which are required in smaller amounts but are still essential for proper bodily functions.
Calcium, Total
Calcium is a vital mineral for bone health, nerve transmission, muscle function, vascular contraction and dilation, hormone secretion, and cell-to-cell signaling. While most calcium is stored in bones, a small percentage is found in blood and tissues. Blood levels are maintained within a narrow range. High blood calcium is linked to hyperparathyroidism, hyperthyroidism, vitamin D overdose, bone breakdown, dehydration, and certain medications, while low serum calcium is associated with hypoparathyroidism, kidney failure, vitamin D deficiency, and physical immobility. Low blood calcium levels can be increased by breaking down bone and releasing calcium into circulation.
OPTIMAL DX MEMBERS CLICK HERE for more information on Calcium
References
Alsancak, Yakup, et al. "Can the Ratio of Calcium to Albumin Predict the Severity of Aortic Stenosis?." European Journal of Therapeutics 25.1 (2019): 44-50.
Baird, Geoffrey S. “Ionized calcium.” Clinica chimica acta; international journal of clinical chemistry vol. 412,9-10 (2011): 696-701. doi:10.1016/j.cca.2011.01.004
Goyal, Abhinav, et al. “Hypocalcemia.” StatPearls, StatPearls Publishing, 8 August 2021.
Hagstrom, E et al. “Serum calcium is independently associated with insulin sensitivity measured with euglycaemic-hyperinsulinaemic clamp in a community-based cohort.” Diabetologia vol. 50,2 (2007): 317-24. doi:10.1007/s00125-006-0532-9
Khan, Maqsood, et al. “Physiology, Parathyroid Hormone.” StatPearls, StatPearls Publishing, 27 September 2021.
Raymond, Janice L., et al. Krause and Mahan's Food & the Nutrition Care Process. Elsevier, 2021.
Pagana, Kathleen Deska, et al. Mosby's Diagnostic and Laboratory Test Reference. 15th ed., Mosby, 2021.
Park, Byoungjin, and Yong-Jae Lee. “Borderline high serum calcium levels are associated with arterial stiffness and 10-year cardiovascular disease risk determined by Framingham risk score.” Journal of clinical hypertension (Greenwich, Conn.) vol. 21,5 (2019): 668-673. doi:10.1111/jch.13532
Reid, I R et al. “Circulating calcium concentrations, vascular disease and mortality: a systematic review.” Journal of internal medicine vol. 279,6 (2016): 524-40. doi:10.1111/joim.12464
Sabanayagam, Charumathi, and Anoop Shankar. “Serum calcium levels and hypertension among U.S. adults.” Journal of clinical hypertension (Greenwich, Conn.) vol. 13,10 (2011): 716-21. doi:10.1111/j.1751-7176.2011.00503.x
Sadiq, Nazia M., et al. “Hypercalcemia.” StatPearls, StatPearls Publishing, 4 September 2023.
Sadiq, Nazia M., et al. “Hypercalcemia.” StatPearls, StatPearls Publishing, 7 May 2024.
Slinin, Yelena et al. “Serum calcium, phosphorus and cardiovascular events in post-menopausal women.” International journal of cardiology vol. 149,3 (2011): 335-40. doi:10.1016/j.ijcard.2010.02.013
Sun, Jia-Kui et al. “Serum calcium as a biomarker of clinical severity and prognosis in patients with coronavirus disease 2019.” Aging vol. 12,12 (2020): 11287-11295. doi:10.18632/aging.103526
Calcium, Ionized
Calcium plays a crucial role in various bodily functions, including bone health, nerve signaling, blood clotting, and muscle contraction. Ionized calcium, the free and bioavailable form, makes up about 40% of total blood calcium. Low levels of ionized calcium can lead to muscle spasms, seizures, and increased mortality risk, while high levels are linked to bone diseases, kidney failure, and cardiovascular issues. The balance of ionized calcium is regulated by hormones and is essential for overall health. Measuring ionized calcium levels is important in certain medical conditions, as it provides a more accurate assessment of calcium status than total calcium levels.
OPTIMAL DX MEMBERS CLICK HERE for more information on Ionized Calcium
References
Baird, Geoffrey S. “Ionized calcium.” Clinica chimica acta; international journal of clinical chemistry vol. 412,9-10 (2011): 696-701. doi:10.1016/j.cca.2011.01.004
Goyal, Abhinav, et al. “Hypocalcemia.” StatPearls, StatPearls Publishing, 15 October 2023.
Hamroun, Aghilès, et al. "Ionized calcium: analytical challenges and clinical relevance." J Lab Precis Med 5 (2020): 22.
Hill Gallant, Kathleen M, and David M Spiegel. “Calcium Balance in Chronic Kidney Disease.” Current osteoporosis reports vol. 15,3 (2017): 214-221. doi:10.1007/s11914-017-0368-x
Kobylecki, Camilla J et al. “Low Plasma Ionized Calcium Is Associated With Increased Mortality: A Population-based Study of 106 768 Individuals.” The Journal of clinical endocrinology and metabolism vol. 107,7 (2022): e3039-e3047. doi:10.1210/clinem/dgac146
Ong, Gregory S Y et al. “The importance of measuring ionized calcium in characterizing calcium status and diagnosing primary hyperparathyroidism.” The Journal of clinical endocrinology and metabolism vol. 97,9 (2012): 3138-45. doi:10.1210/jc.2012-1429
Pagana, Kathleen Deska, et al. Mosby's Diagnostic and Laboratory Test Reference. 16th ed., Mosby, 2022.
Sadiq, Nazia M., et al. “Hypercalcemia.” StatPearls, StatPearls Publishing, 4 September 2023.
Reid, I R et al. “Circulating calcium concentrations, vascular disease and mortality: a systematic review.” Journal of internal medicine vol. 279,6 (2016): 524-40. doi:10.1111/joim.12464
Thongprayoon, Charat et al. “Hospital mortality and long-term mortality among hospitalized patients with various admission serum ionized calcium levels.” Postgraduate medicine vol. 132,4 (2020): 385-390. doi:10.1080/00325481.2020.1728980
Calcium:Albumin Ratio
The calcium:albumin ratio (CAR) can reflect variations in protein or calcium levels in the body. An increased ratio may suggest protein deficiency or calcium excess, while a decreased ratio can indicate vitamin D or calcium insufficiency. High CARs are associated with cardiovascular risks, including aortic stenosis. Moreover, studies show that a higher CAR is linked to more severe coronary artery disease. Therefore, the CAR is a significant health marker, especially in cardiovascular health contexts.
Standard Range: 0.00 - 2.60 Ratio (0.00 – 0.06 Ratio (SI))
The ODX Range: 0.00 - 2.18 Ratio (0.00 – 0.05 Ratio (SI))
OPTIMAL DX MEMBERS CLICK HERE for more information on Calcium:Albumin Ratio
References
Alsancak, Yakup, et al. "Role of calcium–albumin ratio in severity of coronary artery disease assessed by angiographic SYNTAX score." Archives of Clinical and Experimental Medicine 3.3 (2018): 174-178.
ALSANCAK, YAKUP, et al. "Can the Ratio of Calcium to Albumin Predict the Severity of Aortic Stenosis?." European Journal of Therapeutics 25.1 (2019): 44-50.
Grandi, Norma Christine et al. “Calcium, phosphate and the risk of cardiovascular events and all-cause mortality in a population with stable coronary heart disease.” Heart (British Cardiac Society) vol. 98,12 (2012): 926-33. doi:10.1136/heartjnl-2011-300806
Calcium:Phosphorus Ratio
The calcium to phosphorus ratio (Ca/P) in the blood can help identify conditions such as hyperparathyroidism or hypoparathyroidism. Higher Ca/P ratios can suggest hyperparathyroidism or low phosphorus, while lower ratios might indicate hypoparathyroidism or diseases like rheumatoid arthritis. Additionally, dietary imbalances of calcium and phosphorus can negatively impact this ratio, affecting overall health, including bone and vascular health.
Standard Range: 1.90 - 4.20 Ratio (1.47 - 3.25 Ratio (SI))
The ODX Range: 2.30 - 3.20 Ratio (1.78 - 2.48 Ratio (SI))
OPTIMAL DX MEMBERS CLICK HERE for more information on Calcium:Phosphorus Ratio
References
Adatorwovor, Reuben et al. “Intakes of Calcium and Phosphorus and Calculated Calcium-to-Phosphorus Ratios of Older Adults: NHANES 2005-2006 Data.” Nutrients vol. 7,11 9633-9. 19 Nov. 2015, doi:10.3390/nu7115492
Kemi, Virpi E et al. “Low calcium:phosphorus ratio in habitual diets affects serum parathyroid hormone concentration and calcium metabolism in healthy women with adequate calcium intake.” The British journal of nutrition vol. 103,4 (2010): 561-8. doi:10.1017/S0007114509992121
Gutiérrez, Orlando M et al. “Effects of phosphorus and calcium to phosphorus consumption ratio on mineral metabolism and cardiometabolic health.” The Journal of nutritional biochemistry vol. 80 (2020): 108374. doi:10.1016/j.jnutbio.2020.108374
Madeo, Bruno, et al. "Serum calcium to phosphorous (Ca/P) ratio is a simple, inexpensive, and accurate tool in the diagnosis of primary hyperparathyroidism." JBMR plus 2.2 (2018): 109-117.
Madeo, B et al. “Reliability of calcium-phosphorus (Ca/P) ratio as a new, accurate and inexpensive tool in the diagnosis of some Ca-P disorders.” Journal of endocrinological investigation vol. 42,9 (2019): 1041-1049. doi:10.1007/s40618-019-01025-6
Madeo, Bruno et al. “The calcium-to-phosphorous (Ca/P) ratio in the diagnosis of primary hyperparathyroidism and hypoparathyroidism: a multicentric study.” Endocrine vol. 68,3 (2020): 679-687. doi:10.1007/s12020-020-02276-7
Spiegel, David M, and Kate Brady. “Calcium balance in normal individuals and in patients with chronic kidney disease on low- and high-calcium diets.” Kidney international vol. 81,11 (2012): 1116-22. doi:10.1038/ki.2011.490
Walwadkar, S D et al. “Oxidative stress and calcium-phosphorus levels in Rheumatoid arthritis.” Indian journal of clinical biochemistry : IJCB vol. 21,2 (2006): 134-7. doi:10.1007/BF02912928
Phosphorus
Phosphorus is an essential mineral for various physiological functions, including bone structure, cellular activity, and energy metabolism. Low phosphorus levels can indicate malnutrition or conditions such as hyperinsulinemia, hyperparathyroidism, or vitamin D deficiency. In contrast, high phosphorus levels are often linked to kidney disease, liver disease, cardiovascular disease (CVD), and dementia. Dietary phosphorus is abundant in protein-rich foods, processed foods, and soft drinks, and imbalances in its intake can have serious health impacts. Several studies indicate that elevated phosphorus can increase the risk of atherosclerosis, CVD, and dementia, even in healthy individuals. Conversely, both low and high phosphorus levels have been associated with anemia.
Standard Range: 2.50 - 4.50 mg/dL (0.81 - 1.45 mmol/L)
The ODX Range: 2.6 - 3.5 mg/dL (0.81 - 1.13 mmol/L)
OPTIMAL DX MEMBERS CLICK HERE for more information on Phosphorus
References
Foley, Robert N et al. “Serum phosphorus levels associate with coronary atherosclerosis in young adults.” Journal of the American Society of Nephrology : JASN vol. 20,2 (2009): 397-404. doi:10.1681/ASN.2008020141
Gropper, Sareen S.; Smith, Jack L.; Carr, Timothy P. Advanced Nutrition and Human Metabolism. 8th edition. Wadsworth Publishing Co Inc. 2021.
Li, Tingting et al. “Serum phosphorus levels and risk of incident dementia.” PloS one vol. 12,2 e0171377. 2 Feb. 2017, doi:10.1371/journal.pone.0171377
Pagana, Kathleen Deska, et al. Mosby's Diagnostic and Laboratory Test Reference. 15th ed., Mosby, 2021.
Park, Kyung Sun et al. “Lower concentrations of serum phosphorus within the normal range could be associated with less calcification of the coronary artery in Koreans with normal renal function.” The American journal of clinical nutrition vol. 94,6 (2011): 1465-70. doi:10.3945/ajcn.110.001974
Park, Kyung Sun et al. “Serum Phosphorus Concentration and Coronary Artery Calcification in Subjects without Renal Dysfunction.” PloS one vol. 11,3 e0151007. 18 Mar. 2016, doi:10.1371/journal.pone.0151007
Tonelli, Marcello et al. “Relation between serum phosphate level and cardiovascular event rate in people with coronary disease.” Circulation vol. 112,17 (2005): 2627-33. doi:10.1161/CIRCULATIONAHA.105.553198
Stoian, Marilena, and Victor Stoica. “The role of distubances of phosphate metabolism in metabolic syndrome.” Maedica vol. 9,3 (2014): 255-60.
Tran, Lac et al. “Serum phosphorus and association with anemia among a large diverse population with and without chronic kidney disease.” Nephrology, dialysis, transplantation : official publication of the European Dialysis and Transplant Association - European Renal Association vol. 31,4 (2016): 636-45. doi:10.1093/ndt/gfv297
Magnesium, Serum
Magnesium is an essential mineral, functioning as a cofactor for over 600 metabolic enzymes and playing a significant role in cardiovascular health, neurological function, bone integrity, and glucose regulation. Deficiency, often linked to inadequate intake or malabsorption, can lead to various health issues including hypertension, cardiac arrhythmias, osteoporosis, glucose dysregulation, depression, and sleep disturbances, among others. Conversely, hypermagnesemia, though rare, can occur due to excessive intake or impaired kidney excretion, potentially leading to muscle weakness and cardiac issues. The mineral is abundant in foods like nuts, seeds, legumes, cocoa, and whole grains. However, its level can be depleted due to food processing, poor soil, and certain agricultural practices. Thus, the evaluation of magnesium status should include both dietary intake and serum levels.
Standard Range: 1.50 - 2.50 mg/dL (0.62 - 1.04 mmol/L)
The ODX Range: 2.20 - 2.50 mg/dL (0.91 - 1.04 mmol/L)
OPTIMAL DX MEMBERS CLICK HERE for more information on Magnesium
References
Cascella, Marco. and Sarosh Vaqar. “Hypermagnesemia.” StatPearls, StatPearls Publishing, 30 May 2022.
Costello, Rebecca B et al. “Perspective: The Case for an Evidence-Based Reference Interval for Serum Magnesium: The Time Has Come.” Advances in nutrition (Bethesda, Md.) vol. 7,6 977-993. 15 Nov. 2016, doi:10.3945/an.116.012765
Dai, Qi et al. “The relation of magnesium and calcium intakes and a genetic polymorphism in the magnesium transporter to colorectal neoplasia risk.” The American journal of clinical nutrition vol. 86,3 (2007): 743-51. doi:10.1093/ajcn/86.3.743
Fiorentini, Diana et al. “Magnesium: Biochemistry, Nutrition, Detection, and Social Impact of Diseases Linked to Its Deficiency.” Nutrients vol. 13,4 1136. 30 Mar. 2021, doi:10.3390/nu13041136
Karim, M R et al. “Relation between Serum Magnesium Level and Migraine.” Mymensingh medical journal : MMJ vol. 30,2 (2021): 301-306.
Lindkvist, Björn et al. “Serum nutritional markers for prediction of pancreatic exocrine insufficiency in chronic pancreatitis.” Pancreatology : official journal of the International Association of Pancreatology (IAP) ... [et al.] vol. 12,4 (2012): 305-10. doi:10.1016/j.pan.2012.04.006
Micke, Oliver et al. “Serum magnesium: time for a standardized and evidence-based reference range.” Magnesium research vol. 34,2 (2021): 84-89. doi:10.1684/mrh.2021.0486
Musso, Carlos G. “Magnesium metabolism in health and disease.” International urology and nephrology vol. 41,2 (2009): 357-62. doi:10.1007/s11255-009-9548-7
Pagana, Kathleen Deska, et al. Mosby's Diagnostic and Laboratory Test Reference. 15th ed., Mosby, 2021.
Rodríguez-Morán, Martha et al. “Oral Magnesium Supplementation and Metabolic Syndrome: A Randomized Double-Blind Placebo-Controlled Clinical Trial.” Advances in chronic kidney disease vol. 25,3 (2018): 261-266. doi:10.1053/j.ackd.2018.02.011
Samaie, Afshin et al. “Blood Magnesium levels in migraineurs within and between the headache attacks: a case control study.” The Pan African medical journal vol. 11 (2012): 46.
Sitzia, Clementina et al. “Intra-erythrocytes magnesium deficiency could reflect cognitive impairment status due to vascular disease: a pilot study.” Journal of translational medicine vol. 18,1 458. 3 Dec. 2020, doi:10.1186/s12967-020-02645-w
Van Laecke, Steven. “Hypomagnesemia and hypermagnesemia.” Acta clinica Belgica vol. 74,1 (2019): 41-47. doi:10.1080/17843286.2018.1516173
Verma, H, and R Garg. “Effect of magnesium supplementation on type 2 diabetes associated cardiovascular risk factors: a systematic review and meta-analysis.” Journal of human nutrition and dietetics : the official journal of the British Dietetic Association vol. 30,5 (2017): 621-633. doi:10.1111/jhn.12454
Wu, Jing et al. “Association Between Serum Magnesium and the Prevalence of Kidney Stones: a Cross-sectional Study.” Biological trace element research vol. 195,1 (2020): 20-26. doi:10.1007/s12011-019-01830-3
Magnesium, RBC
Magnesium is a vital mineral required by every organ in the body, playing key roles in cardiovascular health, glucose regulation, neurological function, and bone health. Deficiency, often due to inadequate intake or malabsorption, can lead to various conditions, including diabetes, cardiovascular disease, inflammation, cognitive impairment, and depression. Assessing magnesium levels in red blood cells, not just serum, can provide a more accurate reflection of available magnesium in the body. Overdoses, although rare, usually stem from excessive supplementation or reduced kidney excretion. Therefore, maintaining a balanced magnesium level is crucial for overall health, and it requires careful consideration of both dietary intake and potential medical complications.
Standard Range: 4.00 - 6.80 mg/dL (1.66 - 2.82 mmol/L)
The ODX Range: 6.00 - 6.80 mg/dL (2.48 - 2.82 mmol/L)
OPTIMAL DX MEMBERS CLICK HERE for more information on RBC Magnesium
References
Cascella, Marco. and Sarosh Vaqar. “Hypermagnesemia.” StatPearls, StatPearls Publishing, 30 May 2022.
Costello, Rebecca B et al. “Perspective: The Case for an Evidence-Based Reference Interval for Serum Magnesium: The Time Has Come.” Advances in nutrition (Bethesda, Md.) vol. 7,6 977-993. 15 Nov. 2016, doi:10.3945/an.116.012765
Heidari, Zinat Zinat, Alireza Abdollahi, and Hossein Khalili. "Is Intra-Cellular Magnesium Concentration Correlate with Morbidity and Mortality in Critically Ill Patients? A Cross-Sectional Study." Journal of Pharmaceutical Care (2020).
Pagana, Kathleen Deska, et al. Mosby's Diagnostic and Laboratory Test Reference. 15th ed., Mosby, 2021.
Hermes Sales, Cristiane et al. “There is chronic latent magnesium deficiency in apparently healthy university students.” Nutricion hospitalaria vol. 30,1 200-4. 1 Jul. 2014, doi:10.3305/nh.2014.30.1.7510
Karim, M R et al. “Relation between Serum Magnesium Level and Migraine.” Mymensingh medical journal : MMJ vol. 30,2 (2021): 301-306.
Lindkvist, Björn et al. “Serum nutritional markers for prediction of pancreatic exocrine insufficiency in chronic pancreatitis.” Pancreatology : official journal of the International Association of Pancreatology (IAP) ... [et al.] vol. 12,4 (2012): 305-10. doi:10.1016/j.pan.2012.04.006
Micke, Oliver et al. “Serum magnesium: time for a standardized and evidence-based reference range.” Magnesium research vol. 34,2 (2021): 84-89. doi:10.1684/mrh.2021.0486
Pagana, Kathleen Deska, et al. Mosby's Diagnostic and Laboratory Test Reference. 15th ed., Mosby, 2021.
Razzaque, Mohammed S. “Magnesium: Are We Consuming Enough?.” Nutrients vol. 10,12 1863. 2 Dec. 2018, doi:10.3390/nu10121863
Sitzia, Clementina et al. “Intra-erythrocytes magnesium deficiency could reflect cognitive impairment status due to vascular disease: a pilot study.” Journal of translational medicine vol. 18,1 458. 3 Dec. 2020, doi:10.1186/s12967-020-02645-w
Van Laecke, Steven. “Hypomagnesemia and hypermagnesemia.” Acta clinica Belgica vol. 74,1 (2019): 41-47. doi:10.1080/17843286.2018.1516173
Verma, H, and R Garg. “Effect of magnesium supplementation on type 2 diabetes associated cardiovascular risk factors: a systematic review and meta-analysis.” Journal of human nutrition and dietetics : the official journal of the British Dietetic Association vol. 30,5 (2017): 621-633. doi:10.1111/jhn.12454
Wu, Jing et al. “Association Between Serum Magnesium and the Prevalence of Kidney Stones: a Cross-sectional Study.” Biological trace element research vol. 195,1 (2020): 20-26. doi:10.1007/s12011-019-01830-3-
Copper, Serum
Copper is an essential trace mineral vital for numerous bodily functions, including iron metabolism, red blood cell health, energy production, antioxidant systems, hormone metabolism, and immunity. Insufficient copper levels can cause anemia, oxidative stress, ischemic heart disease, and ataxia, while high copper levels can lead to obesity, diabetes, heart disease, and cognitive impairment. Copper intake is critical for maintaining homeostasis, with sources including whole grains, fruits, nuts, offal, and water. Both low and high copper levels can lead to various health complications. Hence it's essential to maintain an optimal balance while also considering other metabolic parameters.
Standard Range: 70.00 – 175.00 µg/dL (10.99 – 27.48 µmol/L)
The ODX Range: 90– 150 µg/dL (14.16 – 23.60 µmol/L)
OPTIMAL DX MEMBERS CLICK HERE for more information on Serum Copper
References
Aliasgharpour, Mehri. "Mini Review Article A review on copper, ceruloplasmin and wilson's disease." Int J Med Invest 4.4 (2015): 344-347.
Bost, Muriel et al. “Dietary copper and human health: Current evidence and unresolved issues.” Journal of trace elements in medicine and biology : organ of the Society for Minerals and Trace Elements (GMS) vol. 35 (2016): 107-15. doi:10.1016/j.jtemb.2016.02.006
Burkhead, Jason L, and James F Collins. “Nutrition Information Brief-Copper.” Advances in nutrition (Bethesda, Md.) vol. 13,2 (2022): 681-683. doi:10.1093/advances/nmab157
DiNicolantonio, James J et al. “Copper deficiency may be a leading cause of ischaemic heart disease.” Open heart vol. 5,2 e000784. 8 Oct. 2018, doi:10.1136/openhrt-2018-000784
Dwivedi, Jyoti, and Purnima Dey Sarkar. "Study of oxidative stress, homocysteine, copper & zinc in nephrotic syndrome: therapy with antioxidants, minerals and B-complex vitamins." Journal of Biochemical Technology 1.4 (2009): 104-107.
Gropper, Sareen S.; Smith, Jack L.; Carr, Timothy P. Advanced Nutrition and Human Metabolism. 8th edition. Wadsworth Publishing Co Inc. 2021.
Gu, Kunfang et al. “The Relationship Between Serum Copper and Overweight/Obesity: a Meta-analysis.” Biological trace element research vol. 194,2 (2020): 336-347. doi:10.1007/s12011-019-01803-6
Hatano, S et al. “Copper levels in plasma and erythrocytes in healthy Japanese children and adults.” The American journal of clinical nutrition vol. 35,1 (1982): 120-6. doi:10.1093/ajcn/35.1.120
Hordyjewska, Anna et al. “The many "faces" of copper in medicine and treatment.” Biometals : an international journal on the role of metal ions in biology, biochemistry, and medicine vol. 27,4 (2014): 611-21. doi:10.1007/s10534-014-9736-5
Huang, Lei et al. “Association between serum copper and heart failure: a meta-analysis.” Asia Pacific journal of clinical nutrition vol. 28,4 (2019): 761-769. doi:10.6133/apjcn.201912_28(4).0013
Lam, P K et al. “Plasma trace elements and cognitive function in older men and women: the Rancho Bernardo study.” The journal of nutrition, health & aging vol. 12,1 (2008): 22-7. doi:10.1007/BF02982160
Olaniyan, O. O., et al. "Serum copper and zinc levels in Nigerian type 2 diabetic patients." African Journal of Diabetes Medicine Vol 20.2 (2012).
Marotta, Dario A et al. “Myeloneuropathy in the Setting of Hypocupremia: An Overview of Copper-Related Pathophysiology.” Cureus vol. 13,7 e16254. 8 Jul. 2021, doi:10.7759/cureus.16254
Copper, RBC
Copper, a vital trace mineral, plays a significant role in various metabolic functions, including iron metabolism, energy production, antioxidant activity, blood clotting, immunity, neurotransmitter metabolism, and the production of collagen and melanin. Low copper levels can result in anemia, decreased erythropoiesis, neutropenia, thrombocytopenia, leukopenia, and neurologic dysfunction, among other issues. On the other hand, high copper levels are associated with cognitive deficits, diabetes, obesity, nephrotic syndrome, and cardiovascular disorders. Red blood cell (RBC) copper may offer a more accurate measure of total body copper levels than serum levels. Overt clinical manifestations of copper deficiency, such as physical and delayed mental development, likely appear only when copper stores are considerably depleted.
Standard Range: 0.53 – 0.91 mg/L (8.34 – 14.32 µmol/L)
The ODX Range: 0.53 – 0.91 mg/L (8.34 – 14.32 µmol/L)
OPTIMAL DX MEMBERS CLICK HERE for more information on RBC Copper
References
DiNicolantonio, James J et al. “Copper deficiency may be a leading cause of ischaemic heart disease.” Open heart vol. 5,2 e000784. 8 Oct. 2018, doi:10.1136/openhrt-2018-000784
Gropper, Sareen S.; Smith, Jack L.; Carr, Timothy P. Advanced Nutrition and Human Metabolism. 8th edition. Wadsworth Publishing Co Inc. 2021.
Gu, Kunfang et al. “The Relationship Between Serum Copper and Overweight/Obesity: a Meta-analysis.” Biological trace element research vol. 194,2 (2020): 336-347. doi:10.1007/s12011-019-01803-6
Hatano, S et al. “Copper levels in plasma and erythrocytes in healthy Japanese children and adults.” The American journal of clinical nutrition vol. 35,1 (1982): 120-6. doi:10.1093/ajcn/35.1.120
Hordyjewska, Anna et al. “The many "faces" of copper in medicine and treatment.” Biometals : an international journal on the role of metal ions in biology, biochemistry, and medicine vol. 27,4 (2014): 611-21. doi:10.1007/s10534-014-9736-5
Huang, Lei et al. “Association between serum copper and heart failure: a meta-analysis.” Asia Pacific journal of clinical nutrition vol. 28,4 (2019): 761-769. doi:10.6133/apjcn.201912_28(4).0013
Lam, P K et al. “Plasma trace elements and cognitive function in older men and women: the Rancho Bernardo study.” The journal of nutrition, health & aging vol. 12,1 (2008): 22-7. doi:10.1007/BF02982160
Marotta, Dario A et al. “Myeloneuropathy in the Setting of Hypocupremia: An Overview of Copper-Related Pathophysiology.” Cureus vol. 13,7 e16254. 8 Jul. 2021, doi:10.7759/cureus.16254
Maynar, M et al. “Erythrocyte concentrations of chromium, copper, manganese, molybdenum, selenium and zinc in subjects with different physical training levels.” Journal of the International Society of Sports Nutrition vol. 17,1 35. 9 Jul. 2020, doi:10.1186/s12970-020-00367-4
Olaniyan, O. O., et al. "Serum copper and zinc levels in Nigerian type 2 diabetic patients." African Journal of Diabetes Medicine Vol 20.2 (2012).
Zinc, Serum
Zinc is an essential trace mineral involved in many metabolic processes, including digestion, immunity, wound healing, and thyroid hormone production. Insufficiency can lead to ailments such as diarrhea, skin rash, anorexia, alopecia, vision problems, and compromised immunity, while high serum zinc can result in zinc toxicity and copper deficiency. Chronic use of proton pump inhibitors can contribute to zinc deficiency. Moreover, zinc plays a crucial role in maintaining gut health, thyroid hormone production, glucose tolerance, immunity, and antioxidant function. Disruptions in zinc levels can have a wide range of consequences, affecting everything from athletic performance to iron metabolism.
Standard Range: 50.00 – 130.00 µg/dL (7.64 – 19.88 µmol/L)
The ODX Range: 99 - 130 µg/dL (15.15 - 19.89 µmol/L)
OPTIMAL DX MEMBERS CLICK HERE for more information on Serum Zinc
References
Betsy, Ambooken et al. “Zinc deficiency associated with hypothyroidism: an overlooked cause of severe alopecia.” International journal of trichology vol. 5,1 (2013): 40-2. doi:10.4103/0974-7753.114714
Cruz, Kyria Jayanne Clímaco et al. “Antioxidant role of zinc in diabetes mellitus.” World journal of diabetes vol. 6,2 (2015): 333-7. doi:10.4239/wjd.v6.i2.333
Farrell, Christopher P et al. “Proton Pump Inhibitors Interfere With Zinc Absorption and Zinc Body Stores.” Gastroenterology research vol. 4,6 (2011): 243-251. doi:10.4021/gr379w
Gropper, Sareen S.; Smith, Jack L.; Carr, Timothy P. Advanced Nutrition and Human Metabolism. 8th edition. Wadsworth Publishing Co Inc. 2021.
Kelkitli, Engin et al. “Serum zinc levels in patients with iron deficiency anemia and its association with symptoms of iron deficiency anemia.” Annals of hematology vol. 95,5 (2016): 751-6. doi:10.1007/s00277-016-2628-8
Koury, Josely C et al. “Zinc and copper biochemical indices of antioxidant status in elite athletes of different modalities.” International journal of sport nutrition and exercise metabolism vol. 14,3 (2004): 358-72. doi:10.1123/ijsnem.14.3.358
Maxfield, Luke, et al. “Zinc Deficiency.” StatPearls, StatPearls Publishing, 28 November 2021.
MOHAMMAD, BAHEEJ Y., M. R. Haji, and D. J. Al-Tamimi. "Zinc status among smokers and non-smokers: Relation to oxidative stress." (2010): 67-73.
Noland, Diana, Jeanne A. Drisko, and Leigh Wagner, eds. Integrative and functional medical nutrition therapy: principles and practices. Springer Nature, 2020.
Olaniyan, O. O., et al. "Serum copper and zinc levels in Nigerian type 2 diabetic patients." African Journal of Diabetes Medicine Vol 20.2 (2012).
Olechnowicz, J et al. “Zinc status is associated with inflammation, oxidative stress, lipid, and glucose metabolism.” The journal of physiological sciences : JPS vol. 68,1 (2018): 19-31. doi:10.1007/s12576-017-0571-7
Pagana, Kathleen Deska, et al. Mosby's Diagnostic and Laboratory Test Reference. 15th ed., Mosby, 2021.
Ray, Chinmaya Sundar, et al. "Low alkaline phosphatase (ALP) in adult population an indicator of zinc (Zn) and magnesium (Mg) deficiency." Current Research in Nutrition and Food Science Journal 5.3 (2017): 347-352.
Sinha, S., Kar, K., Dasgupta, A., Basu, S., & Sen, S. (2015). Correlation of Serum zinc with TSH in hyperthyroidism. Asian Journal of Medical Sciences, 7(1), 66-69.
Skalny, Anatoly V et al. “Zinc and respiratory tract infections: Perspectives for COVID‑19 (Review).” International journal of molecular medicine vol. 46,1 (2020): 17-26. doi:10.3892/ijmm.2020.4575
Skrovanek, Sonja et al. “Zinc and gastrointestinal disease.” World journal of gastrointestinal pathophysiology vol. 5,4 (2014): 496-513. doi:10.4291/wjgp.v5.i4.496
Yanagisawa, Hiroyuki. "Zinc deficiency and clinical practice." Japan Medical Association Journal 47.8 (2004): 359-364.
Zinc, RBC
Red blood cell (RBC) zinc levels, which are less influenced by short-term changes, can provide insights into long-term zinc status. Low RBC zinc levels have been associated with obesity and hyperthyroidism, influencing metabolic functions and inflammation. High RBC zinc levels may indicate zinc toxicity. Additionally, RBC zinc measurements can help differentiate types of thyrotoxicosis and discern if hypothyroidism is transient or permanent. Sustained insufficient zinc intake can decrease RBC zinc levels, leading to impaired cardiorespiratory function and physical performance.
Standard Range: 9.00 – 14.70 mg/L (137.62 – 224.78 µmol/L)
The ODX Range: 10.40 – 14.70 mg/L (159.03 – 224.78 µmol/L)
OPTIMAL DX MEMBERS CLICK HERE for more information on RBC Zinc
References
Braun, L A, and F Rosenfeldt. “Pharmaco-nutrient interactions - a systematic review of zinc and antihypertensive therapy.” International journal of clinical practice vol. 67,8 (2013): 717-25. doi:10.1111/ijcp.12040
Kuriyama, Chizuko et al. “Erythrocyte zinc concentration as an indicator to distinguish painless thyroiditis-associated transient hypothyroidism from permanent hypothyroidism.” Endocrine journal vol. 58,1 (2011): 59-63. doi:10.1507/endocrj.k10e-152
Lukaski, Henry C. “Low dietary zinc decreases erythrocyte carbonic anhydrase activities and impairs cardiorespiratory function in men during exercise.” The American journal of clinical nutrition vol. 81,5 (2005): 1045-51. doi:10.1093/ajcn/81.5.1045
Olechnowicz, J et al. “Zinc status is associated with inflammation, oxidative stress, lipid, and glucose metabolism.” The journal of physiological sciences : JPS vol. 68,1 (2018): 19-31. doi:10.1007/s12576-017-0571-7
Sayama, N et al. “Measurement of red blood cell zinc concentration with Zn-test kit: discrimination between hyperthyroid Graves' disease and transient thyrotoxicosis.” Endocrine journal vol. 45,6 (1998): 767-72. doi:10.1507/endocrj.45.767
Yoshida, K et al. “Erythrocyte zinc in hyperthyroidism: reflection of integrated thyroid hormone levels over the previous few months.” Metabolism: clinical and experimental vol. 39,2 (1990): 182-6. doi:10.1016/0026-0495(90)90073-l
Copper Zinc Ratio
The plasma copper-to-zinc ratio (CZr) provides important insights into copper and zinc status and metabolic health. An imbalance in this ratio can disrupt crucial metabolic functions, with elevated CZr indicating zinc insufficiency or copper excess, often associated with inflammation, oxidative stress, and even lowered educational achievement. Studies show increased CZr values relate to higher mortality rates among elders, an increased risk of severe infections, and degenerative diseases. CZr can also be indicative of disease presence and severity in conditions like lung cancer and autism. A balanced CZr is believed to promote optimal health and immune response effectiveness.
Standard Range: 0.8 - 2.0 Ratio
The ODX Range: 0.7 - 1.5 Ratio
OPTIMAL DX MEMBERS CLICK HERE for more information on Copper Zinc Ratio
References
Bockerman, Petri et al. “The serum copper/zinc ratio in childhood and educational attainment: a population-based study.” Journal of public health (Oxford, England) vol. 38,4 (2016): 696-703. doi:10.1093/pubmed/fdv187
Bahi, Gnogbo Alexis et al. “Assessments of serum copper and zinc concentration, and the Cu/Zn ratio determination in patients with multidrug resistant pulmonary tuberculosis (MDR-TB) in Côte d'Ivoire.” BMC infectious diseases vol. 17,1 257. 11 Apr. 2017, doi:10.1186/s12879-017-2343-7
Dìez, M et al. “Use of the copper/zinc ratio in the diagnosis of lung cancer.” Cancer vol. 63,4 (1989): 726-30. doi:10.1002/1097-0142(19890215)63:4<726::aid-cncr2820630421>3.0.co;2-p
Guo, Chih-Hung, and Chia-Liang Wang. “Effects of zinc supplementation on plasma copper/zinc ratios, oxidative stress, and immunological status in hemodialysis patients.” International journal of medical sciences vol. 10,1 (2013): 79-89. doi:10.7150/ijms.5291
Malavolta, Marco et al. “Plasma copper/zinc ratio: an inflammatory/nutritional biomarker as predictor of all-cause mortality in elderly population.” Biogerontology vol. 11,3 (2010): 309-19. doi:10.1007/s10522-009-9251-1
Malavolta, Marco et al. “Serum copper to zinc ratio: Relationship with aging and health status.” Mechanisms of ageing and development vol. 151 (2015): 93-100. doi:10.1016/j.mad.2015.01.004
Mezzetti, A et al. “Copper/zinc ratio and systemic oxidant load: effect of aging and aging-related degenerative diseases.” Free radical biology & medicine vol. 25,6 (1998): 676-81. doi:10.1016/s0891-5849(98)00109-9
Viktorinova, Alena et al. “Changed Plasma Levels of Zinc and Copper to Zinc Ratio and Their Possible Associations with Parent- and Teacher-Rated Symptoms in Children with Attention-Deficit Hyperactivity Disorder.” Biological trace element research vol. 169,1 (2016): 1-7. doi:10.1007/s12011-015-0395-3
Walsh, W J et al. “Elevated blood copper/zinc ratios in assaultive young males.” Physiology & behavior vol. 62,2 (1997): 327-9. doi:10.1016/s0031-9384(97)88988-3
Yanagisawa, Hiroyuki. "Zinc deficiency and clinical practice." Japan Medical Association Journal 47.8 (2004): 359-364.
Zhang, Huidi et al. “Study on Reference Range of Zinc, Copper and Copper/Zinc Ratio in Childbearing Women of China.” Nutrients vol. 13,3 946. 15 Mar. 2021, doi:10.3390/nu13030946
Ceruloplasmin
Ceruloplasmin facilitates copper transport, iron oxidation, and antioxidant activity. Reduced levels signify copper deficiency, genetic aceruloplasminemia, or malnutrition, while increased levels suggest copper toxicity, zinc deficiency, inflammation, infection, or cardiovascular disease. Ceruloplasmin plays a critical role in iron metabolism, helping to mobilize iron from tissues into the blood. It also assists in inhibiting the usage of iron by pathogenic microbes and in reducing superoxide free radicals during inflammation and infection. Furthermore, studies indicate that elevated ceruloplasmin levels could be associated with increased cardiovascular risk and higher mortality in patients with heart disease.
Standard Range: 19.00 – 39.00 mg/dL (1.90 – 3.90 µmol/L)
The ODX Range: 18.00 – 21.00 mg/dL (1.80 – 2.10 µmol/L)
OPTIMAL DX MEMBERS CLICK HERE for more information on Ceruloplasmin
References
Gropper, Sareen S.; Smith, Jack L.; Carr, Timothy P. Advanced Nutrition and Human Metabolism. 8th edition. Wadsworth Publishing Co Inc. 2021.
Hammadah, Muhammad et al. “Prognostic value of elevated serum ceruloplasmin levels in patients with heart failure.” Journal of cardiac failure vol. 20,12 (2014): 946-52. doi:10.1016/j.cardfail.2014.08.001
Hordyjewska, Anna et al. “The many "faces" of copper in medicine and treatment.” Biometals : an international journal on the role of metal ions in biology, biochemistry, and medicine vol. 27,4 (2014): 611-21. doi:10.1007/s10534-014-9736-5
Huang, Lei et al. “Association between serum copper and heart failure: a meta-analysis.” Asia Pacific journal of clinical nutrition vol. 28,4 (2019): 761-769. doi:10.6133/apjcn.201912_28(4).0013
Lopez, Michael J., et al. “Biochemistry, Ceruloplasmin.” StatPearls, StatPearls Publishing, 13 December 2021.
Raymond, Janice L., et al. Krause and Mahan's Food & the Nutrition Care Process. Elsevier, 2021.
Tang, W H Wilson et al. “Clinical and genetic association of serum ceruloplasmin with cardiovascular risk.” Arteriosclerosis, thrombosis, and vascular biology vol. 32,2 (2012): 516-22. doi:10.1161/ATVBAHA.111.237040
Selenium, Serum
Selenium is a critical antioxidant micronutrient that mitigates oxidative stress, bolsters immune response, promotes cardiovascular health, and aids in the production of active T3 thyroid hormone and the antioxidant functions of glutathione. An insufficiency of selenium can increase oxidative stress, contribute to mercury toxicity, and increase the risk of cardiovascular disease, cancer, cognitive dysfunction, and certain diseases like Keshan and Kashin-Beck. Conversely, excessive selenium levels can lead to selenium toxicity, characterized by dermatitis, dyslipidemia, alopecia, and brittle hair and nails. Supplementation with selenomethionine can help maintain optimal selenium levels and support the effective functioning of selenoproteins and the thyroid gland. However, maintaining an appropriate balance is crucial as both low and high selenium levels are associated with health complications.
Standard Range: 63.00 – 160.00 µg/L (0.80 – 2.03 µmol/L)
The ODX Range: 70.00 – 121.00 µg/L (0.89 – 1.54 µmol/L)
OPTIMAL DX MEMBERS CLICK HERE for more information on Serum Selenium
References
Alehagen, Urban et al. “Supplementation with Selenium and Coenzyme Q10 Reduces Cardiovascular Mortality in Elderly with Low Selenium Status. A Secondary Analysis of a Randomised Clinical Trial.” PloS one vol. 11,7 e0157541. 1 Jul. 2016, doi:10.1371/journal.pone.0157541
Al-Mubarak, Ali A et al. “High selenium levels associate with reduced risk of mortality and new-onset heart failure: data from PREVEND.” European journal of heart failure vol. 24,2 (2022): 299-307. doi:10.1002/ejhf.2405
Avery, Joseph C, and Peter R Hoffmann. “Selenium, Selenoproteins, and Immunity.” Nutrients vol. 10,9 1203. 1 Sep. 2018, doi:10.3390/nu10091203
Combs, Gerald F Jr. “Biomarkers of selenium status.” Nutrients vol. 7,4 2209-36. 31 Mar. 2015, doi:10.3390/nu7042209
Combs, Gerald F Jr et al. “Determinants of selenium status in healthy adults.” Nutrition journal vol. 10 75. 18 Jul. 2011, doi:10.1186/1475-2891-10-75
Duntas, L H. “The Role of Iodine and Selenium in Autoimmune Thyroiditis.” Hormone and metabolic research = Hormon- und Stoffwechselforschung = Hormones et metabolisme vol. 47,10 (2015): 721-6. doi:10.1055/s-0035-1559631
Fairweather-Tait, Susan J et al. “Selenium in human health and disease.” Antioxidants & redox signaling vol. 14,7 (2011): 1337-83. doi:10.1089/ars.2010.3275
Flores-Mateo, Gemma et al. “Selenium and coronary heart disease: a meta-analysis.” The American journal of clinical nutrition vol. 84,4 (2006): 762-73. doi:10.1093/ajcn/84.4.762
Gropper, Sareen S.; Smith, Jack L.; Carr, Timothy P. Advanced Nutrition and Human Metabolism. 8th edition. Wadsworth Publishing Co Inc. 2021.
Hu, Yifang et al. “Effect of selenium on thyroid autoimmunity and regulatory T cells in patients with Hashimoto's thyroiditis: A prospective randomized-controlled trial.” Clinical and translational science vol. 14,4 (2021): 1390-1402. doi:10.1111/cts.12993
Hu, Xue Feng et al. “Circulating Selenium Concentration Is Inversely Associated With the Prevalence of Stroke: Results From the Canadian Health Measures Survey and the National Health and Nutrition Examination Survey.” Journal of the American Heart Association vol. 8,10 (2019): e012290. doi:10.1161/JAHA.119.012290
Huang, Yu-Qing et al. “Association of circulating selenium concentration with dyslipidemia: Results from the NHANES.” Journal of trace elements in medicine and biology : organ of the Society for Minerals and Trace Elements (GMS) vol. 58 (2020): 126438. doi:10.1016/j.jtemb.2019.126438
McCann, Joyce C, and Bruce N Ames. “Adaptive dysfunction of selenoproteins from the perspective of the triage theory: why modest selenium deficiency may increase risk of diseases of aging.” FASEB journal : official publication of the Federation of American Societies for Experimental Biology vol. 25,6 (2011): 1793-814. doi:10.1096/fj.11-180885
Nessel, Trevor A. and Vikas Gupta. “Selenium.” StatPearls, StatPearls Publishing, 3 April 2023.
Nève, J. “Physiological and nutritional importance of selenium.” Experientia vol. 47,2 (1991): 187-93. doi:10.1007/BF01945424
Rayman, Margaret P. “Selenium and human health.” Lancet (London, England) vol. 379,9822 (2012): 1256-68. doi:10.1016/S0140-6736(11)61452-9
Rayman, Margaret P et al. “Effect of long-term selenium supplementation on mortality: Results from a multiple-dose, randomised controlled trial.” Free radical biology & medicine vol. 127 (2018): 46-54. doi:10.1016/j.freeradbiomed.2018.02.015
Rayman, Margaret P. “Multiple nutritional factors and thyroid disease, with particular reference to autoimmune thyroid disease.” The Proceedings of the Nutrition Society vol. 78,1 (2019): 34-44. doi:10.1017/S0029665118001192
Santos, Jose R et al. “Nutritional status, oxidative stress and dementia: the role of selenium in Alzheimer's disease.” Frontiers in aging neuroscience vol. 6 206. 28 Aug. 2014, doi:10.3389/fnagi.2014.00206
Steinbrenner, Holger, and Helmut Sies. “Selenium homeostasis and antioxidant selenoproteins in brain: implications for disorders in the central nervous system.” Archives of biochemistry and biophysics vol. 536,2 (2013): 152-7. doi:10.1016/j.abb.2013.02.021
Selenium, RBC
Selenium is an essential trace mineral that supports various crucial functions including antioxidant activities, thyroid hormone metabolism, and immune system regulation. It is vital for the conversion of the thyroid hormone T4 into the more active T3, and maintaining adequate selenium levels is important for managing thyroid disorders such as Hashimoto’s and Graves' disease. However, measuring selenium levels can be tricky as factors like inflammation can reduce its concentration in serum or plasma; thus, measuring selenium in red blood cells (RBC) might offer a more stable assessment. Selenium supplementation can be beneficial but must be approached with caution due to potential adverse effects from excessive intake, including increased risks for certain chronic diseases and toxicity symptoms.
Standard Range: 120-300 µg/L (1.52 – 3.8 µmol/L)
The ODX Range: 135 - 255 µg/L (1.71 – 3.23 µmol/L)
OPTIMAL DX MEMBERS CLICK HERE for more information on RBC Selenium
References
Alehagen, Urban et al. “Supplementation with Selenium and Coenzyme Q10 Reduces Cardiovascular Mortality in Elderly with Low Selenium Status. A Secondary Analysis of a Randomised Clinical Trial.” PloS one vol. 11,7 e0157541. 1 Jul. 2016, doi:10.1371/journal.pone.0157541
Al-Mubarak, Ali A et al. “High selenium levels associate with reduced risk of mortality and new-onset heart failure: data from PREVEND.” European journal of heart failure vol. 24,2 (2022): 299-307. doi:10.1002/ejhf.2405
Avery, Joseph C, and Peter R Hoffmann. “Selenium, Selenoproteins, and Immunity.” Nutrients vol. 10,9 1203. 1 Sep. 2018, doi:10.3390/nu10091203
Berger, Mette M et al. “Pitfalls in the interpretation of blood tests used to assess and monitor micronutrient nutrition status.” Nutrition in clinical practice : official publication of the American Society for Parenteral and Enteral Nutrition vol. 38,1 (2023): 56-69. doi:10.1002/ncp.10924
Cardoso, Bárbara R et al. “Selenium Levels in Serum, Red Blood Cells, and Cerebrospinal Fluid of Alzheimer's Disease Patients: A Report from the Australian Imaging, Biomarker & Lifestyle Flagship Study of Ageing (AIBL).” Journal of Alzheimer's disease : JAD vol. 57,1 (2017): 183-193. doi:10.3233/JAD-160622
Costa, Nara Aline et al. “Erythrocyte selenium concentration predicts intensive care unit and hospital mortality in patients with septic shock: a prospective observational study.” Critical care (London, England) vol. 18,3 R92. 7 May. 2014, doi:10.1186/cc13860
Duntas, L H. “The Role of Iodine and Selenium in Autoimmune Thyroiditis.” Hormone and metabolic research = Hormon- und Stoffwechselforschung = Hormones et metabolisme vol. 47,10 (2015): 721-6. doi:10.1055/s-0035-1559631
El-Ansary, Afaf et al. “Relationship between selenium, lead, and mercury in red blood cells of Saudi autistic children.” Metabolic brain disease vol. 32,4 (2017): 1073-1080. doi:10.1007/s11011-017-9996-1
Fairweather-Tait, Susan J et al. “Selenium in human health and disease.” Antioxidants & redox signaling vol. 14,7 (2011): 1337-83. doi:10.1089/ars.2010.3275
Gropper, Sareen S.; Smith, Jack L.; Carr, Timothy P. Advanced Nutrition and Human Metabolism. 8th edition. Wadsworth Publishing Co Inc. 2021.
Hu, Xue Feng et al. “Circulating Selenium Concentration Is Inversely Associated With the Prevalence of Stroke: Results From the Canadian Health Measures Survey and the National Health and Nutrition Examination Survey.” Journal of the American Heart Association vol. 8,10 (2019): e012290. doi:10.1161/JAHA.119.012290
Huang, Yu-Qing et al. “Association of circulating selenium concentration with dyslipidemia: Results from the NHANES.” Journal of trace elements in medicine and biology : organ of the Society for Minerals and Trace Elements (GMS) vol. 58 (2020): 126438. doi:10.1016/j.jtemb.2019.126438
Maynar, M et al. “Erythrocyte concentrations of chromium, copper, manganese, molybdenum, selenium and zinc in subjects with different physical training levels.” Journal of the International Society of Sports Nutrition vol. 17,1 35. 9 Jul. 2020, doi:10.1186/s12970-020-00367-4
McCann, Joyce C, and Bruce N Ames. “Adaptive dysfunction of selenoproteins from the perspective of the triage theory: why modest selenium deficiency may increase risk of diseases of aging.” FASEB journal : official publication of the Federation of American Societies for Experimental Biology vol. 25,6 (2011): 1793-814. doi:10.1096/fj.11-180885
Miller, L et al. “Red blood cell and serum selenium concentrations as influenced by age and selected diseases.” Journal of the American College of Nutrition vol. 2,4 (1983): 331-41. doi:10.1080/07315724.1983.10719930
Rayman, Margaret P et al. “Effect of long-term selenium supplementation on mortality: Results from a multiple-dose, randomised controlled trial.” Free radical biology & medicine vol. 127 (2018): 46-54. doi:10.1016/j.freeradbiomed.2018.02.015
Rayman, Margaret P. “Multiple nutritional factors and thyroid disease, with particular reference to autoimmune thyroid disease.” The Proceedings of the Nutrition Society vol. 78,1 (2019): 34-44. doi:10.1017/S0029665118001192
Veldscholte, K et al. “Plasma and red blood cell concentrations of zinc, copper, selenium and magnesium in the first week of paediatric critical illness.” Clinical nutrition (Edinburgh, Scotland) vol. 43,2 (2024): 543-551. doi:10.1016/j.clnu.2024.01.004
Wasowicz, W, and B A Zachara. “Selenium concentrations in the blood and urine of a healthy Polish sub-population.” Journal of clinical chemistry and clinical biochemistry. Zeitschrift fur klinische Chemie und klinische Biochemie vol. 25,7 (1987): 409-12. doi:10.1515/cclm.1987.25.7.409
Iodine
Iodine, an essential nutrient, is primarily required for thyroid hormone production and fetal brain development and has antimicrobial properties. Inadequate iodine is linked to hypothyroidism, impaired fetal growth, and various developmental issues, while excess iodine can result in both hyperthyroidism and hypothyroidism, along with thyroid nodules. Dietary sources include seaweed, eggs, dairy foods, and iodized salt, but the intake should be balanced as certain foods, known as goitrogens (like raw cruciferous vegetables), can interfere with iodine metabolism. Importantly, radioactive iodine poses a risk for thyroid cancer, and high doses of iodine can be used to counteract this after nuclear exposure. For effective thyroid function, a balanced diet is required, including nutrients like tyrosine, selenium, zinc, copper, iron, and certain vitamins.
Standard Range: 52.00 – 109.00 µg/L (409.76 – 858.92 nmol/L)
The ODX Range: 52.00 – 80.00 µg/L (409.76 – 630.40 nmol/L)
OPTIMAL DX MEMBERS CLICK HERE for more information on Iodine
References
Babiker, Amir et al. “The role of micronutrients in thyroid dysfunction.” Sudanese journal of paediatrics vol. 20,1 (2020): 13-19. doi:10.24911/SJP.106-1587138942
Backer, H, and J Hollowell. “Use of iodine for water disinfection: iodine toxicity and maximum recommended dose.” Environmental health perspectives vol. 108,8 (2000): 679-84. doi:10.1289/ehp.00108679
Bajaj, Jagminder K et al. “Various Possible Toxicants Involved in Thyroid Dysfunction: A Review.” Journal of clinical and diagnostic research : JCDR vol. 10,1 (2016): FE01-3. doi:10.7860/JCDR/2016/15195.7092
Choi, Eun-Ji et al. “Determination of goitrogenic metabolites in the serum of male wistar rat fed structurally different glucosinolates.” Toxicological research vol. 30,2 (2014): 109-16. doi:10.5487/TR.2014.30.2.109
GREER, M A. “Goitrogenic substances in food.” The American journal of clinical nutrition vol. 5,4 (1957): 440-4. doi:10.1093/ajcn/5.4.440
Gropper, Sareen S.; Smith, Jack L.; Carr, Timothy P. Advanced Nutrition and Human Metabolism. 8th edition. Wadsworth Publishing Co Inc. 2021.
Gunnarsdottir, Ingibjörg, and Lisbeth Dahl. “Iodine intake in human nutrition: a systematic literature review.” Food & nutrition research vol. 56 (2012): 10.3402/fnr.v56i0.19731. doi:10.3402/fnr.v56i0.19731
Jin, Xing et al. “The application of serum iodine in assessing individual iodine status.” Clinical endocrinology vol. 87,6 (2017): 807-814. doi:10.1111/cen.13421
Ma, Zheng Feei, and Sheila A Skeaff. “Thyroglobulin as a biomarker of iodine deficiency: a review.” Thyroid : official journal of the American Thyroid Association vol. 24,8 (2014): 1195-209. doi:10.1089/thy.2014.0052
Mao, I F et al. “Electrolyte loss in sweat and iodine deficiency in a hot environment.” Archives of environmental health vol. 56,3 (2001): 271-7. doi:10.1080/00039890109604453
Yu, Songlin et al. “Establishing reference intervals for urine and serum iodine levels: A nationwide multicenter study of a euthyroid Chinese population.” Clinica chimica acta; international journal of clinical chemistry vol. 502 (2020): 34-40. doi:10.1016/j.cca.2019.11.038
Xu, Tingting et al. “Study on the Relationship Between Serum Iodine and Thyroid Dysfunctions: a Cross-Sectional Study.” Biological trace element research, 10.1007/s12011-022-03459-1. 2 Nov. 2022, doi:10.1007/s12011-022-03459-1
Zanzonico, P B, and D V Becker. “Effects of time of administration and dietary iodine levels on potassium iodide (KI) blockade of thyroid irradiation by 131I from radioactive fallout.” Health physics vol. 78,6 (2000): 660-7. doi:10.1097/00004032-200006000-00008
Zimmermann, Michael B et al. “Iodine-deficiency disorders.” Lancet (London, England) vol. 372,9645 (2008): 1251-62. doi:10.1016/S0140-6736(08)61005-3
Prostate-specific antigen (PSA) is a protein produced by the prostate gland and released into the bloodstream. Monitoring PSA levels can be important for the early detection and management of prostate conditions, including prostate cancer. PSA testing has become a standard tool in assessing prostate health and is often used alongside other diagnostic methods, such as digital rectal exams (DRE) and imaging studies.The primary importance of monitoring PSA levels lies in its ability to help detect prostate cancer at an early stage when treatment options are more effective and have better outcomes. Elevated PSA levels may indicate the presence of prostate cancer or other prostate-related conditions, such as benign prostatic hyperplasia (BPH) or prostatitis (inflammation of the prostate). However, it is important to note that elevated PSA levels are not definitive evidence of cancer, and further diagnostic testing is required to confirm the diagnosis.
Prostate-Specific Antigen (PSA, Total)
Prostate-Specific antigen (PSA) is a blood biomarker primarily used to screen for prostate cancer and monitor its progression in men. PSA is a protein produced by the prostate gland and released into the bloodstream in small amounts. Elevated PSA levels may indicate the presence of prostate cancer, although other conditions, such as prostatitis or benign prostatic hyperplasia, can also cause increased levels. Regular PSA testing, combined with other diagnostic methods, helps physicians detect and manage prostate cancer in its early stages, improving patient treatment outcomes.
OPTIMAL DX MEMBERS CLICK HERE for more information on Prostate-Specific Antigen (PSA, Total)
References
Crawford, E David et al. “An Approach Using PSA Levels of 1.5 ng/mL as the Cutoff for Prostate Cancer Screening in Primary Care.” Urology vol. 96 (2016): 116-120. doi:10.1016/j.urology.2016.07.001
Ilic, Dragan et al. “Prostate cancer screening with prostate-specific antigen (PSA) test: a systematic review and meta-analysis.” BMJ (Clinical research ed.) vol. 362 k3519. 5 Sep. 2018, doi:10.1136/bmj.k3519
Mohler, James et al. “NCCN clinical practice guidelines in oncology: prostate cancer.” Journal of the National Comprehensive Cancer Network : JNCCN vol. 8,2 (2010): 162-200. doi:10.6004/jnccn.2010.0012
Moradi, Afshin et al. “Beyond the biomarker role: prostate-specific antigen (PSA) in the prostate cancer microenvironment.” Cancer metastasis reviews vol. 38,3 (2019): 333-346. doi:10.1007/s10555-019-09815-3
Pagana, Kathleen Deska, et al. Mosby's Diagnostic and Laboratory Test Reference. 15th ed., Mosby, 2021.
Prcic, Alden et al. “Usefulness of Total PSA Value in Prostate Diseases Diagnosis.” Acta informatica medica : AIM : journal of the Society for Medical Informatics of Bosnia & Herzegovina : casopis Drustva za medicinsku informatiku BiH vol. 24,3 (2016): 156-61. doi:10.5455/aim.2016.24.156-161
Roehl, Kimberly A et al. “Robustness of free prostate specific antigen measurements to reduce unnecessary biopsies in the 2.6 to 4.0 ng./ml. range.” The Journal of urology vol. 168,3 (2002): 922-5. doi:10.1097/01.ju.0000024660.18328.2d
Proteins are essential nitrogen-containing macronutrients that play crucial roles in human health and metabolism. Amino acids are the building blocks of proteins, and proteins are the building blocks of various structures and molecular machinery within the body. They are involved in a wide range of physiological processes, making them vital for maintaining overall health and wellness. Key functions of proteins include structural support, mechanical strength, enzyme activity, hormone synthesis, transport, storage, immune function, muscle contraction, cell signaling, and serving as a potential source of energy if needed in times of fasting or low carbohydrate intake. Obtaining adequate protein through diet or supplementation is crucial for maintaining overall health and supporting the body's diverse physiological processes.
Protein, Total
Total protein, comprising albumin and globulins, is a significant biomarker that reflects functions such as the transport of enzymes, hormones, and drugs and the maintenance of fluid balance in blood vessels. Variations in total protein levels can indicate health conditions: lower levels may signify malnutrition, liver disease, or certain chronic disorders and can be influenced by certain medications, while elevated levels can indicate chronic inflammation, pregnancy, dehydration, or also be a result of certain medications. Therefore, maintaining a balanced total protein level is crucial for overall health and proper bodily function.
OPTIMAL DX MEMBERS CLICK HERE for more information on Protein, Total
References
Gounden, Verena, et al. “Hypoalbuminemia.” StatPearls, StatPearls Publishing, 28 August 2023.
Henok, Josephine N et al. “Analysis of Reference Ranges of Total Serum Protein in Namibia: Clinical Implications.” Proteomes vol. 8,2 7. 15 Apr. 2020, doi:10.3390/proteomes8020007
Keller, Ulrich. “Nutritional Laboratory Markers in Malnutrition.” Journal of clinical medicine vol. 8,6 775. 31 May. 2019, doi:10.3390/jcm8060775
Medline Plus. Total Protein. https://medlineplus.gov/ency/article/003483.htm
Pagana, Kathleen Deska, et al. Mosby's Diagnostic and Laboratory Test Reference. 15th ed., Mosby, 2021.
Samanta, Sumeru et al. “Significance of Total Protein, Albumin, Globulin, Serum Effusion Albumin Gradient and LDH in the Differential Diagnosis of Pleural Effusion Secondary to Tuberculosis and Cancer.” Journal of clinical and diagnostic research : JCDR vol. 10,8 (2016): BC14-8. doi:10.7860/JCDR/2016/20652.8379
Zhang, Zhiying et al. “Evaluation of Blood Biomarkers Associated with Risk of Malnutrition in Older Adults: A Systematic Review and Meta-Analysis.” Nutrients vol. 9,8 829. 3 Aug. 2017, doi:10.3390/nu9080829
Albumin
Albumin, produced by the liver, is the most abundant protein in the blood, playing key roles in nutrient transportation, hormone delivery, and maintaining blood vessel fluid balance and acid-base balance. Lowered albumin levels may be associated with liver disease, inflammation, heart disease, diabetes, cognitive decline, Alzheimer's, or malnutrition, and these levels can compromise albumin's antioxidant, anti-inflammatory, and anticoagulant effects. Systemic inflammation can further reduce albumin synthesis while increasing its degradation. Optimal albumin levels are linked to decreased surgical complications and improved survival rates in both hospitalized patients and healthy adults. However, elevated levels might suggest dehydration.
Standard Range: 3.60 - 5.10 g/dL (36.00 - 51.00 g/L)
The ODX Range: 4.50 – 5.00 g/dL (45.00 – 50.00 g/L)
OPTIMAL DX MEMBERS CLICK HERE for more information on Albumin
References
Akirov, Amit et al. “Low Albumin Levels Are Associated with Mortality Risk in Hospitalized Patients.” The American journal of medicine vol. 130,12 (2017): 1465.e11-1465.e19. doi:10.1016/j.amjmed.2017.07.020
Alsancak, Yakup, et al. "Role of calcium–albumin ratio in severity of coronary artery disease assessed by angiographic SYNTAX score." Archives of Clinical and Experimental Medicine 3.3 (2018): 174-178.
Arques, Stephane. “Human serum albumin in cardiovascular diseases.” European journal of internal medicine vol. 52 (2018): 8-12. doi:10.1016/j.ejim.2018.04.014
Bendersky, Victoria et al. “Determining the Optimal Quantitative Threshold for Preoperative Albumin Level Before Elective Colorectal Surgery.” Journal of gastrointestinal surgery : official journal of the Society for Surgery of the Alimentary Tract vol. 21,4 (2017): 692-699. doi:10.1007/s11605-017-3370-9
Danesh, J et al. “Association of fibrinogen, C-reactive protein, albumin, or leukocyte count with coronary heart disease: meta-analyses of prospective studies.” JAMA vol. 279,18 (1998): 1477-82. doi:10.1001/jama.279.18.1477
Fulks M, Stout RL, Dolan VF. Albumin and all‐cause mortality risk in insurance applicants. J Insur Med. 2010;42: 11–17.
Gounden, Verena, et al. “Hypoalbuminemia.” StatPearls, StatPearls Publishing, 28 August 2023.
Keller, Ulrich. “Nutritional Laboratory Markers in Malnutrition.” Journal of clinical medicine vol. 8,6 775. 31 May. 2019, doi:10.3390/jcm8060775
Kim, Jee Wook et al. “Serum albumin and beta-amyloid deposition in the human brain.” Neurology vol. 95,7 (2020): e815-e826. doi:10.1212/WNL.0000000000010005
Li, Qian et al. “Abnormally low serum albumin levels are associated with abnormal bone mineral density and osteoporotic fractures: a retrospective studies.” BMC musculoskeletal disorders vol. 25,1 888. 7 Nov. 2024, doi:10.1186/s12891-024-08021-9
Llewellyn, D J et al. “Serum albumin concentration and cognitive impairment.” Current Alzheimer research vol. 7,1 (2010): 91-6. doi:10.2174/156720510790274392
Malavolta, Marco et al. “Serum copper to zinc ratio: Relationship with aging and health status.” Mechanisms of ageing and development vol. 151 (2015): 93-100. doi:10.1016/j.mad.2015.01.004
Min, Jin-Young et al. “Chronic Status of Serum Albumin and Cognitive Function: A Retrospective Cohort Study.” Journal of clinical medicine vol. 11,3 822. 3 Feb. 2022, doi:10.3390/jcm11030822
Noh, Eul et al. “The clinical role of serum albumin in Organophospate poisoning.” Basic & clinical pharmacology & toxicology vol. 128,4 (2021): 605-614. doi:10.1111/bcpt.13546
Pagana, Kathleen Deska, et al. Mosby's Diagnostic and Laboratory Test Reference. 15th ed., Mosby, 2021.
Sitar, Mustafa Erinç et al. “Human serum albumin and its relation with oxidative stress.” Clinical laboratory vol. 59,9-10 (2013): 945-52
Globulin, Total
Total globulin reflects non-albumin proteins in the blood, including antibodies and non-albumin transport proteins such as lipoproteins, ceruloplasmin, and transferrin. A decrease in total globulin can indicate an immune deficiency or lead poisoning, while high levels can result from infection, inflammation, vascular disorders, liver disease, IBD, or gammopathies like multiple myeloma. Known as the "gamma gap," an increase in total globulin levels can signal a systemic inflammation marker and increase mortality risk, especially from pulmonary causes. However, measuring serum globulin levels can help in the early identification of antibody deficiency disorders. Conversely, lead poisoning is often associated with decreased globulin levels.
Standard Range: 1.9 - 3.70 g/dL (19.00 – 37.00 g/L)
The ODX Range: 2.40 – 2.80 g/dL (24.00 – 28.00 g/L)
OPTIMAL DX MEMBERS CLICK HERE for more information on Total Globulin
References
Gropper, Sareen S.; Smith, Jack L.; Carr, Timothy P. Advanced Nutrition and Human Metabolism. 8th edition. Wadsworth Publishing Co Inc. 2021.
Fulks, Michael et al. “Serum globulin predicts all-cause mortality for life insurance applicants.” Journal of insurance medicine (New York, N.Y.) vol. 44,2 (2014): 93-8.
Hanif, Farina Mohammed et al. “An unusual presentation of Ménétrier's Disease.” Journal of the College of Physicians and Surgeons--Pakistan : JCPSP vol. 24 Suppl 3 (2014): S183-5.
Hashash, Jana G et al. “Elevated serum globulin fraction as a biomarker of multiyear disease severity in inflammatory bowel disease.” Annals of gastroenterology vol. 35,6 (2022): 609-617. doi:10.20524/aog.2022.0748
Juraschek, Stephen P et al. “The Gamma Gap and All-Cause Mortality.” PloS one vol. 10,12 e0143494. 2 Dec. 2015, doi:10.1371/journal.pone.0143494
Kalahasthi, Ravibabu, et al. "Assessment of diagnostic accuracy and optimal cut points of blood lead levels on serum proteins among workers exposed to Pb at a lead battery plant." Int J Med Biochem 2.3 (2019): 81-7.
Liu, He et al. “Helicobacter pylori Infection as a Risk Factor for Abnormal Serum Protein Levels in General Population of China.” Journal of inflammation research vol. 15 2009-2017. 26 Mar. 2022, doi:10.2147/JIR.S355446
Pagana, Kathleen Deska, et al. Mosby's Diagnostic and Laboratory Test Reference. 15th ed., Mosby, 2021.
Pecoraro, Antonio et al. “Validation of Calculated Globulin (CG) as a Screening Test for Antibody Deficiency in an Italian University Hospital.” Current pharmaceutical biotechnology vol. 19,9 (2018): 728-733. doi:10.2174/1389201019666180808163311
Schubert, Mitchell L, and David A Peura. “Control of gastric acid secretion in health and disease.” Gastroenterology vol. 134,7 (2008): 1842-60. doi:10.1053/j.gastro.2008.05.021
Yang, Ming et al. “The gamma gap predicts 4-year all-cause mortality among nonagenarians and centenarians.” Scientific reports vol. 8,1 1046. 18 Jan. 2018, doi:10.1038/s41598-018-19534-4
Ye, Yongyu et al. “Serum globulin and albumin to globulin ratio as potential diagnostic biomarkers for periprosthetic joint infection: a retrospective review.” Journal of orthopaedic surgery and research vol. 15,1 459. 7 Oct. 2020, doi:10.1186/s13018-020-01959-1
Albumin Globulin Ratio
The albumin to globulin (A/G) ratio is a valuable tool for evaluating alterations in serum protein levels, reflecting changes in liver function, infection, inflammation, and acute illness prognosis. A lower A/G ratio is commonly associated with liver disease, chronic inflammation, infection, cognitive decline, osteoporosis, and rheumatoid arthritis. A higher A/G ratio may indicate dehydration. This ratio becomes critical in assessing conditions like rheumatoid arthritis and osteoporosis and in predicting survival in acute illnesses like ischemic stroke and metastatic gastric cancer. A better cognitive function is also associated with a higher A/G ratio, shedding light on the possible role of chronic inflammation in cognitive decline.
Standard Range: 1.00 – 2.50 Ratio
The ODX Range: 1.40 – 2.10 Ratio
OPTIMAL DX MEMBERS CLICK HERE for more information on Albumin Globulin Ratio
References
Chen, Yong et al. “Albumin/Globulin Ratio as Yin-Yang in Rheumatoid Arthritis and Its Correlation to Inflamm-Aging Cytokines.” Journal of inflammation research vol. 14 5501-5511. 27 Oct. 2021, doi:10.2147/JIR.S335671
Du, Yuan-Zhuo et al. “The association between serum albumin-globulin ratio and overactive bladder in American adults: a cross-sectional study.” European journal of medical research vol. 30,1 229. 2 Apr. 2025, doi:10.1186/s40001-025-02441-6
Pagana, Kathleen Deska, et al. Mosby's Diagnostic and Laboratory Test Reference. 15th ed., Mosby, 2021.
Furukawa, Kayoko, et al. "Correlation of albumin/globulin ratio with forearm bone mineral density in women above 50 years of age." HAND 11.1_suppl (2016): 49S-49S.
Koyama, Teruhide et al. “Serum albumin to globulin ratio is related to cognitive decline via reflection of homeostasis: a nested case-control study.” BMC neurology vol. 16,1 253. 8 Dec. 2016, doi:10.1186/s12883-016-0776-z
Liu, Bin et al. “Albumin-Globulin Ratio Is an Independent Determinant of 28-Day Mortality in Patients with Critical Illness.” Disease markers vol. 2021 9965124. 25 Aug. 2021, doi:10.1155/2021/9965124
Maeda, Satomi et al. “Serum albumin/globulin ratio is associated with cognitive function in community-dwelling older people: The Septuagenarians, Octogenarians, Nonagenarians Investigation with Centenarians study.” Geriatrics & gerontology international vol. 19,10 (2019): 967-971. doi:10.1111/ggi.13751
Ranjit, Patil, and Raghuwanshi Uplabdhi. "Serum protein, albumin, globulin levels, and A/G ratio in HIV positive patients." Biomedical & Pharmacology Journal 2.2 (2009): 321-325.
Yang, Dehao et al. “Elevated Albumin to Globulin Ratio on Day 7 is Associated with Improved Function Outcomes in Acute Ischemic Stroke Patients with Intravenous Thrombolysis.” Journal of inflammation research vol. 15 2695-2705. 26 Apr. 2022, doi:10.2147/JIR.S347026
Ye, Yongyu et al. “Serum globulin and albumin to globulin ratio as potential diagnostic biomarkers for periprosthetic joint infection: a retrospective review.” Journal of orthopaedic surgery and research vol. 15,1 459. 7 Oct. 2020, doi:10.1186/s13018-020-01959-1
Zan, Yichen et al. “Differential associations of serum globulin and albumin-globulin ratio with depression in cancer and non-cancer populations: a cross-sectional study.” Frontiers in psychiatry vol. 16 1523060. 10 Apr. 2025, doi:10.3389/fpsyt.2025.1523060
Zhang, Jia et al. “Clinical Significance of Serum Albumin/Globulin Ratio in Patients With Pyogenic Liver Abscess.” Frontiers in surgery vol. 8 677799. 30 Nov. 2021, doi:10.3389/fsurg.2021.677799
NT-proBNP
N-terminal pro-brain natriuretic peptide (NT-proBNP) is an inactive fragment that is produced and released by heart cells under stress, typically when there is increased volume or pressure within the heart's chambers. Elevated levels of NT-proBNP often signal conditions such as congestive heart failure, cardiovascular disease, hypertension, and other cardiac complications. However, levels also increase naturally with age and are generally higher in women than men. A low NT-proBNP level typically suggests a low risk of heart failure. Despite its diagnostic value, the usefulness of NT-proBNP can be diminished in conditions like obesity, anemia, and renal insufficiency.
Standard Range: 0.00 – 125.00 pg/mL
The ODX Range: 0.00 – 125.00 pg/mL
OPTIMAL DX MEMBERS CLICK HERE for more information on NT-proBNP
References
Cao, Zhipeng et al. “BNP and NT-proBNP as Diagnostic Biomarkers for Cardiac Dysfunction in Both Clinical and Forensic Medicine.” International journal of molecular sciences vol. 20,8 1820. 12 Apr. 2019, doi:10.3390/ijms20081820
Hussain, Aliza et al. “Association of NT-ProBNP, Blood Pressure, and Cardiovascular Events: The ARIC Study.” Journal of the American College of Cardiology vol. 77,5 (2021): 559-571. doi:10.1016/j.jacc.2020.11.063
NT-proB-type Natriuretic Peptide. Cleveland Clinic. https://my.clevelandclinic.org/health/diagnostics/16814-nt-prob-type-natriuretic-peptide-bnp
Pagana, Kathleen Deska, et al. Mosby's Diagnostic and Laboratory Test Reference. 15th ed., Mosby, 2021.
Palazzuoli, A et al. “Natriuretic peptides (BNP and NT-proBNP): measurement and relevance in heart failure.” Vascular health and risk management vol. 6 411-8. 1 Jun. 2010, doi:10.2147/vhrm.s5789
Rudolf, Henrik et al. “NT-proBNP for risk prediction of cardiovascular events and all-cause mortality: The getABI-study.” International journal of cardiology. Heart & vasculature vol. 29 100553. 5 Jun. 2020, doi:10.1016/j.ijcha.2020.100553
Tcheugui, Justin Basile et al. “Elevated NT-ProBNP as a Cardiovascular Disease Risk Equivalent: Evidence from the Atherosclerosis Risk in Communities (ARIC) Study.” The American journal of medicine, S0002-9343(22)00572-1. 23 Aug. 2022, doi:10.1016/j.amjmed.2022.07.012
Wang, Lan et al. “Association between NT-proBNP Level and the Severity of COVID-19 Pneumonia.” Cardiology research and practice vol. 2021 5537275. 8 Jul. 2021, doi:10.1155/2021/5537275
Welsh, Paul et al. “Reference Ranges for NT-proBNP (N-Terminal Pro-B-Type Natriuretic Peptide) and Risk Factors for Higher NT-proBNP Concentrations in a Large General Population Cohort.” Circulation. Heart failure vol. 15,10 (2022): e009427. doi:10.1161/CIRCHEARTFAILURE.121.009427
Start creating true practice success. An Optimal DX account will help you deliver insights into your patient’s health and generate intuitive, comprehensive Functional Health Reports and customer blood test-specific treatment plans.
Thyroid blood biomarkers and antibodies are essential tools for assessing thyroid function, diagnosing thyroid disorders, and monitoring the effectiveness of treatment. The thyroid gland is responsible for producing thyroid hormones, which play a critical role in regulating metabolism, growth, development, and energy balance. Abnormal thyroid function can lead to various health issues, such as hypothyroidism, hyperthyroidism, autoimmune thyroid diseases, and thyroid cancer. TSH, T3, reverse T3, and T4 are crucial for evaluating thyroid function and identifying conditions like hypothyroidism and hyperthyroidism. TPOAb and TgAb are important for diagnosing autoimmune thyroid diseases, while Tg serves as a tumor marker for differentiated thyroid cancer.
Thyroid-Stimulating Hormone (TSH)
Thyroid-stimulating hormone (TSH), also called thyrotropin, is a blood biomarker used to assess thyroid function and diagnose thyroid disorders. The pituitary gland produces TSH and regulates thyroid hormone production, which is essential for metabolism, growth, and development. Low TSH is associated with hyperthyroidism, pituitary hypofunction, and certain medications. An elevated TSH is associated with hypothyroidism, thyroid inflammation, excess iodine, and chronic or severe illness.
References
Ali, Athar, et al. "Relationship between the levels of serum thyroid hormones and the risk of breast cancer." J Biol Agr Healthc 2 (2011): 56-60.
Biondi, Bernadette. “The normal TSH reference range: what has changed in the last decade?.” The Journal of clinical endocrinology and metabolism vol. 98,9 (2013): 3584-7. doi:10.1210/jc.2013-2760
Biondi, Bernadette, and David S Cooper. “Thyroid hormone therapy for hypothyroidism.” Endocrine vol. 66,1 (2019): 18-26. doi:10.1007/s12020-019-02023-7
Chang, Yi-Cheng et al. “High TSH Level within Normal Range Is Associated with Obesity, Dyslipidemia, Hypertension, Inflammation, Hypercoagulability, and the Metabolic Syndrome: A Novel Cardiometabolic Marker.” Journal of clinical medicine vol. 8,6 817. 7 Jun. 2019, doi:10.3390/jcm8060817
Cohen, Bruce M et al. “Antidepressant-Resistant Depression in Patients With Comorbid Subclinical Hypothyroidism or High-Normal TSH Levels.” The American journal of psychiatry vol. 175,7 (2018): 598-604. doi:10.1176/appi.ajp.2017.17080949
Golbert, Lenara et al. “Serum TSH levels as a predictor of malignancy in thyroid nodules: A prospective study.” PloS one vol. 12,11 e0188123. 16 Nov. 2017, doi:10.1371/journal.pone.0188123
Inoue, Kosuke et al. “Association of Subclinical Hypothyroidism and Cardiovascular Disease With Mortality.” JAMA network open vol. 3,2 e1920745. 5 Feb. 2020, doi:10.1001/jamanetworkopen.2019.20745
Pagana, Kathleen Deska, et al. Mosby's Diagnostic and Laboratory Test Reference. 15th ed., Mosby, 2021.
Sheehan, Michael T. “Biochemical Testing of the Thyroid: TSH is the Best and, Oftentimes, Only Test Needed - A Review for Primary Care.” Clinical medicine & research vol. 14,2 (2016): 83-92. doi:10.3121/cmr.2016.1309
Subekti, Imam et al. “Serum TSH level as predictor of Graves' disease recurrence following antithyroid drug withdrawal: A systematic review.” PloS one vol. 16,1 e0245978. 29 Jan. 2021, doi:10.1371/journal.pone.0245978
Teng, Weiping et al. “Effect of iodine intake on thyroid diseases in China.” The New England journal of medicine vol. 354,26 (2006): 2783-93. doi:10.1056/NEJMoa054022 Vanderpump, M P et al. “The incidence of thyroid disorders in the community: a twenty-year follow-up of the Whickham Survey.” Clinical endocrinology vol. 43,1 (1995): 55-68. doi:10.1111/j.1365-2265.1995.tb01894.x
Yeap, Bu B et al. “Reference Ranges for Thyroid-Stimulating Hormone and Free Thyroxine in Older Men: Results From the Health In Men Study.” The journals of gerontology. Series A, Biological sciences and medical sciences vol. 72,3 (2017): 444-449. doi:10.1093/gerona/glw132
T4 (Thyroxine), Total
Thyroxine (T4), the main hormone secreted by the thyroid gland, plays a crucial role in metabolism as the precursor to active thyroid hormone (T3), which affects every cell in the body in the body. Imbalances in T4 levels can indicate various health conditions: low T4 levels are associated with hypothyroidism, decreased energy expenditure, weight gain, and increased cholesterol, while high T4 levels suggest hyperthyroidism, increased energy expenditure, weight loss, and decreased cholesterol. Total T4 measurements include both bound and free T4, with free T4 being a more accurate reflection of thyroid status. Factors such as pregnancy or certain medications can affect T4 levels. Additionally, sufficient micronutrients are necessary for optimal thyroid function, emphasizing the importance of optimal nutrition status.
Standard Range: 4.50 – 12.00 µg/dL (57.92 – 154.44 nmol/L)
The ODX Range: 6.00 – 11.90 µg/dL (77.22 – 153.15 nmol/L)
OPTIMAL DX MEMBERS CLICK HERE for more information on Total T4
References
Choi, Sohyeon et al. “Thyroxine-binding globulin, peripheral deiodinase activity, and thyroid autoantibody status in association of phthalates and phenolic compounds with thyroid hormones in adult population.” Environment international vol. 140 (2020): 105783. doi:10.1016/j.envint.2020.105783
Ettleson, Matthew D, and Antonio C Bianco. “Individualized Therapy for Hypothyroidism: Is T4 Enough for Everyone?.” The Journal of clinical endocrinology and metabolism vol. 105,9 (2020): e3090–e3104. doi:10.1210/clinem/dgaa430
Fortenberry, Gamola Z et al. “Association between urinary 3, 5, 6-trichloro-2-pyridinol, a metabolite of chlorpyrifos and chlorpyrifos-methyl, and serum T4 and TSH in NHANES 1999-2002.” The Science of the total environment vol. 424 (2012): 351-5. doi:10.1016/j.scitotenv.2012.02.039
Institute of Medicine (US) Committee on Medicare Coverage of Routine Thyroid Screening; Stone MB, Wallace RB, editors. Medicare Coverage of Routine Screening for Thyroid Dysfunction. Washington (DC): National Academies Press (US); 2003. APPENDIX B, Screening for Thyroid Disease: Systematic Evidence Review. Available from: https://www.ncbi.nlm.nih.gov/books/NBK221542/
Kobayashi, Ryohei, et al. "Thyroid function in patients with selenium deficiency exhibits high free T4 to T3 ratio." Clinical Pediatric Endocrinology 30.1 (2021): 19-26.
Moura Neto, Arnaldo, and Denise Engelbrecht Zantut-Wittmann. “Abnormalities of Thyroid Hormone Metabolism during Systemic Illness: The Low T3 Syndrome in Different Clinical Settings.” International journal of endocrinology vol. 2016 (2016): 2157583. doi:10.1155/2016/2157583
Mullur, Rashmi et al. “Thyroid hormone regulation of metabolism.” Physiological reviews vol. 94,2 (2014): 355-82. doi:10.1152/physrev.00030.2013
O'Kane, S Maria et al. “Micronutrients, iodine status and concentrations of thyroid hormones: a systematic review.” Nutrition reviews vol. 76,6 (2018): 418-431. doi:10.1093/nutrit/nuy008
Pagana, Kathleen Deska, et al. Mosby's Diagnostic and Laboratory Test Reference. 15th ed., Mosby, 2021.
Peeters, Robin P, and Theo J Visser. “Metabolism of Thyroid Hormone.” Endotext, edited by Kenneth R Feingold et. al., MDText.com, Inc., 1 January 2017.
T4, Free
Free thyroxine (FT4), unbound to protein carriers, offers a more accurate reflection of thyroid status than total T4. Low FT4 could signify hypothyroidism, iodine insufficiency, or the effect of certain medications, while high FT4 can indicate hyperthyroidism, thyroid cancer, or again, the influence of certain drugs. Notably, the impact of FT4 extends beyond thyroid health, with evidence linking abnormal levels to cognitive decline, cardiovascular disease, and even breast cancer. While total T4 levels can be skewed by factors like protein levels, stressors, and aging, FT4 provides a clearer, more stable indicator of thyroid function. Therefore, FT4 measurements can be crucial in assessing various health risks and conditions.
Standard Range: 0.80 – 1.80 ng/dL (10.30 – 23.17 pmol/L)
The ODX Range: 1.00 – 1.50 ng/dL (12.87 – 19.30 pmol/L)
References
Abbey, Enoch J et al. “Free Thyroxine Distinguishes Subclinical Hypothyroidism From Other Aging-Related Changes in Those With Isolated Elevated Thyrotropin.” Frontiers in endocrinology vol. 13 858332. 4 Mar. 2022, doi:10.3389/fendo.2022.858332
Ali, Athar, et al. "Relationship between the levels of serum thyroid hormones and the risk of breast cancer." J Biol Agr Healthc 2 (2011): 56-60.
Ataoglu, Hayriye Esra et al. “Prognostic significance of high free T4 and low free T3 levels in non-thyroidal illness syndrome.” European journal of internal medicine vol. 57 (2018): 91-95. doi:10.1016/j.ejim.2018.07.018
Cappola, Anne R et al. “Thyroid function in the euthyroid range and adverse outcomes in older adults.” The Journal of clinical endocrinology and metabolism vol. 100,3 (2015): 1088-96. doi:10.1210/jc.2014-3586
Chaker, Layal et al. “Defining Optimal Health Range for Thyroid Function Based on the Risk of Cardiovascular Disease.” The Journal of clinical endocrinology and metabolism vol. 102,8 (2017): 2853-2861. doi:10.1210/jc.2017-00410
Koulouri, Olympia, and Mark Gurnell. “How to interpret thyroid function tests.” Clinical medicine (London, England) vol. 13,3 (2013): 282-6. doi:10.7861/clinmedicine.13-3-282
Lei, Zhengwu et al. “Free triiodothyronine and free thyroxine hormone levels in relation to breast cancer risk: a meta-analysis.” Endokrynologia Polska vol. 73,2 (2022): 309-315. doi:10.5603/EP.a2022.0020
Pagana, Kathleen Deska, et al. Mosby's Diagnostic and Laboratory Test Reference. 15th ed., Mosby, 2021.
Park, So Young et al. “Age- and gender-specific reference intervals of TSH and free T4 in an iodine-replete area: Data from Korean National Health and Nutrition Examination Survey IV (2013-2015).” PloS one vol. 13,2 e0190738. 1 Feb. 2018, doi:10.1371/journal.pone.0190738
Simonsick, Eleanor M et al. “Free Thyroxine and Functional Mobility, Fitness, and Fatigue in Euthyroid Older Men and Women in the Baltimore Longitudinal Study of Aging.” The journals of gerontology. Series A, Biological sciences and medical sciences vol. 71,7 (2016): 961-7. doi:10.1093/gerona/glv226
Yeap, Bu B et al. “Reference Ranges for Thyroid-Stimulating Hormone and Free Thyroxine in Older Men: Results From the Health In Men Study.” The journals of gerontology. Series A, Biological sciences and medical sciences vol. 72,3 (2017): 444-449. doi:10.1093/gerona/glw132
T3 (Triiodothyronine), Total
Triiodothyronine (T3) is the active form of thyroid hormone, with most of it bound to proteins and a small fraction circulating freely. While the thyroid produces a small portion, most of the body's T3 is generated in various tissues. Low levels can be linked to hypothyroidism, iodine or selenium deficiency, liver or kidney disease, or certain medications, whereas high levels may indicate hyperthyroidism, pregnancy, inflammation, or the influence of certain drugs. Notably, total T3 levels can also be linked to cravings for alcohol and conditions like heart disease and stroke. Factors like liver and kidney function, nutrition status, heavy metal exposure, and lifestyle habits, including smoking and alcohol intake, can influence T3 status.
Standard Range: 76.00 – 181.00 ng/dL (1.17 – 2.79 nmol/L)
The ODX Range: 90.00 – 168.00 ng/dL (1.39 – 2.59 nmol/L)
OPTIMAL DX MEMBERS CLICK HERE for more information on Total T3
References
Abdalla, Sherine M, and Antonio C Bianco. “Defending plasma T3 is a biological priority.” Clinical endocrinology vol. 81,5 (2014): 633-41. doi:10.1111/cen.12538
Afrifa, Justice et al. “Variation in thyroid hormone levels is associated with elevated blood mercury levels among artisanal small-scale miners in Ghana.” PloS one vol. 13,8 e0203335. 30 Aug. 2018, doi:10.1371/journal.pone.0203335
Alevizaki, M et al. “Low triiodothyronine: a strong predictor of outcome in acute stroke patients.” European journal of clinical investigation vol. 37,8 (2007): 651-7. doi:10.1111/j.1365-2362.2007.01839.x
Carrero, J J et al. “Clinical and biochemical implications of low thyroid hormone levels (total and free forms) in euthyroid patients with chronic kidney disease.” Journal of internal medicine vol. 262,6 (2007): 690-701. doi:10.1111/j.1365-2796.2007.01865.x
Chen, Xinxin et al. “Diagnostic Values of Free Triiodothyronine and Free Thyroxine and the Ratio of Free Triiodothyronine to Free Thyroxine in Thyrotoxicosis.” International journal of endocrinology vol. 2018 4836736. 4 Jun. 2018, doi:10.1155/2018/483673
Choi, Sohyeon et al. “Thyroxine-binding globulin, peripheral deiodinase activity, and thyroid autoantibody status in association of phthalates and phenolic compounds with thyroid hormones in adult population.” Environment international vol. 140 (2020): 105783. doi:10.1016/j.envint.2020.105783
Drutel, Anne, Françoise Archambeaud, and Philippe Caron. "Selenium and the Thyroid Gland." Clin Endocrinol 78.2 (2013): 155-164.
Moura Neto, Arnaldo, and Denise Engelbrecht Zantut-Wittmann. “Abnormalities of Thyroid Hormone Metabolism during Systemic Illness: The Low T3 Syndrome in Different Clinical Settings.” International journal of endocrinology vol. 2016 (2016): 2157583. doi:10.1155/2016/2157583
McGregor, Brock. "Extra-Thyroidal Factors Impacting Thyroid Hormone Homeostasis." Journal of Restorative Medicine 4.1 (2015): 40-49.
Pagana, Kathleen Deska, et al. Mosby's Diagnostic and Laboratory Test Reference. 15th ed., Mosby, 2021.
Raymond, Janice L., et al. Krause and Mahan's Food & the Nutrition Care Process. Elsevier, 2021.
T3 (Triiodothyronine), Free
Free T3 (FT3) is the most biologically active thyroid hormone and serves as a crucial marker for monitoring the progress and symptoms of hypothyroidism. Low FT3 may signify conditions like euthyroid sick syndrome, calorie deprivation, heart failure, liver disease, or diabetes, whereas high FT3 may suggest hyperthyroidism, Graves' disease, or decreased lean body mass. The essential nutrients iodine, selenium, and zinc are required for thyroid hormone metabolism. Lower FT3 levels may correlate with severe COVID-19 and increased all-cause mortality. Additionally, an association has been found between higher FT3 levels and markers of metabolic dysfunction, such as higher BMI, increased insulin resistance, and lower muscle mass.
Standard Range: 2.30 – 4.20 pg/mL (3.53 – 6.45 pmol/L)
The ODX Range: 3.00 – 3.50 pg/mL (4.61 – 5.38 pmol/L)
OPTIMAL DX MEMBERS CLICK HERE for more information on Free T3
References
Abdalla, Sherine M, and Antonio C Bianco. “Defending plasma T3 is a biological priority.” Clinical endocrinology vol. 81,5 (2014): 633-41. doi:10.1111/cen.12538
Ali, Athar, et al. "Relationship between the levels of serum thyroid hormones and the risk of breast cancer." J Biol Agr Healthc 2 (2011): 56-60.
Ataoglu, Hayriye Esra et al. “Prognostic significance of high free T4 and low free T3 levels in non-thyroidal illness syndrome.” European journal of internal medicine vol. 57 (2018): 91-95. doi:10.1016/j.ejim.2018.07.018
Chen, Xinxin et al. “Diagnostic Values of Free Triiodothyronine and Free Thyroxine and the Ratio of Free Triiodothyronine to Free Thyroxine in Thyrotoxicosis.” International journal of endocrinology vol. 2018 4836736. 4 Jun. 2018, doi:10.1155/2018/4836736
Choi, Sohyeon et al. “Thyroxine-binding globulin, peripheral deiodinase activity, and thyroid autoantibody status in association of phthalates and phenolic compounds with thyroid hormones in adult population.” Environment international vol. 140 (2020): 105783. doi:10.1016/j.envint.2020.105783
Ettleson, Matthew D, and Antonio C Bianco. “Individualized Therapy for Hypothyroidism: Is T4 Enough for Everyone?.” The Journal of clinical endocrinology and metabolism vol. 105,9 (2020): e3090–e3104. doi:10.1210/clinem/dgaa430
Ganesan, Kavitha. and Khurram Wadud. “Euthyroid Sick Syndrome.” StatPearls, StatPearls Publishing, 30 October 2021.
Garber, Jeffrey R et al. “Clinical practice guidelines for hypothyroidism in adults: cosponsored by the American Association of Clinical Endocrinologists and the American Thyroid Association.” Endocrine practice : official journal of the American College of Endocrinology and the American Association of Clinical Endocrinologists vol. 18,6 (2012): 988-1028. doi:10.4158/EP12280.GL
Kobayashi, Ryohei et al. “Thyroid function in patients with selenium deficiency exhibits high free T4 to T3 ratio.” Clinical pediatric endocrinology : case reports and clinical investigations : official journal of the Japanese Society for Pediatric Endocrinology vol. 30,1 (2021): 19-26. doi:10.1297/cpe.30.19
Koulouri, Olympia, and Mark Gurnell. “How to interpret thyroid function tests.” Clinical medicine (London, England) vol. 13,3 (2013): 282-6. doi:10.7861/clinmedicine.13-3-282
Larisch, Rolf et al. “Symptomatic Relief is Related to Serum Free Triiodothyronine Concentrations during Follow-up in Levothyroxine-Treated Patients with Differentiated Thyroid Cancer.” Experimental and clinical endocrinology & diabetes : official journal, German Society of Endocrinology [and] German Diabetes Association vol. 126,9 (2018): 546-552. doi:10.1055/s-0043-125064
Llamas, Michael et al. “Low free-T3 serum levels and prognosis of COVID-19: systematic review and meta-analysis.” Clinical chemistry and laboratory medicine vol. 59,12 1906-1913. 11 Aug. 2021, doi:10.1515/cclm-2021-0805
Malik, R, and H Hodgson. “The relationship between the thyroid gland and the liver.” QJM : monthly journal of the Association of Physicians vol. 95,9 (2002): 559-69. doi:10.1093/qjmed/95.9.559
McGregor, Brock. "Extra-Thyroidal Factors Impacting Thyroid Hormone Homeostasis." Journal of Restorative Medicine 4.1 (2015): 40-49.
Moura Neto, Arnaldo, and Denise Engelbrecht Zantut-Wittmann. “Abnormalities of Thyroid Hormone Metabolism during Systemic Illness: The Low T3 Syndrome in Different Clinical Settings.” International journal of endocrinology vol. 2016 (2016): 2157583. doi:10.1155/2016/2157583
Pagana, Kathleen Deska, et al. Mosby's Diagnostic and Laboratory Test Reference. 15th ed., Mosby, 2021.
Roef, Greet, et al. "Body composition and metabolic parameters are associated with variation in thyroid hormone levels among euthyroid young men." European journal of endocrinology 167.5 (2012): 719.
Reverse T3
Reverse T3 (rT3) is a metabolically inactive thyroid hormone, with its production rising during stress and situations such as critical illness, trauma, or severe infection, usually normalizing post-crisis. High rT3 levels can also correlate with diabetes, heart failure, liver disease, aging, and certain medications, while low levels may relate to HIV or central hypothyroidism. rT3 serves as a metabolic regulator, increasing during situations requiring energy and protein conservation, and playing a role in euthyroid sick syndrome. In one study, low rT3 levels were associated with central hypothyroidism, and only normalized with T4 administration, while high rT3 levels related to non-thyroidal illness syndrome (NTIS) resolved over time. Genetic factors, thyroid hormone resistance, and selenium deficiency can also affect rT3 production.
Standard Range: 8.00 – 25.00 ng/dL (0.12 – 0.38 nmol/L)
The ODX Range: 8.00 – 15.00 ng/dL (0.12 – 0.23 nmol/L)
OPTIMAL DX MEMBERS CLICK HERE for more information on Reverse T3
References
DeGroot, Leslie J. “The Non-Thyroidal Illness Syndrome.” Endotext, edited by Kenneth R Feingold et. al., MDText.com, Inc., 1 February 2015.
Exley, Sarah, Sonal Banzal, and Udaya Kabadi. "Low Reverse T3: A Reliable, Sensitive and Specific in Diagnosis of Central Hypothyroidism." Open Journal of Endocrine and Metabolic Diseases 11.7 (2021): 137-143.
Halsall, David J, and Susan Oddy. “Clinical and laboratory aspects of 3,3',5'-triiodothyronine (reverse T3).” Annals of clinical biochemistry vol. 58,1 (2021): 29-37. doi:10.1177/0004563220969150
McGregor, Brock. "Extra-Thyroidal Factors Impacting Thyroid Hormone Homeostasis." Journal of Restorative Medicine 4.1 (2015): 40-49.
Moura Neto, Arnaldo, and Denise Engelbrecht Zantut-Wittmann. “Abnormalities of Thyroid Hormone Metabolism during Systemic Illness: The Low T3 Syndrome in Different Clinical Settings.” International journal of endocrinology vol. 2016 (2016): 2157583. doi:10.1155/2016/2157583
Pagana, Kathleen Deska, et al. Mosby's Diagnostic and Laboratory Test Reference. 15th ed., Mosby, 2021.
Peeters, Robin P, and Theo J Visser. “Metabolism of Thyroid Hormone.” Endotext, edited by Kenneth R Feingold et. al., MDText.com, Inc., 1 January 2017.
Sathyapalan, Thozhukat et al. “The Effect of High Dose Isoflavone Supplementation on Serum Reverse T3 in Euthyroid Men With Type 2 Diabetes and Post-menopausal Women.” Frontiers in endocrinology vol. 9 698. 22 Nov. 2018, doi:10.3389/fendo.2018.00698
Wardle, Jon, and Jerome Sarris. Clinical naturopathy: an evidence-based guide to practice. Elsevier Health Sciences, 2019. 3rd edition.
Wilson, Julian Bryant, and Theodore C. Friedman. "Reverse T3 in Patients With Hypothyroidism, Helpful or a Waste of Time?." Journal of the Endocrine Society 5.Supplement_1 (2021): A952-A952.
T3 Uptake
The T3 uptake test, also known as T3 resin uptake or thyroid hormone binding ratio (THBR), does not directly measure T3, but rather the binding capacity of thyroid binding globulin (TBG), the protein that transports thyroid hormones. It must be evaluated in conjunction with total T4 levels to compute the free thyroxine index (FTI), providing a corrected T4 value. Low T3 uptake can indicate hypothyroidism or elevated TBG, while high T3 uptake can suggest hyperthyroidism or low TBG. This test doesn't evaluate thyroid function on its own and has largely become obsolete with the advent of free T4 assays.
Standard Range: 22.00 – 35.00%
The ODX Range: 27.00 – 35.00%
OPTIMAL DX MEMBERS CLICK HERE for more information on T3 Uptake
References
Dunlap, Dickson B. “Thyroid Function Tests.” Clinical Methods: The History, Physical, and Laboratory Examinations, edited by H Kenneth Walker et. al., 3rd ed., Butterworths, 1990.
Spencer, Carole A. “Assay of Thyroid Hormones and Related Substances.” Endotext, edited by Kenneth R Feingold et. al., MDText.com, Inc., 20 February 2017.
Thyroglobulin
Thyroglobulin (Tg) is a glycoprotein precursor to thyroid hormones T3 and T4 and acts as a storage depot for iodine, which is essential for thyroid hormone production. An increase in thyroid-stimulating hormone can increase thyroglobulin, and subsequently T3 and T4, given sufficient iodine levels. Persistent elevation in thyroglobulin may indicate iodine insufficiency. Conversely, low thyroglobulin levels could be due to thyroidectomy, thyrotoxicosis, congenital hypothyroidism, or elevated Tg antibodies, which can result in falsely low serum Tg levels. Furthermore, elevated thyroglobulin levels may be seen in thyroid cancer, goiter, inflammation, thyroiditis, Hashimoto’s, Graves’ disease, and among smokers.
Standard Range: 2.80 – 40.90 ng/mL (2.80 – 40.90 µg/L)
The ODX Range: 5.00 – 14.00 ng/mL (5.00 – 14.00 µg/L)
NOTE regarding thyroglobulin levels
Thyroglobulin levels may be monitored in individuals with thyroid cancer who have had a thyroidectomy and ablation of the thyroid gland. The test is used to detect residual or recurrent thyroid cancer.
The standard thyroglobulin reference range for athyrotic individuals is very low and does not apply to those with an intact thyroid. Ranges also vary depending on the testing method, i.e., Immunoassay versus LC/MS/MS:
Immunoassay method:
LC/MS/MS (Chromatography/Mass Spectrometry) method:
OPTIMAL DX MEMBERS CLICK HERE for more information on Thyroglobulin
References
Belin, Ruth M et al. “Smoke exposure is associated with a lower prevalence of serum thyroid autoantibodies and thyrotropin concentration elevation and a higher prevalence of mild thyrotropin concentration suppression in the third National Health and Nutrition Examination Survey (NHANES III).” The Journal of clinical endocrinology and metabolism vol. 89,12 (2004): 6077-86. doi:10.1210/jc.2004-0431
Bertelsen, J B, and L Hegedüs. “Cigarette smoking and the thyroid.” Thyroid : official journal of the American Thyroid Association vol. 4,3 (1994): 327-31. doi:10.1089/thy.1994.4.327
Cahoon, Elizabeth K et al. “Factors associated with serum thyroglobulin levels in a population living in Belarus.” Clinical endocrinology vol. 79,1 (2013): 120-7. doi:10.1111/cen.12107
Chanoine, J P et al. “Selenium decreases thyroglobulin concentrations but does not affect the increased thyroxine-to-triiodothyronine ratio in children with congenital hypothyroidism.” The Journal of clinical endocrinology and metabolism vol. 86,3 (2001): 1160-3. doi:10.1210/jcem.86.3.7312
Giovanella, Luca et al. “Serum thyroglobulin reference values according to NACB criteria in healthy subjects with normal thyroid ultrasound.” Clinical chemistry and laboratory medicine vol. 50,5 891-3. 26 Jan. 2012, doi:10.1515/cclm.2011.756
Indrasena, Buddhike Sri Harsha. “Use of thyroglobulin as a tumour marker.” World journal of biological chemistry vol. 8,1 (2017): 81-85. doi:10.4331/wjbc.v8.i1.81
Ma, Zheng Feei, and Sheila A Skeaff. “Thyroglobulin as a biomarker of iodine deficiency: a review.” Thyroid : official journal of the American Thyroid Association vol. 24,8 (2014): 1195-209. doi:10.1089/thy.2014.0052
Ovadia, Yaniv S et al. “Elevated Serum Thyroglobulin and Low Iodine Intake Are Associated with Nontoxic Nodular Goiter among Adults Living near the Eastern Mediterranean Coast.” Journal of thyroid research vol. 2014 (2014): 913672. doi:10.1155/2014/913672
Pagana, Kathleen Deska, et al. Mosby's Diagnostic and Laboratory Test Reference. 15th ed., Mosby, 2021.
Thyroglobulin Antibodies
Thyroglobulin antibodies, which are often found when the thyroid gland is damaged, are associated with conditions like subacute thyroiditis, Hashimoto's thyroiditis, Graves' disease, and other autoimmune disorders. The level of these antibodies can provide insight into the activity of autoimmune thyroid disease, with low levels suggesting an absence or remission of the disease. Environmental factors, genetic predispositions, and nutrient imbalances can contribute to elevated thyroglobulin antibodies. Oxidative stress and exposure to toxins can also increase these antibody levels. In certain conditions like subacute thyroiditis, thyroglobulin antibodies may be present alongside thyroid peroxidase (TPO) antibodies.
*Standard Range: 0.00 – 1.00 IU/mL (0.00 – 1.00 kIU/L)
The ODX Range: 0.00 – 1.00 IU/mL (0.00 – 1.00 kIU/L)
OPTIMAL DX MEMBERS CLICK HERE for more information on Thyroglobulin Abs
References
Choi, Yun Mi et al. “Changes in Thyroid Peroxidase and Thyroglobulin Antibodies Might Be Associated with Graves' Disease Relapse after Antithyroid Drug Therapy.” Endocrinology and metabolism (Seoul, Korea) vol. 34,3 (2019): 268-274. doi:10.3803/EnM.2019.34.3.268
Ihnatowicz, Paulina et al. “The importance of nutritional factors and dietary management of Hashimoto's thyroiditis.” Annals of agricultural and environmental medicine : AAEM vol. 27,2 (2020): 184-193. doi:10.26444/aaem/112331
Jia, Xiaomeng et al. “Clinical Analysis of Preoperative Anti-thyroglobulin Antibody in Papillary Thyroid Cancer Between 2011 and 2015 in Beijing, China: A Retrospective Study.” Frontiers in endocrinology vol. 11 452. 15 Jul. 2020, doi:10.3389/fendo.2020.00452
Kim, Eun Sook et al. “Thyroglobulin antibody is associated with increased cancer risk in thyroid nodules.” Thyroid : official journal of the American Thyroid Association vol. 20,8 (2010): 885-91. doi:10.1089/thy.2009.0384
Nishihara, Eijun et al. “Moderate Frequency of Anti-Thyroglobulin Antibodies in the Early Phase of Subacute Thyroiditis.” European thyroid journal vol. 8,5 (2019): 268-272. doi:10.1159/000501033
Pagana, Kathleen Deska, et al. Mosby's Diagnostic and Laboratory Test Reference. 15th ed., Mosby, 2021.
Vasileiadis, Ioannis et al. “Thyroglobulin antibodies could be a potential predictive marker for papillary thyroid carcinoma.” Annals of surgical oncology vol. 21,8 (2014): 2725-32. doi:10.1245/s10434-014-3593-x
Thyroid Peroxidase (TPO) Antibodies
Thyroid peroxidase (TPO) antibodies are often present in individuals with autoimmune thyroid diseases like Hashimoto's and Graves', indicating potential thyroid gland dysfunction and destruction. Elevated TPO antibody levels can be associated with various conditions, including autoimmune thyroid disease, thyroid cancer, lymphocytic thyroiditis, nodular goiter, rheumatoid arthritis, pernicious anemia, and breast cancer. On the other hand, low levels typically suggest the absence or remission of active autoimmune thyroid disease. However, TPO antibody levels may not always be elevated in those with autoimmune disorders and can decrease when the condition is under control. Nutrition status, including the intake of iodine, selenium, and iron, can impact TPO antibody levels and overall thyroid health.
Standard Range: 0.00 – 9.00 IU/mL (0.00 – 9.00 kIU/L)
The ODX Range: 0.00 – 6.80 IU/mL (0.00 - 6.80 kIU/L)
The ranges above are for Quest Diagnostics lab results. We are aware that the ranges for thyroid antibodies show considerable variability between labs. We make accommodations for the following labs and use their Thyroid Peroxidase (TPO) Abs ranges in our reporting when you select them from the drop-down menu.
|
Lab |
Optimal Range |
Standard Range |
| LabCorp | 0 - 25 IU/ml | 0 - 34 IU/ml |
| LabTech | 0 - 25 IU/ml | 0 - 34 IU/ml |
| Vibrant | 0 - 25 IU/ml | 0 - 34 IU/ml |
For more information on this issue, we recommend the following article: https://kb.optimaldx.com/thyroid-antibody-discrepencies
OPTIMAL DX MEMBERS CLICK HERE for more information on Thyroid Peroxidase (TPO) Abs
References
Ali, Athar, et al. "Relationship between the levels of serum thyroid hormones and the risk of breast cancer." J Biol Agr Healthc 2 (2011): 56-60
Hu, Shiqian, and Margaret P Rayman. “Multiple Nutritional Factors and the Risk of Hashimoto's Thyroiditis.” Thyroid : official journal of the American Thyroid Association vol. 27,5 (2017): 597-610. doi:10.1089/thy.2016.0635
Hutfless, Susan et al. “Significance of prediagnostic thyroid antibodies in women with autoimmune thyroid disease.” The Journal of clinical endocrinology and metabolism vol. 96,9 (2011): E1466-71. doi:10.1210/jc.2011-0228
Ihnatowicz, Paulina et al. “The importance of nutritional factors and dietary management of Hashimoto's thyroiditis.” Annals of agricultural and environmental medicine : AAEM vol. 27,2 (2020): 184-193. doi:10.26444/aaem/112331
Jeena, E. Jacob, M. Malathi, and K. Sudeep. "A hospital-based study of anti-TPO titer in patients with thyroid disease." Muller Journal of Medical Sciences and Research 4.2 (2013): 74.
Legakis, Ioannis et al. “Thyroid function and prevalence of anti-thyroperoxidase (TPO) and anti-thyroglobulin (Tg) antibodies in outpatients hospital setting in an area with sufficient iodine intake: influences of age and sex.” Acta medica Iranica vol. 51,1 (2013): 25-34.
Nishihara, Eijun et al. “Moderate Frequency of Anti-Thyroglobulin Antibodies in the Early Phase of Subacute Thyroiditis.” European thyroid journal vol. 8,5 (2019): 268-272. doi:10.1159/000501033
Pagana, Kathleen Deska, et al. Mosby's Diagnostic and Laboratory Test Reference. 15th ed., Mosby, 2021.
Rayman, Margaret P. “Multiple nutritional factors and thyroid disease, with particular reference to autoimmune thyroid disease.” The Proceedings of the Nutrition Society vol. 78,1 (2019): 34-44. doi:10.1017/S0029665118001192
Thyrotropin Receptor Antibodies (TRAbs), Serum
Thyrotropin receptor antibodies (TRAbs) interact with the TSH receptor and can either stimulate or block it, contributing to conditions like Graves' disease or Hashimoto's thyroiditis. Elevated levels of TRAbs are often found in cases of hyperthyroidism, hypothyroidism, myxedema, and exophthalmos. However, high-dose biotin may falsely elevate these levels. On the other hand, low TRAb levels usually indicate the absence of Graves' disease and autoimmune thyroid diseases. The balance between stimulating and blocking TRAbs can determine the severity of these diseases.
Standard Range: 00.0 – 2.00 IU/L
The ODX Range: 0.00 – 0.55 IU/L
OPTIMAL DX MEMBERS CLICK HERE for more information on Thyrotropin Receptor Antibodies
References
Baral, Suman et al. “Serum Free T3 to Free T4 Ratio as a Useful Indicator for Differentiating Destruction Induced Thyrotoxicosis from Graves' Disease.” Journal of clinical and diagnostic research : JCDR vol. 11,7 (2017): OC12-OC14. doi:10.7860/JCDR/2017/28293.10180
Barbesino, Giuseppe, and Yaron Tomer. “Clinical review: Clinical utility of TSH receptor antibodies.” The Journal of clinical endocrinology and metabolism vol. 98,6 (2013): 2247-55. doi:10.1210/jc.2012-4309
Hsieh, Albert et al. “Liver enzyme profile and progression in association with thyroid autoimmunity in Graves' disease.” Endocrinology, diabetes & metabolism vol. 2,4 e00086. 15 Jul. 2019, doi:10.1002/edm2.86
Kahaly, George J, and Tanja Diana. “TSH Receptor Antibody Functionality and Nomenclature.” Frontiers in endocrinology vol. 8 28. 15 Feb. 2017, doi:10.3389/fendo.2017.00028
Kotwal, Anupam, and Marius Stan. “Thyrotropin Receptor Antibodies-An Overview.” Ophthalmic plastic and reconstructive surgery vol. 34,4S Suppl 1 (2018): S20-S27. doi:10.1097/IOP.0000000000001052
Pagana, Kathleen Deska, et al. Mosby's Diagnostic and Laboratory Test Reference. 15th ed., Mosby, 2021.
Free Thyroxine Index (T7)
The Free Thyroxine Index (FTI) is a measure used to evaluate thyroid function and help identify hyperthyroidism or hypothyroidism. Lower FTI values may indicate hypothyroidism due to reduced levels of free thyroxine (T4) in circulation, while higher FTI values may suggest hyperthyroidism. Although FTI is now less commonly used than more direct measurements of free T4, it can still be beneficial in diagnosing central hypothyroidism caused by pituitary dysfunction. However, there can be discrepancies between FTI and free T4 levels in some cases.
Standard Range: 1.40 – 3.80 Index
The ODX Range: 1.70 – 4.60 Index
OPTIMAL DX MEMBERS CLICK HERE for more information on Free Thyroxine Index T7
References
Midgley, J E. “Direct and indirect free thyroxine assay methods: theory and practice.” Clinical chemistry vol. 47,8 (2001): 1353-63.
Pantalone, Kevin M et al. “Measurement of Serum Free Thyroxine Index May Provide Additional Case Detection Compared to Free Thyroxine in the Diagnosis of Central Hypothyroidism.” Case reports in endocrinology vol. 2015 (2015): 965191. doi:10.1155/2015/965191
Westcott, Gregory P et al. “USE OF THE FREE THYROXINE INDEX TO REFINE THE LOWER LIMIT OF A FREE THYROXINE IMMUNOASSAY FOR DETECTION OF SECONDARY HYPOTHYROIDISM.” Endocrine practice : official journal of the American College of Endocrinology and the American Association of Clinical Endocrinologists vol. 27,1 (2021): 8-14. doi:10.4158/EP-2020-0210
Free T3:Free T4 Ratio
The free T3 to free T4 ratio (FT3:FT4) provides insights into thyroid hormone metabolism, particularly the conversion of T4 to T3. This ratio can indicate various health conditions: a low FT3:FT4 ratio might suggest low T3 syndrome or T4 monotherapy, while a high ratio could imply hyperthyroidism or metabolic syndrome. Elevated FT3:FT4 ratios are associated with diseases like Graves' disease and fatty liver. Furthermore, both low and high ratios are associated with increased cardiovascular risk.
Standard Range: 2.2 – 2.9 Ratio (FT3 in pg/mL and FT4 in ng/dL)
The ODX Range: 2.4 – 2.7 Ratio (FT3 in pg/mL and FT4 in ng/dL)
OPTIMAL DX MEMBERS CLICK HERE for more information on FT3:FT4 Ratio
References
Abbey, Enoch J et al. “Free Thyroxine Distinguishes Subclinical Hypothyroidism From Other Aging-Related Changes in Those With Isolated Elevated Thyrotropin.” Frontiers in endocrinology vol. 13 858332. 4 Mar. 2022, doi:10.3389/fendo.2022.858332
Ataoglu HE, Ahbab S, Serez MK, et al. Prognostic significance of high free T4 and low free T3 levels in non-thyroidal illness syndrome. Eur J Intern Med. 2018 Nov;57:91-95.
Baral, Suman et al. “Serum Free T3 to Free T4 Ratio as a Useful Indicator for Differentiating Destruction Induced Thyrotoxicosis from Graves' Disease.” Journal of clinical and diagnostic research : JCDR vol. 11,7 (2017): OC12-OC14. doi:10.7860/JCDR/2017/28293.10180
Chen, Xinxin et al. “Diagnostic Values of Free Triiodothyronine and Free Thyroxine and the Ratio of Free Triiodothyronine to Free Thyroxine in Thyrotoxicosis.” International journal of endocrinology vol. 2018 4836736. 4 Jun. 2018, doi:10.1155/2018/483673
Gokmen FY, Ahbab S, Ataoglu HE, et al. FT3/FT4 ratio predicts non-alcoholic fatty liver disease independent of metabolic parameters in patients with euthyroidism and hypothyroidism. Clinics (Sao Paulo). 2016 Apr;71(4):221-5. doi: 10.6061/clinics/2016(04)08.
Kong, S H et al. “Low free T3 to free T4 ratio was associated with low muscle mass and impaired physical performance in community-dwelling aged population.” Osteoporosis international : a journal established as result of cooperation between the European Foundation for Osteoporosis and the National Osteoporosis Foundation of the USA vol. 31,3 (2020): 525-531. doi:10.1007/s00198-019-05137-w
Nomura, Risa et al. “Free T3 to free T4 ratio less than 2.0 suggests low T3 syndrome rather than central hypothyroidism from the age of two to eighteen years.” Endocrine journal vol. 64,2 (2017): 213-219. doi:10.1507/endocrj.EJ16-0169
Park SY, Park SE, Jung SW, et al. Free triiodothyronine/free thyroxine ratio rather than thyrotropin is more associated with metabolic parameters in healthy euthyroid adult subjects. Clin Endocrinol (Oxf). 2017 Jul;87(1):87-96. doi: 10.1111/cen.13345. Epub 2017 May 3
Roef, Greet L et al. “Triiodothyronine and free thyroxine levels are differentially associated with metabolic profile and adiposity-related cardiovascular risk markers in euthyroid middle-aged subjects.” Thyroid : official journal of the American Thyroid Association vol. 24,2 (2014): 223-31. doi:10.1089/thy.2013.0314
Sesmilo, Gemma et al. “Serum free triiodothyronine (T3) to free thyroxine (T4) ratio in treated central hypothyroidism compared with primary hypothyroidism and euthyroidism.” Endocrinologia y nutricion : organo de la Sociedad Espanola de Endocrinologia y Nutricion vol. 58,1 (2011): 9-15. doi:10.1016/j.endonu.2010.09.006
Sriphrapradang C, Bhasipol A. Differentiating Graves' disease from subacute thyroiditis using ratio of serum free triiodothyronine to free thyroxine. Ann Med Surg (Lond). 2016 Aug 8;10:69-72. doi: 10.1016/j.amsu.2016.07.024. eCollection 2016 Sep.
van den Berg EH, van Tienhoven-Wind LJ, Amini M, et al. Higher free triiodothyronine is associated with non-alcoholic fatty liver disease in euthyroid subjects: the Lifelines Cohort Study. Metabolism. 2017 Feb;67:62-71. doi: 10.1016/j.metabol.2016.11.002. Epub 2016 Nov 6
Wolffenbuttel BHR, Wouters HJCM, Slagter SN, et al Thyroid function and metabolic syndrome in the population-based LifeLines cohort study. BMC Endocr Disord. 2017 Oct 16;17(1):65. doi: 10.1186/s12902-017-0215-1
Yu T, Tian C, Song J, et al. Value of the fT3/fT4 ratio and its combination with the GRACE risk score in predicting the prognosis in euthyroid patients with acute myocardial infarction undergoing percutaneous coronary intervention: a prospective cohort study. BMC Cardiovasc Disord. 2018 Sep 10;18(1):181.
Yuan, Deshan et al. “Predictive value of free triiodothyronine (FT3) to free thyroxine (FT4) ratio in long-term outcomes of euthyroid patients with three-vessel coronary artery disease.” Nutrition, metabolism, and cardiovascular diseases : NMCD vol. 31,2 (2021): 579-586. doi:10.1016/j.numecd.2020.10.011
Free T3:Reverse T3 Ratio
The Free T3 to Reverse T3 ratio (FT3:rT3) provides insights into thyroid hormone conversion and a person's level of metabolic stress. Low ratios could indicate increased reverse T3 production due to acute stress situations like trauma or surgery, or chronic conditions such as liver dysfunction and heart failure. Such a ratio is not a direct indication of thyroid dysfunction but can be a marker for inflammation and fibrosis in the liver. High FT3:rT3 ratios are not usually clinically significant. The FT3:rT3 ratio is a valuable tool to assess individual stress responses and potential underlying health issues.
Standard Range: 2.00 - 28.00 Ratio (FT3 in pg/dL and rT3 in ng/dL)
The ODX Range: 10.00 – 28.00 Ratio (FT3 in pg/dL and rT3 in ng/dL)
OPTIMAL DX MEMBERS CLICK HERE for more information on FT3:rT3 Ratio
References
Ganesan, Kavitha, et al. “Euthyroid Sick Syndrome.” StatPearls, StatPearls Publishing, 27 October 2022.
Harrison, Stephen A., et al. "Effects of Resmetirom on Noninvasive Endpoints in a 36‐Week Phase 2 Active Treatment Extension Study in Patients With NASH." Hepatology communications 5.4 (2021): 573-588.
Hatziagelaki, Erifili et al. “NAFLD and thyroid function: pathophysiological and therapeutic considerations.” Trends in endocrinology and metabolism: TEM vol. 33,11 (2022): 755-768. doi:10.1016/j.tem.2022.08.001
Mancini, Antonio et al. “Thyroid Hormones, Oxidative Stress, and Inflammation.” Mediators of inflammation vol. 2016 (2016): 6757154. doi:10.1155/2016/6757154
Moura Neto, Arnaldo, and Denise Engelbrecht Zantut-Wittmann. “Abnormalities of Thyroid Hormone Metabolism during Systemic Illness: The Low T3 Syndrome in Different Clinical Settings.” International journal of endocrinology vol. 2016 (2016): 2157583. doi:10.1155/2016/2157583
Moura Neto, Arnaldo et al. “Relation of thyroid hormone abnormalities with subclinical inflammatory activity in patients with type 1 and type 2 diabetes mellitus.” Endocrine vol. 51,1 (2016): 63-71. doi:10.1007/s12020-015-0651-5
Pagana, Kathleen Deska, et al. Mosby's Diagnostic and Laboratory Test Reference. 15th ed., Mosby, 2021.
Pimentel, Carlos Roberto Alves et al. “Reverse T3 as a parameter of myocardial function impairment in heart failure.” International journal of cardiology vol. 145,1 (2010): 52-3. doi:10.1016/j.ijcard.2009.04.001
Thyroxine-Binding Globulin (TBG)
Thyroxine-binding globulin (TBG) serves as a primary carrier for T3 and T4 thyroid hormones in the blood, ensuring their delivery and stabilization. Decreased levels of TBG can be associated with hyperthyroidism, malnutrition, major stress, and the use of certain medications, among other factors. On the other hand, increased TBG levels can be linked to hypothyroidism, hormone therapy, exposure to phthalates, and certain health conditions like hepatitis. Thus, measuring TBG, alongside T3 and T4, is crucial for distinguishing actual thyroid dysfunction from changes caused by binding proteins.
Standard Range:
Male 12.70 – 25.10 µg/mL (235.18 – 464.81 nmol/L)
Female 13.5 - 30.9 µg/mL (249.99 - 559.07 nmol/L)OPTIMAL DX MEMBERS CLICK HERE for more information on Thyroxine-Binding Globulin
References
Azad, Reza Mansourian. “Abnormal serum thyroid hormones concentration with healthy functional gland: a review on the metabolic role of thyroid hormones transporter proteins.” Pakistan journal of biological sciences : PJBS vol. 14,5 (2011): 313-26. doi:10.3923/pjbs.2011.313.326
Chakravarthy, Varshini. and Sehar Ejaz . “Thyroxine-Binding Globulin Deficiency.” StatPearls, StatPearls Publishing, 5 July 2022.
Choi, Sohyeon et al. “Thyroxine-binding globulin, peripheral deiodinase activity, and thyroid autoantibody status in association of phthalates and phenolic compounds with thyroid hormones in adult population.” Environment international vol. 140 (2020): 105783. doi:10.1016/j.envint.2020.105783
Dunlap, Dickson B. “Thyroid Function Tests.” Clinical Methods: The History, Physical, and Laboratory Examinations, edited by H Kenneth Walker et. al., 3rd ed., Butterworths, 1990.
Pagana, Kathleen Deska, et al. Mosby's Diagnostic and Laboratory Test Reference. 15th ed., Mosby, 2021.
Vitamins, i.e., “vital amines,” are essential micronutrients that play crucial roles in human health. They are required in small amounts for normal body functions, growth, and maintenance. Vitamins cannot be synthesized in sufficient quantities by the human body, so they must be obtained through diet or supplementation. There are 13 recognized vitamins, classified into two categories: fat-soluble (A, D, E, and K) and water-soluble (B vitamins and vitamin C). The importance of vitamins to health and metabolism can be highlighted by their involvement in various physiological processes, including energy production, red blood cell formation, antioxidant function, bone health, vision, immune function, cell growth and differentiation, and blood clotting. Obtaining adequate vitamins through diet or supplementation is vital for maintaining overall health and supporting the body's diverse physiological processes.
Vitamin D 25(OH), Total
Vitamin D, a unique pre-hormone, is found in limited amounts in food as vitamin D2 from plants and D3 from animals. It can also be produced in the skin from a cholesterol-based compound when exposed to sunlight. The precursor is converted to 25(OH)D in the liver and then to the active form, calcitriol, in other tissues, primarily the kidney. Vitamin D insufficiency is linked to bone disease, malnutrition, liver or kidney disease, inflammation, mood disorders, dyslipidemia, and certain medications. Elevated vitamin D levels may result from excessive supplementation, calcium dysregulation, bone demineralization, pain, gastrointestinal complications, dehydration, and confusion.
OPTIMAL DX MEMBERS CLICK HERE for more information on Vitamin D 25(OH), total
References
Ahmed, Lina H M et al. “Vitamin D3 metabolite ratio as an indicator of vitamin D status and its association with diabetes complications.” BMC endocrine disorders vol. 20,1 161. 27 Oct. 2020, doi:10.1186/s12902-020-00641-1
Akpınar, Şerife, and Makbule Gezmen Karadağ. “Is Vitamin DImportant in Anxiety or Depression? What Is the Truth?.” Current nutritionreports vol. 11,4 (2022): 675-681. doi:10.1007/s13668-022-00441-0
Amrein, Karin et al. “Vitamin D deficiency 2.0: an update on the current status worldwide.” European journal of clinical nutrition vol. 74,11 (2020): 1498-1513. doi:10.1038/s41430-020-0558-y
Apostolakis, Michail et al. “Vitamin D and cardiovascular disease.” Maturitas vol. 115 (2018): 1-22. doi:10.1016/j.maturitas.2018.05.010
Biancuzzo, Rachael M et al. “Serum concentrations of 1,25-dihydroxyvitamin D2 and 1,25-dihydroxyvitamin D3 in response to vitamin D2 and vitamin D3 supplementation.” The Journal of clinical endocrinology and metabolism vol. 98,3 (2013): 973-9. doi:10.1210/jc.2012-2114
Chang, Szu-Wen, and Hung-Chang Lee. “Vitamin D and health - The missing vitamin in humans.” Pediatrics and neonatology vol. 60,3 (2019): 237-244. doi:10.1016/j.pedneo.2019.04.007
Ekmekcioglu , Cem et al. “25-Hydroxyvitamin D Status and Risk for Colorectal Cancer and Type 2 Diabetes Mellitus: A Systematic Review and Meta-Analysis of Epidemiological Studies.” International journal of environmental research and public health vol. 14,2 127. 28 Jan. 2017, doi:10.3390/ijerph14020127
Garland, Cedric F et al. “What is the dose-response relationship between vitamin D and cancer risk?.” Nutrition reviews vol. 65,8 Pt 2 (2007): S91-5. doi:10.1111/j.1753-4887.2007.tb00349.x
Gholamzad, Amir et al. “Association between serum vitamin Dlevels and lipid profiles: a cross-sectional analysis.” Scientific reports vol.13,1 21058. 29 Nov. 2023, doi:10.1038/s41598-023-47872-5
Gossiel, Fatma et al. “Establishing reference intervals for bone turnover markers in healthy postmenopausal women in a nonfasting state.” BoneKEy reports vol. 3 573. 3 Sep. 2014, doi:10.1038/bonekey.2014.68
Grant, William B, and Micael F Holick. “Benefits and requirements of vitamin D for optimal health: a review.” Alternative medicine review : a journal of clinical therapeutic vol. 10,2 (2005): 94-111.
Gropper, Sareen S.; Smith, Jack L.; Carr, Timothy P. Advanced Nutrition and Human Metabolism. 8th edition. Wadsworth Publishing Co Inc. 2021.
Holick, Michael F et al. “Evaluation, treatment, and prevention of vitamin D deficiency: an Endocrine Society clinical practice guideline.” The Journal of clinical endocrinology and metabolism vol. 96,7 (2011): 1911-30. doi:10.1210/jc.2011-0385
Holick, Michael F. “The vitamin D deficiency pandemic: Approaches for diagnosis, treatment and prevention.” Reviews in endocrine & metabolic disorders vol. 18,2 (2017): 153-165. doi:10.1007/s11154-017-9424-1
Huang, Xiao et al. “Association between vitamin D deficiencyand lipid profiles in overweight and obese adults: a systematic review andmeta-analysis.” BMC public health vol. 23,1 1653. 29 Aug. 2023,doi:10.1186/s12889-023-16447-4
Jain, Sushil K et al. “The potential link between inherited G6PD deficiency, oxidative stress, and vitamin D deficiency and the racial inequities in mortality associated with COVID-19.” Free radical biology & medicine vol. 161 (2020): 84-91. doi:10.1016/j.freeradbiomed.2020.10.002
Jiang, Xiongjing et al. “Vitamin D deficiency is associatedwith dyslipidemia: a cross-sectional study in 3788 subjects.” Current medicalresearch and opinion vol. 35,6 (2019): 1059-1063.doi:10.1080/03007995.2018.1552849
McDonneData analysisll, Sharon L et al. “Breast cancer risk markedly lower with serum 25-hydroxyvitamin D concentrations ≥60 vs <20 ng/ml (150 vs 50 nmol/L): Pooled analysis of two randomized trials and a prospective cohort.” PloS one vol. 13,6 e0199265. 15 Jun. 2018, doi:10.1371/journal.pone.0199265
Moyad, Mark A. “Vitamin D: a rapid review.” Dermatology nursing vol. 21,1 (2009): 25-30, 55.
Pagana, Kathleen Deska, et al. Mosby's Diagnostic and Laboratory Test Reference. 15th ed., Mosby, 2021.
Penckofer, Sue et al. “Vitamin D and depression: where isall the sunshine?.” Issues in mental health nursing vol. 31,6 (2010): 385-93.doi:10.3109/01612840903437657
Sassi, Francesca et al. “Vitamin D: Nutrient, Hormone, and Immunomodulator.” Nutrients vol. 10,11 1656. 3 Nov. 2018, doi:10.3390/nu10111656
Szymczak-Pajor, Izabela et al. “The Action of Vitamin D in Adipose Tissue: Is There the Link between Vitamin D Deficiency and Adipose Tissue-Related Metabolic Disorders?.” International journal of molecular sciences vol. 23,2 956. 16 Jan. 2022, doi:10.3390/ijms23020956
Vranić, Luka et al. “Vitamin D Deficiency: Consequence or Cause of Obesity?.” Medicina (Kaunas, Lithuania) vol. 55,9 541. 28 Aug. 2019,
doi:10.3390/medicina55090541
Vitamin D 1,25(OH)2D, Calcitriol
Calcitriol, also known as 1,25(OH)2D, is the bioactive form of vitamin D, produced through a two-step process involving the liver and kidney. It plays a crucial role in regulating calcium and phosphate levels, supporting bone health, and modulating the immune system. Low levels of calcitriol are linked to various health issues, including metabolic syndrome, cardiovascular disease, and complications in pregnancy. High levels, on the other hand, can be associated with autoimmune disorders and other health conditions. Measuring calcitriol levels can provide valuable insights into vitamin D metabolism and overall health, especially in certain clinical situations.
OPTIMAL DX MEMBERS CLICK HERE for more information on Vitamin D 1,25(OH)2D
References
Albahlol, Ibrahim A et al. “Vitamin D Status and Pregnancy Complications: Serum 1,25-di-hydroxyl-Vitamin D and its Ratio to 25-hydroxy-Vitamin D are Superior Biomarkers than 25-hydroxy-Vitamin D.” International journal of medical sciences vol. 17,18 3039-3048. 18 Oct. 2020, doi:10.7150/ijms.47807
Amrein, Karin et al. “Vitamin D deficiency 2.0: an update on the current status worldwide.” European journal of clinical nutrition vol. 74,11 (2020): 1498-1513. doi:10.1038/s41430-020-0558-y
Bea, Jennifer W et al. “Concentrations of the vitamin D metabolite 1,25(OH)2D and odds of metabolic syndrome and its components.” Metabolism: clinical and experimental vol. 64,3 (2015): 447-59. doi:10.1016/j.metabol.2014.11.010
Blaney, Greg P et al. “Vitamin D metabolites as clinical markers in autoimmune and chronic disease.” Annals of the New York Academy of Sciences vol. 1173 (2009): 384-90. doi:10.1111/j.1749-6632.2009.04875.x
Dirks, Niek F et al. “The When, What & How of Measuring Vitamin D Metabolism in Clinical Medicine.” Nutrients vol. 10,4 482. 13 Apr. 2018, doi:10.3390/nu10040482
Gropper, Sareen S.; Smith, Jack L.; Carr, Timothy P. Advanced Nutrition and Human Metabolism. 8th edition. Wadsworth Publishing Co Inc. 2021.
Holick, Michael F. “The vitamin D deficiency pandemic: Approaches for diagnosis, treatment and prevention.” Reviews in endocrine & metabolic disorders vol. 18,2 (2017): 153-165. doi:10.1007/s11154-017-9424-1
Karhapaa, P et al. “Diverse associations of 25-hydroxyvitamin D and 1,25-dihydroxy-vitamin D with dyslipidaemias.” Journal of internal medicine vol. 268,6 (2010): 604-10. doi:10.1111/j.1365-2796.2010.02279.x
Kavathia, Dashant et al. “Elevated 1, 25-dihydroxyvitamin D levels are associated with protracted treatment in sarcoidosis.” Respiratory medicine vol. 104,4 (2010): 564-70. doi:10.1016/j.rmed.2009.12.004
Lips, Paul. “Relative value of 25(OH)D and 1,25(OH)2D measurements.” Journal of bone and mineral research : the official journal of the American Society for Bone and Mineral Research vol. 22,11 (2007): 1668-71. doi:10.1359/jbmr.070716
Marcinowska-Suchowierska, Ewa et al. “Vitamin D Toxicity-A Clinical Perspective.” Frontiers in endocrinology vol. 9 550. 20 Sep. 2018, doi:10.3389/fendo.2018.00550
Pagana, Kathleen Deska, et al. Mosby's Diagnostic and Laboratory Test Reference. 15th ed., Mosby, 2021.
Pletz, Mathias W et al. “Vitamin D deficiency in community-acquired pneumonia: low levels of 1,25(OH)2 D are associated with disease severity.” Respiratory research vol. 15,1 53. 27 Apr. 2014, doi:10.1186/1465-9921-15-53
Sassi, Francesca et al. “Vitamin D: Nutrient, Hormone, and Immunomodulator.” Nutrients vol. 10,11 1656. 3 Nov. 2018, doi:10.3390/nu10111656
Tebben, Peter J et al. “Vitamin D-Mediated Hypercalcemia: Mechanisms, Diagnosis, and Treatment.” Endocrine reviews vol. 37,5 (2016): 521-547. doi:10.1210/er.2016-1070
Tomaschitz, Andreas et al. “Independent association between 1,25-dihydroxyvitamin D, 25-hydroxyvitamin D and the renin-angiotensin system: The Ludwigshafen Risk and Cardiovascular Health (LURIC) study.” Clinica chimica acta; international journal of clinical chemistry vol. 411,17-18 (2010): 1354-60. doi:10.1016/j.cca.2010.05.037
Folate, Serum
Folate, or vitamin B9, is crucial for various bodily functions, including red and white blood cell production, DNA synthesis, and methylation reactions. Insufficient folate can result in numerous health issues, including anemia, altered metabolic processes, cognitive impairment, and an increased risk of certain diseases and birth defects. Conversely, elevated folate levels, typically due to an abundance of synthetic folic acid, may negatively impact folate and homocysteine metabolism. Food fortification with folic acid may reduce neural tube defects, but overconsumption of synthetic folic acid can potentially promote certain cancers and mask vitamin B12 deficiency. Therefore, optimal folate management is essential for maintaining health, particularly in individuals with specific dietary habits, underlying health conditions, or genetic polymorphisms affecting folate metabolism.
Standard Range: 5.50 - 27.00 ng/mL (12.46 – 61.18 nmol/L)
The ODX Range: 15.00 – 27.00 ng/mL (33.99 – 61.18 nmol/L)
OPTIMAL DX MEMBERS CLICK HERE for more information on Folate
References
Bailey, Lynn B et al. “Biomarkers of Nutrition for Development-Folate Review.” The Journal of nutrition vol. 145,7 (2015): 1636S-1680S. doi:10.3945/jn.114.206599
Bender, Ansley et al. “The association of folate and depression: A meta-analysis.” Journal of psychiatric research vol. 95 (2017): 9-18. doi:10.1016/j.jpsychires.2017.07.019
Chen, Meng-Yu et al. “Defining the plasma folate concentration associated with the red blood cell folate concentration threshold for optimal neural tube defects prevention: a population-based, randomized trial of folic acid supplementation.” The American journal of clinical nutrition vol. 109,5 (2019): 1452-1461. doi:10.1093/ajcn/nqz027
da Silva, Robin P et al. “Novel insights on interactions between folate and lipid metabolism.” BioFactors (Oxford, England) vol. 40,3 (2014): 277-83. doi:10.1002/biof.1154
Devalia, Vinod et al. “Guidelines for the diagnosis and treatment of cobalamin and folate disorders.” British journal of haematology vol. 166,4 (2014): 496-513. doi:10.1111/bjh.12959
Ebara, Shuhei. “Nutritional role of folate.” Congenital anomalies vol. 57,5 (2017): 138-141. doi:10.1111/cga.12233
Froese, D Sean et al. “Vitamin B12 , folate, and the methionine remethylation cycle-biochemistry, pathways, and regulation.” Journal of inherited metabolic disease vol. 42,4 (2019): 673-685. doi:10.1002/jimd.12009
Kozman, Diana et al. “Serum Folate of Less than 7.0 ng/mL is a Marker of Malnutrition.” Laboratory medicine vol. 51,5 (2020): 507-511. doi:10.1093/labmed/lmz101
McNulty, Helene et al. “Addressing optimal folate and related B-vitamin status through the lifecycle: health impacts and challenges.” The Proceedings of the Nutrition Society vol. 78,3 (2019): 449-462. doi:10.1017/S0029665119000661
Naderi, Nassim, and James D House. “Recent Developments in Folate Nutrition.” Advances in food and nutrition research vol. 83 (2018): 195-213. doi:10.1016/bs.afnr.2017.12.006
Ohrvik, Veronica E, and Cornelia M Witthoft. “Human folate bioavailability.” Nutrients vol. 3,4 (2011): 475-90. doi:10.3390/nu3040475
Pagana, Kathleen Deska, et al. Mosby's Diagnostic and Laboratory Test Reference. 15th ed., Mosby, 2021.
Pfeiffer, Christine M et al. “Estimation of trends in serum and RBC folate in the U.S. population from pre- to postfortification using assay-adjusted data from the NHANES 1988-2010.” The Journal of nutrition vol. 142,5 (2012): 886-93. doi:10.3945/jn.111.156919
Pieroth, Renee et al. “Folate and Its Impact on Cancer Risk.” Current nutrition reports vol. 7,3 (2018): 70-84. doi:10.1007/s13668-018-0237-y
Pizzorno, Joseph E., Michael T. Murray, and Herb Joiner-Bey. The Clinician's handbook of natural medicine E-book. Elsevier Health Sciences, 2016.
Scaglione, Francesco, and Giscardo Panzavolta. “Folate, folic acid and 5-methyltetrahydrofolate are not the same thing.” Xenobiotica; the fate of foreign compounds in biological systems vol. 44,5 (2014): 480-8. doi:10.3109/00498254.2013.845705
Singh, Gurmukh et al. “Clinical utility of serum folate measurement in tertiary care patients: Argument for revising reference range for serum folate from 3.0 ng/mL to 13.0 ng/mL.” Practical laboratory medicine vol. 1 35-41. 26 Mar. 2015, doi:10.1016/j.plabm.2015.03.005
Sobczyńska-Malefora, Agata, and Dominic J Harrington. “Laboratory assessment of folate (vitamin B9) status.” Journal of clinical pathology vol. 71,11 (2018): 949-956. doi:10.1136/jclinpath-2018-205048
World Health Organization. Serum and red blood cell folate concentrations for assessing folate status in populations. No. WHO/NMH/NHD/EPG/15.01. World Health Organization, 2015. https://apps.who.int/iris/bitstream/handle/10665/162114/WHO_NMH_NHD_EPG_15.01.pdf
Zheng, Yuxiang, and Lewis C Cantley. “Toward a better understanding of folate metabolism in health and disease.” The Journal of experimental medicine vol. 216,2 (2019): 253-266. doi:10.1084/jem.20181965
Folate, Red Blood Cell
Folate, a B vitamin, plays significant roles in various biological functions such as red and white blood cell production, DNA synthesis, and one-carbon metabolism. Red blood cell (RBC) folate level is a reliable indicator of long-term folate status and can help prevent health issues like neural tube defects and megaloblastic anemia when maintained above certain levels. However, low RBC folate can be linked to insufficiencies of folate or vitamin B12, with implications ranging from birth defects to hyperhomocysteinemia. Conversely, high RBC folate may indicate recent transfusion or prolonged supplementation. Importantly, maintaining optimal folate status through the preferred form, 5-MTHF, is beneficial in managing overall health.
Standard Range: 280.00 – 1504 ng/mL (634.48 – 3408.06 nmol/L)
The ODX Range: 500 - 1504 ng/mL (1133 – 3408.06 nmol/L)
OPTIMAL DX MEMBERS CLICK HERE for more information on RBC Folate
References
Chan, Yen-Ming et al. “Folate.” Advances in nutrition (Bethesda, Md.) vol. 4,1 123-5. 1 Jan. 2013, doi:10.3945/an.112.003392
Chen, Meng-Yu et al. “Defining the plasma folate concentration associated with the red blood cell folate concentration threshold for optimal neural tube defects prevention: a population-based, randomized trial of folic acid supplementation.” The American journal of clinical nutrition vol. 109,5 (2019): 1452-1461. doi:10.1093/ajcn/nqz027
Crider, Krista S et al. “Population red blood cell folate concentrations for prevention of neural tube defects: Bayesian model.” BMJ (Clinical research ed.) vol. 349 g4554. 29 Jul. 2014, doi:10.1136/bmj.g4554
da Silva, Robin P et al. “Novel insights on interactions between folate and lipid metabolism.” BioFactors (Oxford, England) vol. 40,3 (2014): 277-83. doi:10.1002/biof.1154
Naderi, Nassim, and James D House. “Recent Developments in Folate Nutrition.” Advances in food and nutrition research vol. 83 (2018): 195-213. doi:10.1016/bs.afnr.2017.12.006
Ohrvik, Veronica E, and Cornelia M Witthoft. “Human folate bioavailability.” Nutrients vol. 3,4 (2011): 475-90. doi:10.3390/nu3040475
Pagana, Kathleen Deska, et al. Mosby's Diagnostic and Laboratory Test Reference. 15th ed., Mosby, 2021.
Pfeiffer, Christine M et al. “Estimation of trends in serum and RBC folate in the U.S. population from pre- to postfortification using assay-adjusted data from the NHANES 1988-2010.” The Journal of nutrition vol. 142,5 (2012): 886-93. doi:10.3945/jn.111.156919
Scaglione, Francesco, and Giscardo Panzavolta. “Folate, folic acid and 5-methyltetrahydrofolate are not the same thing.” Xenobiotica; the fate of foreign compounds in biological systems vol. 44,5 (2014): 480-8. doi:10.3109/00498254.2013.845705
Sobczyńska-Malefora, Agata, and Dominic J Harrington. “Laboratory assessment of folate (vitamin B9) status.” Journal of clinical pathology vol. 71,11 (2018): 949-956. doi:10.1136/jclinpath-2018-205048
World Health Organization. Serum and red blood cell folate concentrations for assessing folate status in populations. No. WHO/NMH/NHD/EPG/15.01. World Health Organization, 2015.
Vitamin B12, Cobalamin
Vitamin B12, also known as cobalamin, is an essential micronutrient involved in many metabolic functions, such as the production of red blood cells, DNA, protein, myelin, and energy. It is primarily found in animal-based foods, and its absorption is complex, relying heavily on stomach acid and intrinsic factor. Deficiency of B12 can lead to anemia, fatigue, neurological abnormalities, and other health issues, and may be caused by reduced stomach acid, certain gastrointestinal surgeries, or specific health conditions such as atrophic gastritis, malabsorption, or inflammatory bowel disease. Elevated levels of B12 can also be problematic, potentially indicating liver or kidney disease, autoimmune disorders, or certain types of cancer. Supplementation methods vary based on individual absorption capabilities and can include oral, intramuscular, or sublingual forms.
Standard Range: 200.00 – 1100.00 pg/mL (147.56 – 811.58 pmol/L)
The ODX Range: 545.00 – 1100 pg/mL (402.01 – 811.58 pmol/L)
OPTIMAL DX MEMBERS CLICK HERE for more information on Vitamin B12
References
Allen, Lindsay H et al. “Biomarkers of Nutrition for Development (BOND): Vitamin B-12 Review.” The Journal of nutrition vol. 148,suppl_4 (2018): 1995S-2027S. doi:10.1093/jn/nxy201
Andres, E et al. “The pathophysiology of elevated vitamin B12 in clinical practice.” QJM : monthly journal of the Association of Physicians vol. 106,6 (2013): 505-15. doi:10.1093/qjmed/hct051
Devalia, Vinod et al. “Guidelines for the diagnosis and treatment of cobalamin and folate disorders.” British journal of haematology vol. 166,4 (2014): 496-513. doi:10.1111/bjh.12959
Fedosov, Sergey N et al. “Combined indicator of vitamin B12 status: modification for missing biomarkers and folate status and recommendations for revised cut-points.” Clinical chemistry and laboratory medicine vol. 53,8 (2015): 1215-25. doi:10.1515/cclm-2014-0818
Harrington, Dominic J. “Laboratory assessment of vitamin B12 status.” Journal of clinical pathology vol. 70,2 (2017): 168-173. doi:10.1136/jclinpath-2015-203502
Jatoi, Shazia et al. “Low Vitamin B12 Levels: An Underestimated Cause Of Minimal Cognitive Impairment And Dementia.” Cureus vol. 12,2 e6976. 13 Feb. 2020, doi:10.7759/cureus.6976
Misra, Usha Kant et al. “Oxidative Stress Markers in Vitamin B12 Deficiency.” Molecular neurobiology vol. 54,2 (2017): 1278-1284. doi:10.1007/s12035-016-9736-2
Pagana, Kathleen Deska, et al. Mosby's Diagnostic and Laboratory Test Reference. 15th ed., Mosby, 2021.
Sanz-Cuesta, Teresa et al. “Oral versus intramuscular administration of vitamin B12 for vitamin B12 deficiency in primary care: a pragmatic, randomised, non-inferiority clinical trial (OB12).” BMJ open vol. 10,8 e033687. 20 Aug. 2020, doi:10.1136/bmjopen-2019-033687
Smith, A David et al. “Vitamin B12.” Advances in food and nutrition research vol. 83 (2018): 215-279. doi:10.1016/bs.afnr.2017.11.005
Tanaka, Toshiko et al. “Genome-wide association study of vitamin B6, vitamin B12, folate, and homocysteine blood concentrations.” American journal of human genetics vol. 84,4 (2009): 477-82. doi:10.1016/j.ajhg.2009.02.011
Thakkar, K, and G Billa. “Treatment of vitamin B12 deficiency-methylcobalamine? Cyancobalamine? Hydroxcobalamin?-clearing the confusion.” European journal of clinical nutrition vol. 69,1 (2015): 1-2. doi:10.1038/ejcn.2014.165
Travica, Nikolaj, et al. "Integrative Health Check reveals suboptimal levels in a number of vital biomarkers." Advances in integrative medicine 2.3 (2015): 135-140.
van de Lagemaat, Erik E et al. “Vitamin B12 in Relation to Oxidative Stress: A Systematic Review.” Nutrients vol. 11,2 482. 25 Feb. 2019, doi:10.3390/nu11020482
Vollbracht, C et al. “Supraphysiological vitamin B12 serum concentrations without supplementation: the pitfalls of interpretation.” QJM : monthly journal of the Association of Physicians vol. 113,9 (2020): 619-620. doi:10.1093/qjmed/hcz164
Warendorf, Janna K et al. “Clinical relevance of testing for metabolic vitamin B12 deficiency in patients with polyneuropathy.” Nutritional neuroscience, 1-11. 25 Oct. 2021, doi:10.1080/1028415X.2021.1985751
Wolffenbuttel, B H R et al. “Association of vitamin B12, methylmalonic acid, and functional parameters.” The Netherlands journal of medicine vol. 78,1 (2020): 10-24.
Active B12, Holotranscobalamin
Holotranscobalamin (holoTC) is the bioactive form of vitamin B12, being the primary variant used by cells. It's an effective marker for diagnosing B12 deficiency, often more sensitive than other markers like serum B12, methylmalonic acid (MMA), and homocysteine. However, its use is not standalone; it should be evaluated alongside these other indicators. A decline in holoTC can point to B12 insufficiency, even when total serum B12 appears normal, and it's linked to a range of health issues, including neuropathy, macrocytosis, neural tube defects, and conditions related to vegetarianism or gastrointestinal surgery. High holoTC levels could suggest liver cell damage or conditions like anorexia nervosa.
Standard Range: 25 – 171.00 pmol/L
The ODX Range: 70.00 – 171.00 pmol/L
OPTIMAL DX MEMBERS CLICK HERE for more information on Active Vitamin B12
References
Allen, Lindsay H et al. “Biomarkers of Nutrition for Development (BOND): Vitamin B-12 Review.” The Journal of nutrition vol. 148,suppl_4 (2018): 1995S-2027S. doi:10.1093/jn/nxy201
Bondu, Joseph Dian et al. “Assessing Diagnostic Accuracy of Serum Holotranscobalamin (Active-B12) in Comparison with Other Markers of Vitamin B12 Deficiency.” Indian journal of clinical biochemistry : IJCB vol. 35,3 (2020): 367-372. doi:10.1007/s12291-019-00835-y
Devalia, Vinod et al. “Guidelines for the diagnosis and treatment of cobalamin and folate disorders.” British journal of haematology vol. 166,4 (2014): 496-513. doi:10.1111/bjh.12959
Gropper, Sareen S.; Smith, Jack L.; Carr, Timothy P. Advanced Nutrition and Human Metabolism. 8th edition. Wadsworth Publishing Co Inc. 2021.
Hannibal, Luciana et al. “Biomarkers and Algorithms for the Diagnosis of Vitamin B12 Deficiency.” Frontiers in molecular biosciences vol. 3 27. 27 Jun. 2016, doi:10.3389/fmolb.2016.00027
Jarquin Campos, Araceli et al. “Diagnostic Accuracy of Holotranscobalamin, Vitamin B12, Methylmalonic Acid, and Homocysteine in Detecting B12 Deficiency in a Large, Mixed Patient Population.” Disease markers vol. 2020 7468506. 7 Feb. 2020, doi:10.1155/2020/7468506
Lee, Young Kyung et al. “Holotranscobalamin as an indicator of vitamin B12 deficiency in gastrectomized patients.” Annals of clinical and laboratory science vol. 39,4 (2009): 361-6.
Nexo, Ebba, and Elke Hoffmann-Lücke. “Holotranscobalamin, a marker of vitamin B-12 status: analytical aspects and clinical utility.” The American journal of clinical nutrition vol. 94,1 (2011): 359S-365S. doi:10.3945/ajcn.111.013458
Ray, Joel G et al. “Vitamin B12 and the risk of neural tube defects in a folic-acid-fortified population.” Epidemiology (Cambridge, Mass.) vol. 18,3 (2007): 362-6. doi:10.1097/01.ede.0000257063.77411.e9
Smith, A David et al. “Vitamin B12.” Advances in food and nutrition research vol. 83 (2018): 215-279. doi:10.1016/bs.afnr.2017.11.005
Tam, Friederike I., et al. "Liver and vitamin B12 parameters in patients with anorexia nervosa before and after short-term weight restoration." Psychiatry Research (2022): 114673.
Verma, Abhishek, et al. "Comparison of Serum Holotranscobalamin with Serum Vitamin B12 in Population Prone to Megaloblastic Anemia and their Correlation with Nerve Conduction Study." Indian Journal of Clinical Biochemistry (2022): 1-9.
Methylmalonic Acid (MMA)
Methylmalonic acid (MMA) is a marker of vitamin B12 insufficiency, as well as an indicator of oxidative stress, mitochondrial dysfunction, and renal function decline. While elevated MMA often signifies a B12 deficiency, it should not be the sole marker used, but rather evaluated alongside others such as holotranscobalamin, homocysteine, and serum B12. Elevated MMA has been linked to numerous health concerns, including renal dysfunction, diabetes, neuropathy, migraines, and increased mortality risk. In contrast, low MMA typically indicates adequate B12 status and is not considered clinically significant. MMA plays a role in various biochemical processes and can be influenced by factors such as aging and drug usage.
Standard Range: 0.00 – 318 nmol/L
The ODX Range: 0.00 – 260.00 nmol/L
OPTIMAL DX MEMBERS CLICK HERE for more information on Methylmalonic Acid
References
Harrington, Dominic J. “Laboratory assessment of vitamin B12 status.” Journal of clinical pathology vol. 70,2 (2017): 168-173. doi:10.1136/jclinpath-2015-203502
Keyfi, Fatemeh et al. “Methylmalonic Acidemia Diagnosis by Laboratory Methods.” Reports of biochemistry & molecular biology vol. 5,1 (2016): 1-14.
Pagana, Kathleen Deska, et al. Mosby's Diagnostic and Laboratory Test Reference. 15th ed., Mosby, 2021.
Polytarchou, Kali et al. “Methylmalonic acid and vitamin B12 in patients with heart failure.” Hellenic journal of cardiology : HJC = Hellenike kardiologike epitheorese vol. 61,5 (2020): 330-337. doi:10.1016/j.hjc.2019.10.010
Riphagen, Ineke J et al. “Methylmalonic acid, vitamin B12, renal function, and risk of all-cause mortality in the general population: results from the prospective Lifelines-MINUTHE study.” BMC medicine vol. 18,1 380. 10 Dec. 2020, doi:10.1186/s12916-020-01853-x
Smith, A David et al. “Vitamin B12.” Advances in food and nutrition research vol. 83 (2018): 215-279. doi:10.1016/bs.afnr.2017.11.005
Togha, Mansoureh et al. “Serum Vitamin B12 and Methylmalonic Acid Status in Migraineurs: A Case-Control Study.” Headache vol. 59,9 (2019): 1492-1503. doi:10.1111/head.13618
Vashi, Pankaj et al. “Methylmalonic Acid and Homocysteine as Indicators of Vitamin B-12 Deficiency in Cancer.” PloS one vol. 11,1 e0147843. 25 Jan. 2016, doi:10.1371/journal.pone.0147843
Wile, Daryl J, and Cory Toth. “Association of metformin, elevated homocysteine, and methylmalonic acid levels and clinically worsened diabetic peripheral neuropathy.” Diabetes care vol. 33,1 (2010): 156-61. doi:10.2337/dc09-0606
Wolffenbuttel, B H R et al. “Association of vitamin B12, methylmalonic acid, and functional parameters.” The Netherlands journal of medicine vol. 78,1 (2020): 10-24.
Vitamin C
Vitamin C is an essential nutrient for humans, while most other mammals produce their own. It plays a critical role as an antioxidant and cofactor in several metabolic functions. Vitamin C is essential for neurotransmitter and collagen synthesis, and its insufficiency can lead to issues ranging from poor wound healing and infections to scurvy and cardiac death. Low levels of this vitamin can be associated with a wide array of conditions, such as atherosclerosis, compromised blood vessel integrity, scurvy, arthralgia, myalgia, and oxidative stress. Conversely, high levels are linked to high-dose intake and can potentially cause calcium oxalate crystal and stone formation. Regulating and maintaining healthy vitamin C levels is crucial as it impacts numerous aspects of metabolic and systemic health.
The ODX Range: 1.30 – 4.00 mg/dL (73.81 – 227.12 µmol/L)
OPTIMAL DX MEMBERS CLICK HERE for more information on Vitamin C
References
Amisha, Fnu et al. “Scurvy in the Modern World: Extinct or Not?.” Cureus vol. 14,2 e22622. 26 Feb. 2022, doi:10.7759/cureus.22622
Gropper, Sareen S.; Smith, Jack L.; Carr, Timothy P. Advanced Nutrition and Human Metabolism. 8th edition. Wadsworth Publishing Co Inc. 2021.
Klimant, E et al. “Intravenous vitamin C in the supportive care of cancer patients: a review and rational approach.” Current oncology (Toronto, Ont.) vol. 25,2 (2018): 139-148. doi:10.3747/co.25.3790
Levine, Mark et al. “Vitamin C: a concentration-function approach yields pharmacology and therapeutic discoveries.” Advances in nutrition (Bethesda, Md.) vol. 2,2 (2011): 78-88. doi:10.3945/an.110.000109
Lykkesfeldt, Jens, and Anitra C. Carr. “Vitamin C.” Advancesin Nutrition, vol. 15, no. 1, 2024, article 100155, ScienceDirect,doi.org/10.1016/j.advnut.2023.100155
Maxfield, Luke. and Jonathan S. Crane. “Vitamin C Deficiency.” StatPearls, StatPearls Publishing, 4 July 2022.
McRae, Marc P. “Vitamin C supplementation lowers serum low-density lipoprotein cholesterol and triglycerides: a meta-analysis of 13 randomized controlled trials.” Journal of chiropractic medicine vol. 7,2 (2008): 48-58. doi:10.1016/j.jcme.2008.01.002
Pagana, Kathleen Deska, et al. Mosby's Diagnostic and Laboratory Test Reference. 15th ed., Mosby, 2021.
Padayatty, S J, and M Levine. “Vitamin C: the known and the unknown and Goldilocks.” Oral diseases vol. 22,6 (2016): 463-93. doi:10.1111/odi.12446
Wilson, Renée et al. “Inadequate Vitamin C Status in Prediabetes and Type 2 Diabetes Mellitus: Associations with Glycaemic Control, Obesity, and Smoking.” Nutrients vol. 9,9 997. 9 Sep. 2017, doi:10.3390/nu9090997
Xiong, Ruilin et al. “Micronutrients and Diabetic Retinopathy: Evidence From The National Health and Nutrition Examination Survey and a Meta-analysis.” American journal of ophthalmology vol. 238 (2022): 141-156. doi:10.1016/j.ajo.2022.01.005
Vitamin A
Vitamin A, a crucial fat-soluble vitamin, is essential for maintaining skin, gastrointestinal, immune, and reproductive health. It can be obtained from the diet either preformed or converted from plant-based precursors such as beta-carotene. Vitamin A deficiency can lead to infections, skin disorders, vision impairment, growth issues, and other health complications, while excess intake can cause liver damage, bone disorders, and other severe symptoms. Dietary sources of vitamin A include both animal-based products like liver, fish, and dairy, and plant-based products like leafy greens and orange vegetables. Ensuring an optimal level of vitamin A is crucial for preserving immune competence, skin integrity, and overall health.
Standard Range: 38.00 – 98.00 µg/dL (1.33 – 3.42 µmol/L)
The ODX Range: 57.00 – 66.00 µg/dL (1.99 – 2.30 µmol/L)
OPTIMAL DX MEMBERS CLICK HERE for more information on Vitamin A
References
de Pee, Saskia, and Omar Dary. “Biochemical indicators of vitamin A deficiency: serum retinol and serum retinol binding protein.” The Journal of nutrition vol. 132,9 Suppl (2002): 2895S-2901S. doi:10.1093/jn/132.9.2895S
Greaves, Ronda F et al. “Laboratory medicine best practice guideline: vitamins a, e and the carotenoids in blood.” The Clinical biochemist. Reviews vol. 35,2 (2014): 81-113.
Huang, Zhiyi et al. “Role of Vitamin A in the Immune System.” Journal of clinical medicine vol. 7,9 258. 6 Sep. 2018, doi:10.3390/jcm7090258
Lietz, Georg et al. “Single nucleotide polymorphisms upstream from the β-carotene 15,15'-monoxygenase gene influence provitamin A conversion efficiency in female volunteers.” The Journal of nutrition vol. 142,1 (2012): 161S-5S. doi:10.3945/jn.111.140756
Olson, Jazmine M., et al. “Vitamin A Toxicity.” StatPearls, StatPearls Publishing, 11 July 2022.
Pagana, Kathleen Deska, et al. Mosby's Diagnostic and Laboratory Test Reference. 15th ed., Mosby, 2021.
Polcz, Monica E, and Adrian Barbul. “The Role of Vitamin A in Wound Healing.” Nutrition in clinical practice : official publication of the American Society for Parenteral and Enteral Nutrition vol. 34,5 (2019): 695-700. doi:10.1002/ncp.10376
Sommer, Alfred. “Vitamin a deficiency and clinical disease: an historical overview.” The Journal of nutrition vol. 138,10 (2008): 1835-9. doi:10.1093/jn/138.10.1835
Wiseman, Elina Manusevich et al. “The vicious cycle of vitamin a deficiency: A review.” Critical reviews in food science and nutrition vol. 57,17 (2017): 3703-3714. doi:10.1080/10408398.2016.1160362
Wu, Ai-Min et al. “The relationship between vitamin A and risk of fracture: meta-analysis of prospective studies.” Journal of bone and mineral research : the official journal of the American Society for Bone and Mineral Research vol. 29,9 (2014): 2032-9. doi:10.1002/jbmr.2237
Vitamin B6
Vitamin B6, primarily in the form of pyridoxal 5’ phosphate, is an essential micronutrient involved in over 100 metabolic functions, particularly in protein, carbohydrate, and lipid metabolism, and neurotransmitter synthesis. Vitamin B6 deficiency is associated with altered mental status, neuropathy, diabetes, skin disorders, and complications during pregnancy, whereas an excess can result in neuropathy, pain, balance issues, nausea, and heartburn. This vitamin is obtained from foods like meat and plants, with the plant-derived form needing conversion in the body to be functional. Evaluating B6 status is important as levels can be affected by multiple factors, including inflammation, alcohol intake, and renal function. Both deficiency and excess of B6 can negatively affect health, underscoring the importance of maintaining an appropriate balance.
Standard Range: 5.1 – 54.8 ng/mL (20.63 – 221.72 nmol/L)
The ODX Range: 12.36 – 54.8 ng/mL (50.01 – 221.72 nmol/L)
OPTIMAL DX MEMBERS CLICK HERE for more information on Vitamin B6
References
Abosamak, NourEldin R. and Vikas Gupta. “Vitamin B6 (Pyridoxine).” StatPearls, StatPearls Publishing, 23 May 2022.
Bjørke-Monsen, Anne-Lise, and Per Magne Ueland. “Vitamin B6: a scoping review for Nordic Nutrition Recommendations 2023.” Food & nutrition research vol. 67 10.29219/fnr.v67.10259. 19 Dec. 2023, doi:10.29219/fnr.v67.10259
Brown, Mary J., et al. “Vitamin B6 Deficiency.” StatPearls, StatPearls Publishing, 18 July 2022.
Houston, Mark C. “Nutrition and nutraceutical supplements in the treatment of hypertension.” Expert review of cardiovascular therapy vol. 8,6 (2010): 821-33. doi:10.1586/erc.10.63
Li, Zhihao et al. “Vitamin B6 as a novel risk biomarker of fractured ankles.” Medicine vol. 100,40 (2021): e27442. doi:10.1097/MD.0000000000027442
Mascolo, Elisa, and Fiammetta Vernì. “Vitamin B6 and Diabetes: Relationship and Molecular Mechanisms.” International journal of molecular sciences vol. 21,10 3669. 23 May. 2020, doi:10.3390/ijms21103669
Morris, Martha Savaria et al. “Plasma pyridoxal 5'-phosphate in the US population: the National Health and Nutrition Examination Survey, 2003-2004.” The American journal of clinical nutrition vol. 87,5 (2008): 1446-54. doi:10.1093/ajcn/87.5.1446
Pagana, Kathleen Deska, et al. Mosby's Diagnostic and Laboratory Test Reference. 15th ed., Mosby, 2021.
Paul, Ligi et al. “Mechanistic perspective on the relationship between pyridoxal 5'-phosphate and inflammation.” Nutrition reviews vol. 71,4 (2013): 239-44. doi:10.1111/nure.12014
Sakakeeny, Lydia et al. “Plasma pyridoxal-5-phosphate is inversely associated with systemic markers of inflammation in a population of U.S. adults.” The Journal of nutrition vol. 142,7 (2012): 1280-5. doi:10.3945/jn.111.153056
Stach, Kamilla et al. “Vitamin B6 in Health and Disease.” Nutrients vol. 13,9 3229. 17 Sep. 2021, doi:10.3390/nu13093229
Ueland, Per Magne et al. “Direct and Functional Biomarkers of Vitamin B6 Status.” Annual review of nutrition vol. 35 (2015): 33-70. doi:10.1146/annurev-nutr-071714-034330
Ueland, Per Magne et al. “Inflammation, vitamin B6 and related pathways.” Molecular aspects of medicine vol. 53 (2017): 10-27. doi:10.1016/j.mam.2016.08.001
Wilson, Matthew P et al. “Disorders affecting vitamin B6 metabolism.” Journal of inherited metabolic disease vol. 42,4 (2019): 629-646. doi:10.1002/jimd.12060
Wu, Z., et al. "Vitamin B6 Reference Intervals: What We Learned from a Retrospective Data Analysis." Journal of the Academy of Nutrition and Dietetics 124.10 (2024): A22.
Start creating true practice success. An Optimal DX account will help you deliver insights into your patient’s health and generate intuitive, comprehensive Functional Health Reports and customer blood test-specific treatment plans.
White Paper
Read our white paper"What Is Optimal - Striving for Optimal Blood Chemistry Results and Optimal Health". At the heart of this whitepaper is a thorough review of the ways standard reference ranges are established and why optimal ranges work better for the Functional Medicine practice. To demonstrate this concept of optimal ranges we review 6 representative biomarkers: Glucose, Homocysteine, Iron, TSH, Vitamin D and Magnesium.

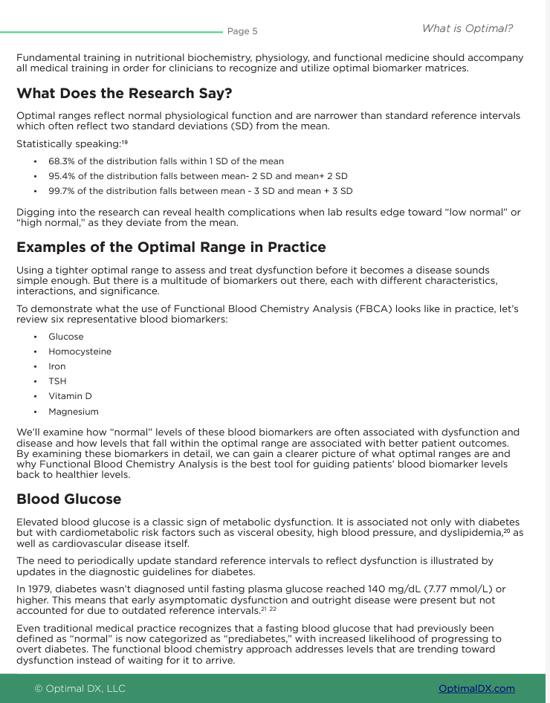
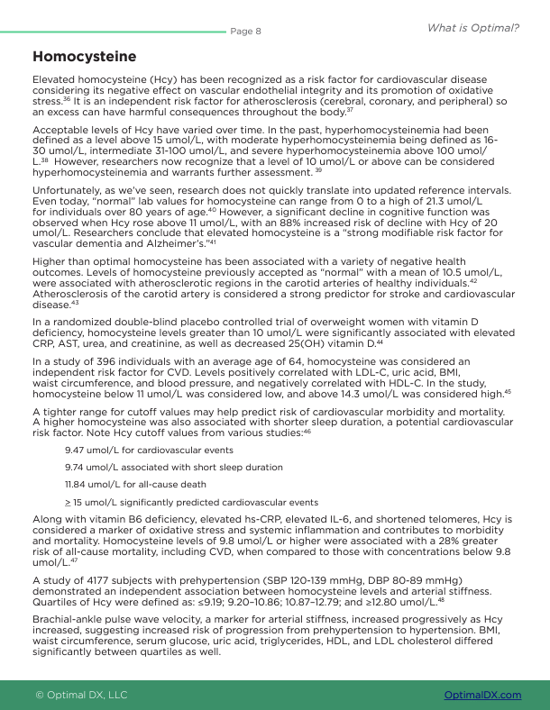
Guide
Interested in Functional Blood Chemistry Analysis but don't know how to start? This guide walks you through setting up FBCA in your practice.


Guide
Read Optimal DX's insider guide to blood biomarkers — an informative introduction to Functional Blood Chemistry Analysis, commonly analyzed blood biomarkers and their relationship to dysfunction.
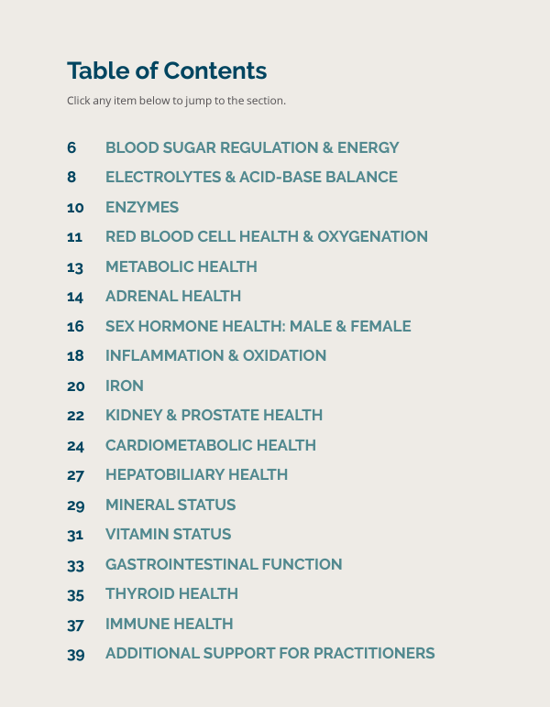
White Paper
Read our white paperon endothelial dysfunction, a pathological state that underlies many diseases and conditions, and discover how Functional Blood Chemistry Analysis can help.

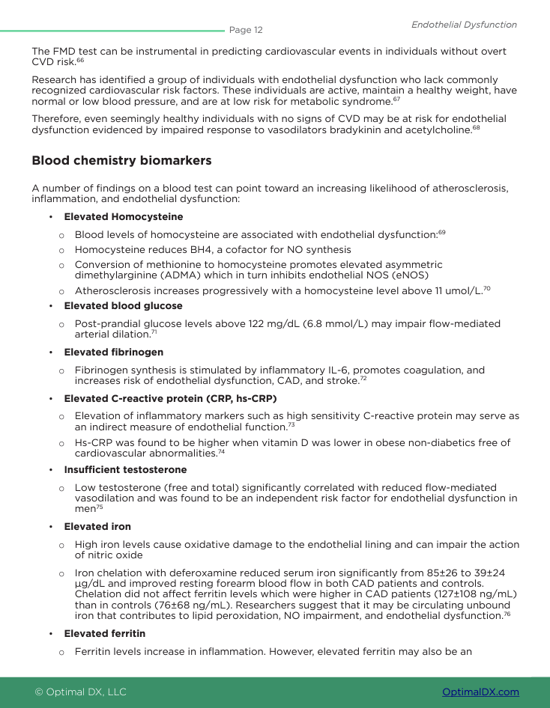
White Paper
Blood glucose dysregulation is at epidemic proportions, especially insulin resistance. Learn the Functional takeaways to insulin resistance in this white paper.