







Learn more about the 16 different report modules available to you when generating your Functional Health Report.

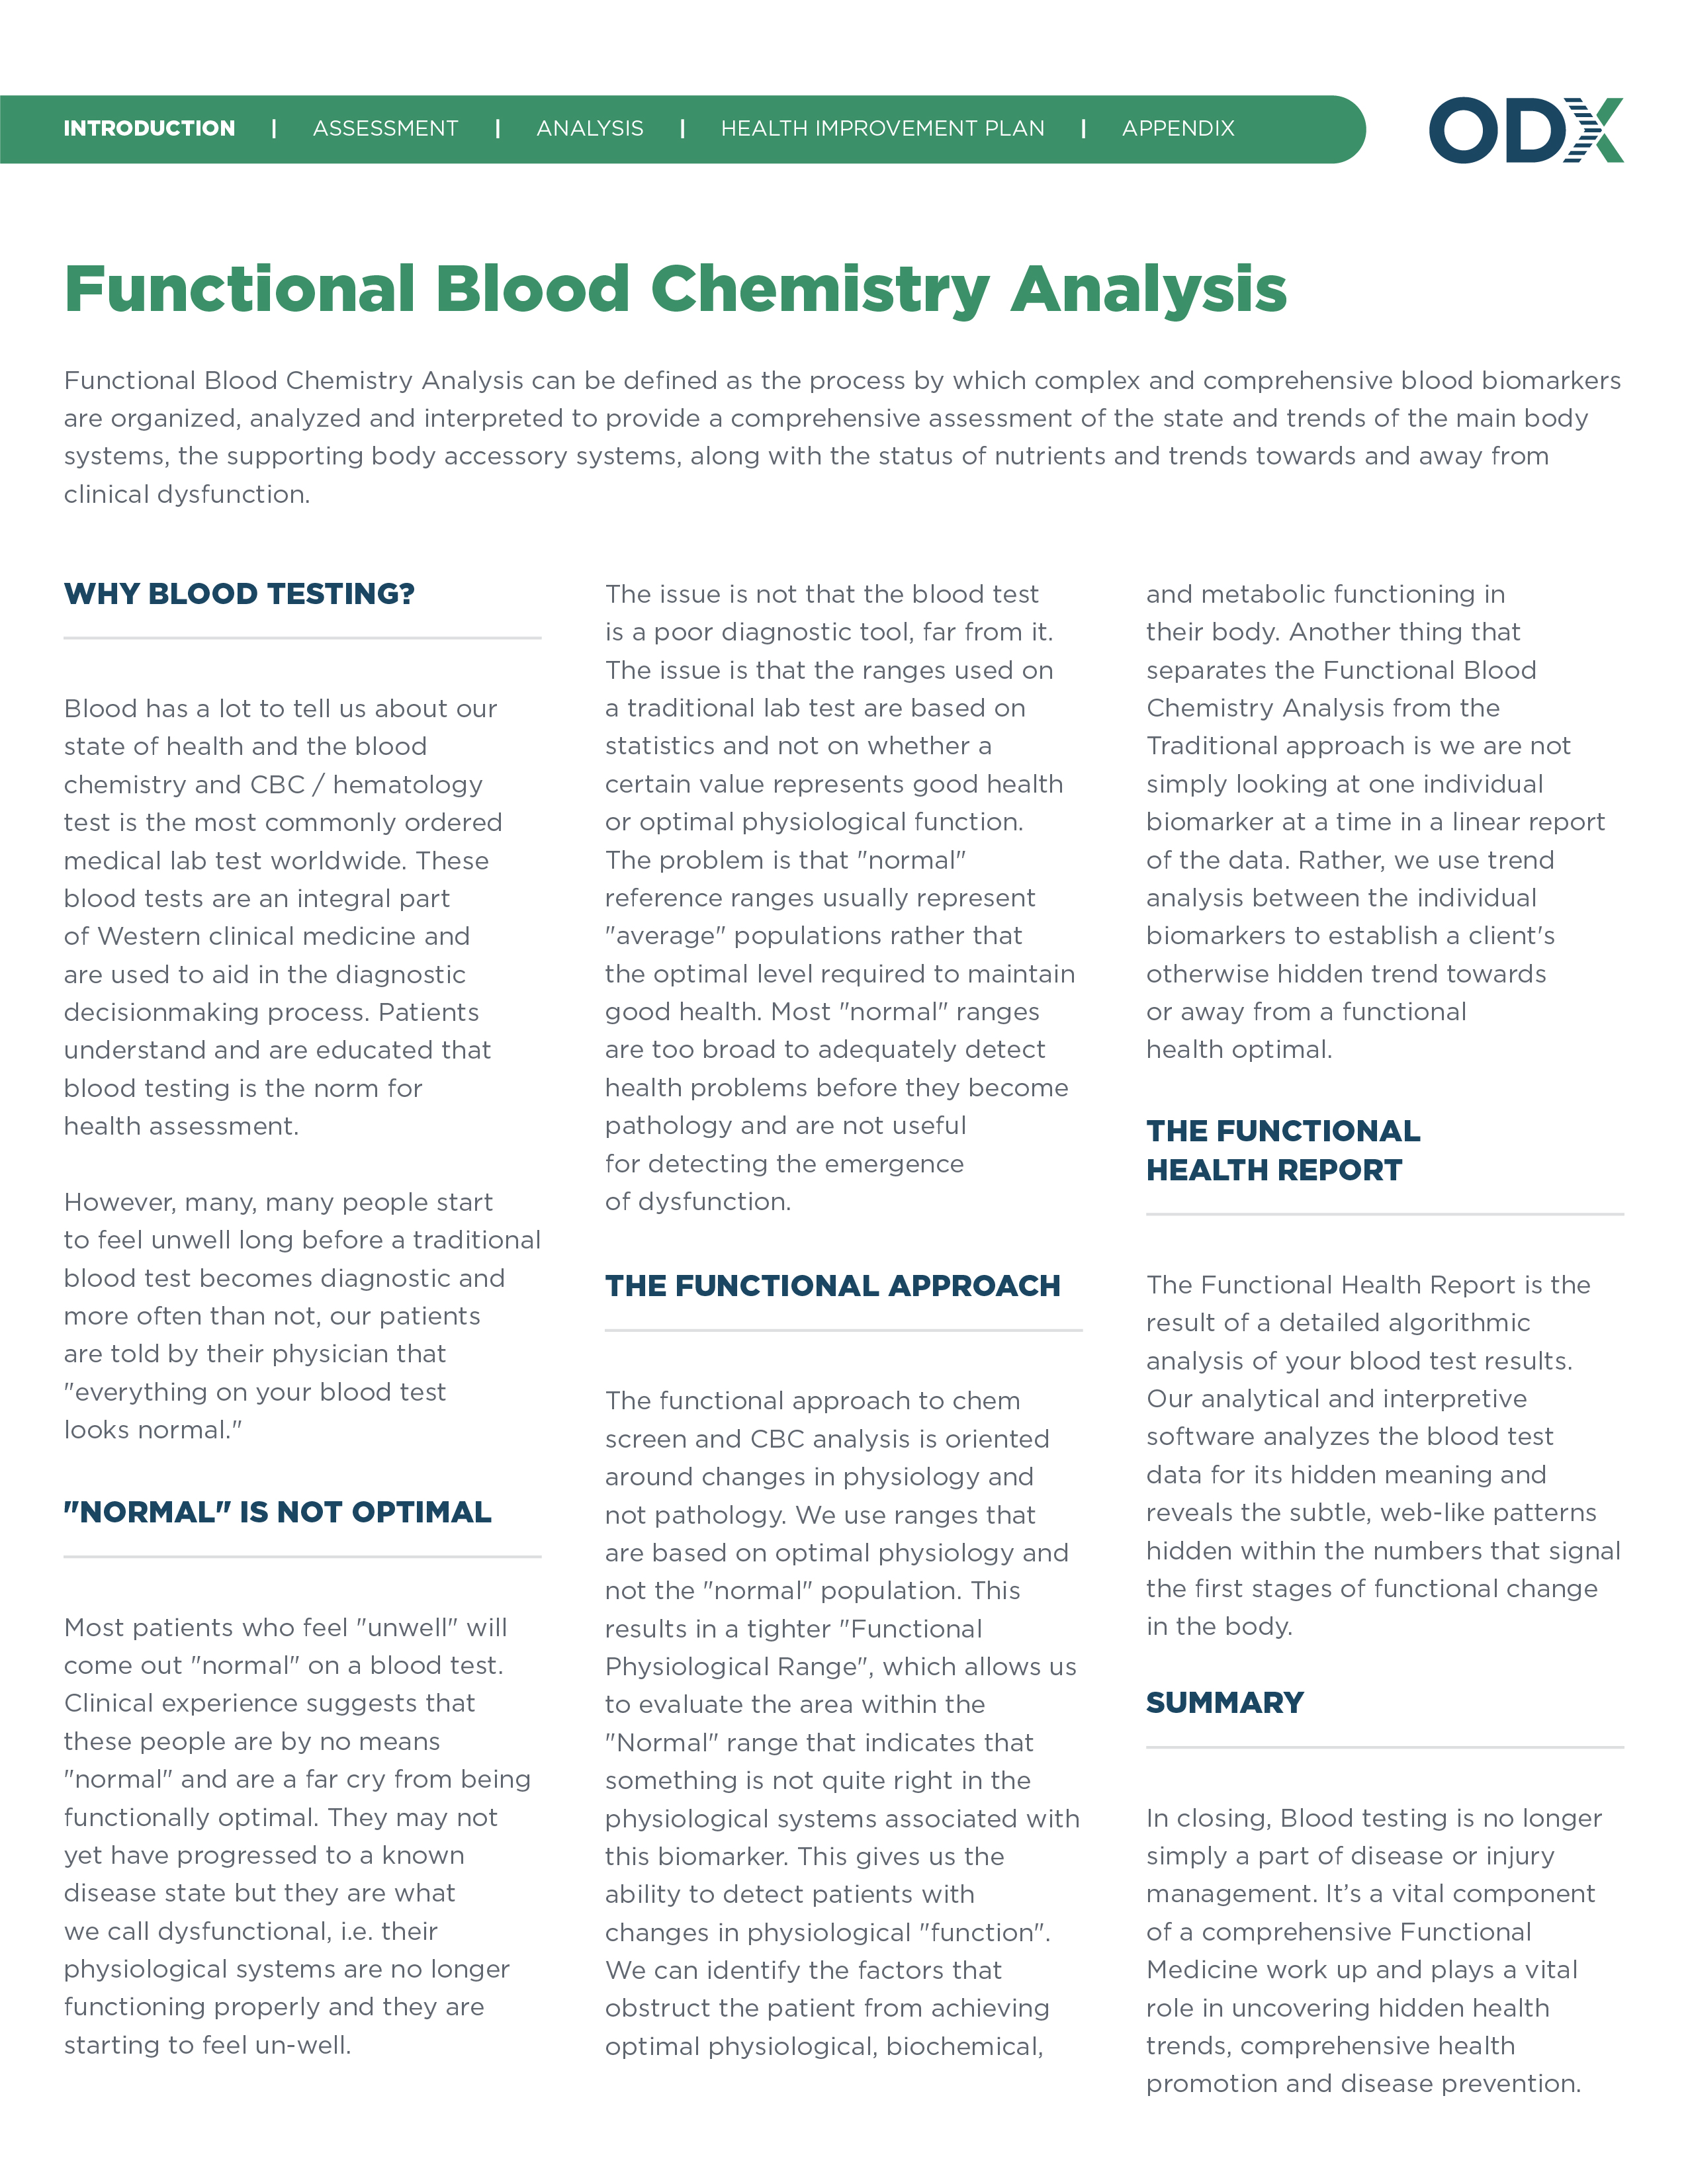
Provide a simple, easy-to-understand overview of the functional approach to blood chemistry analysis to your patients. With the right context, patients will more clearly see the value of their Functional Health Report.

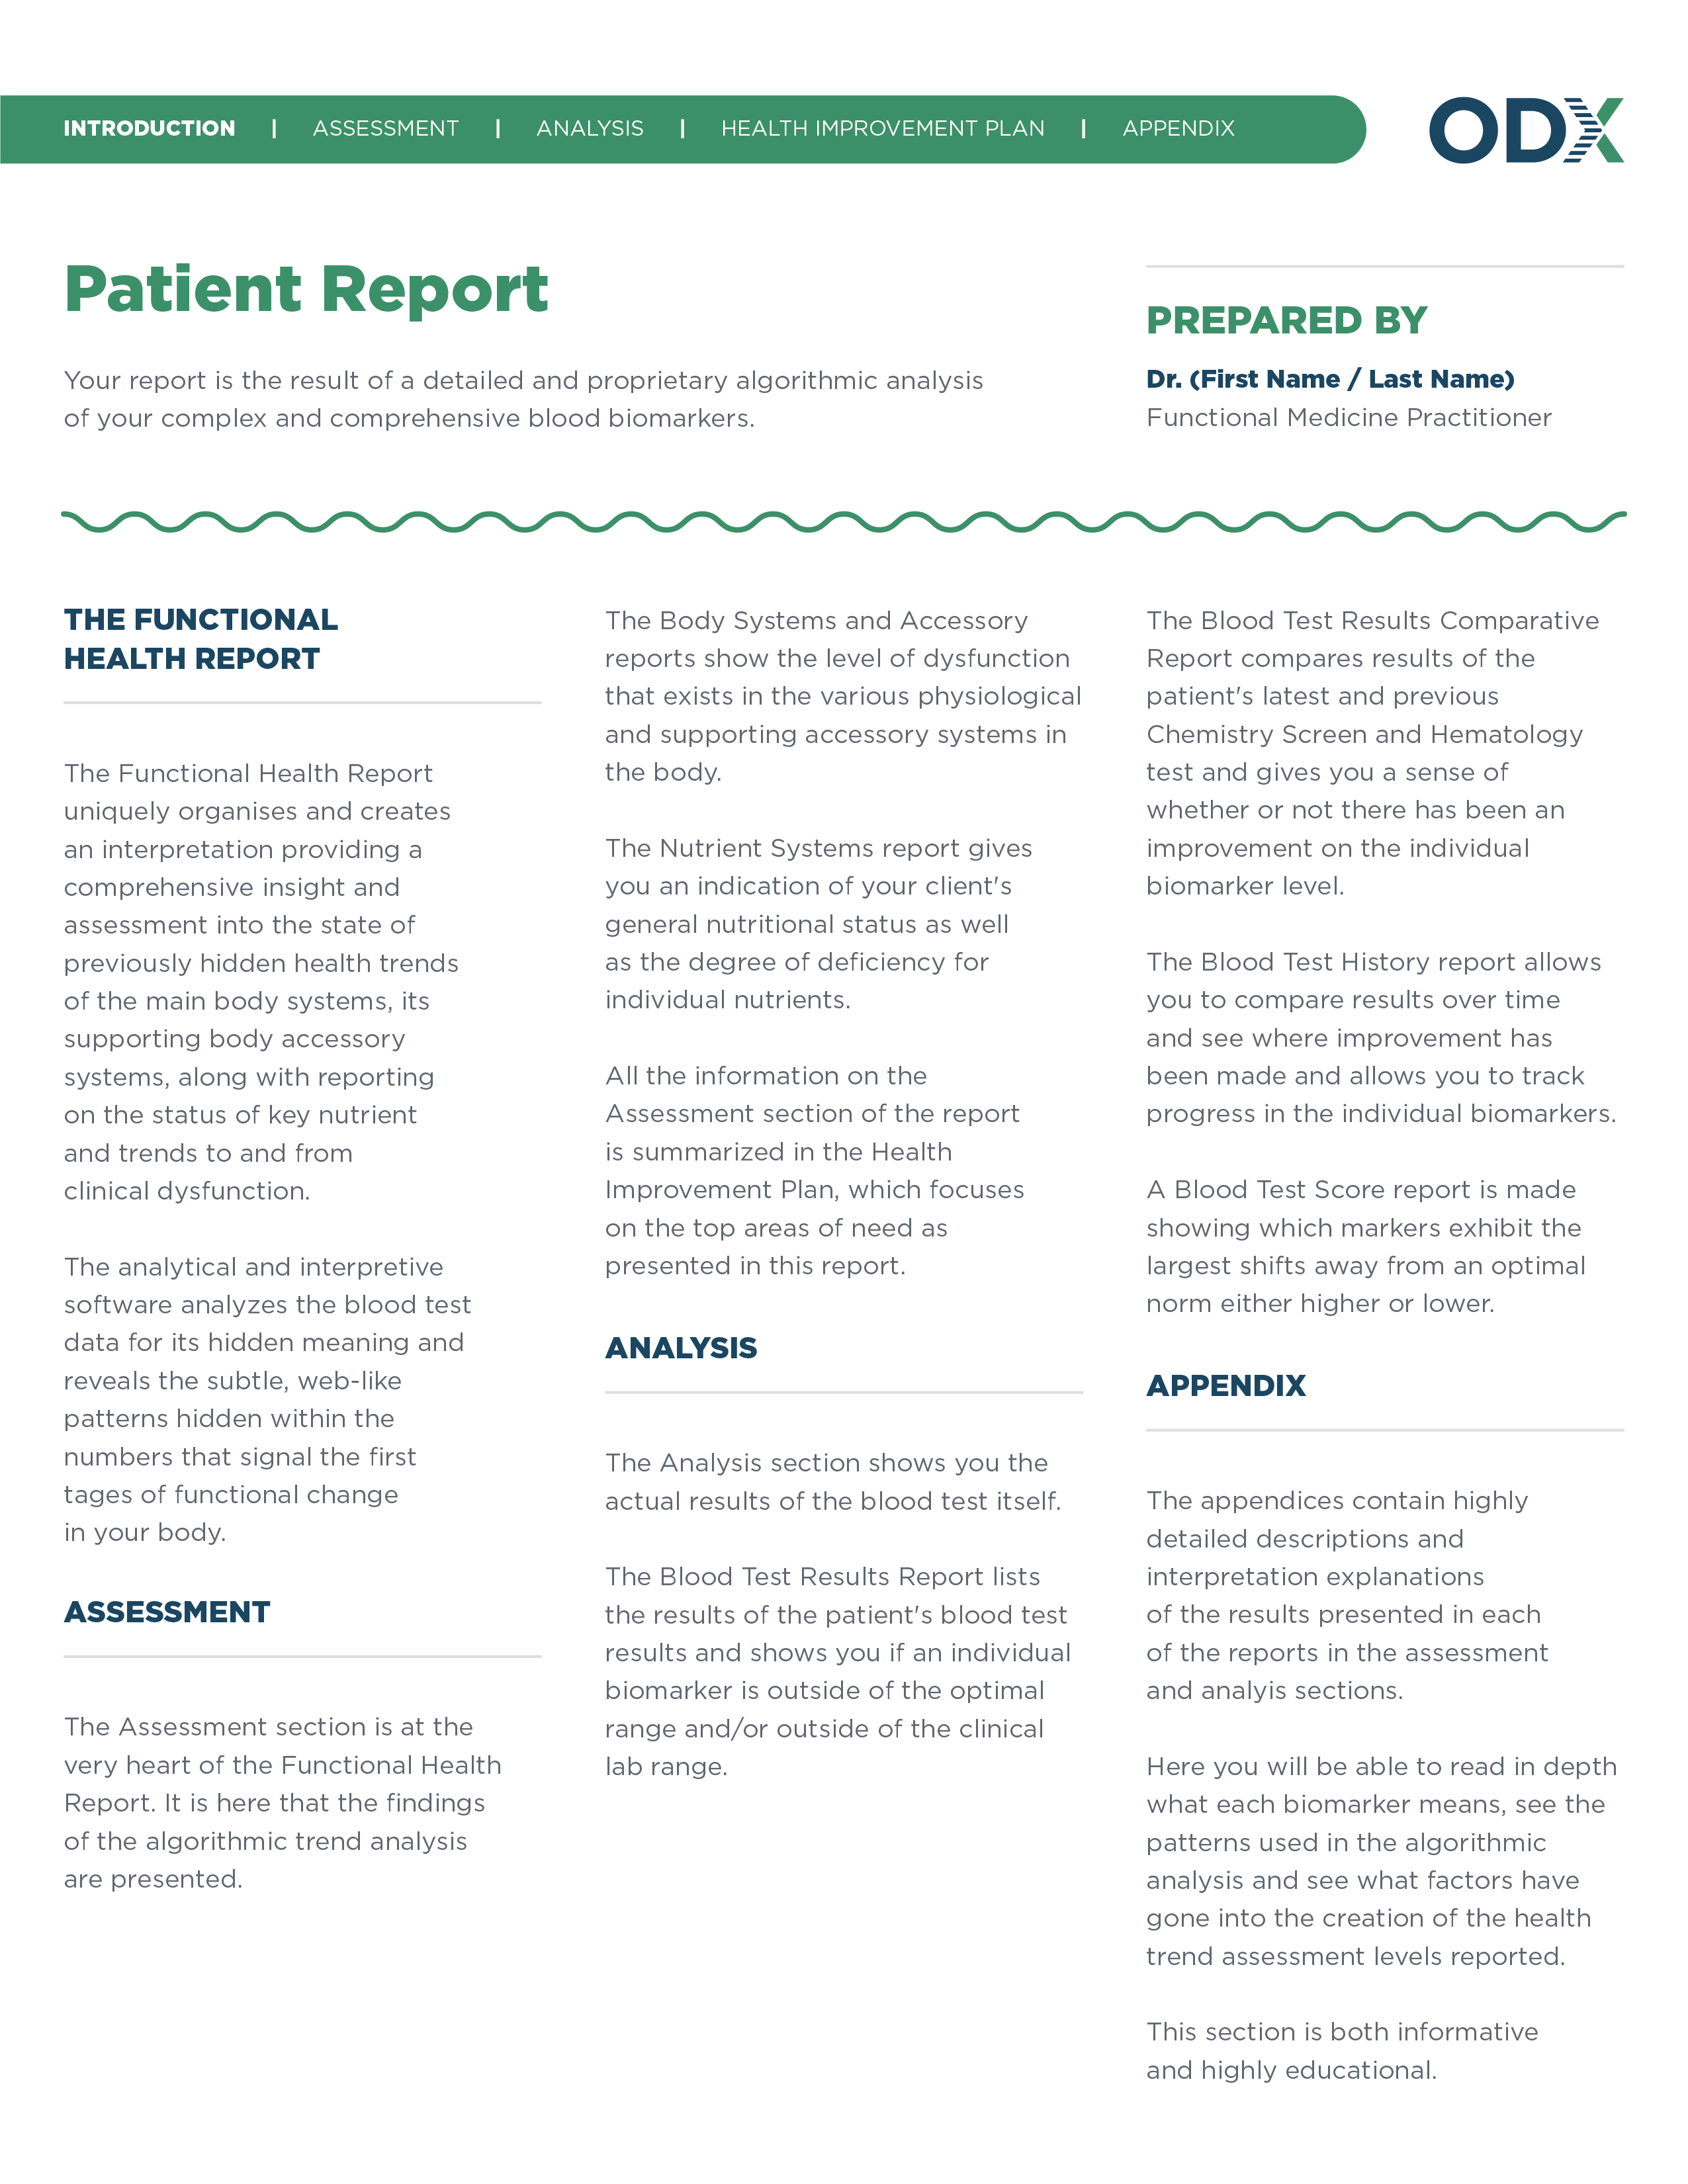
Introduce the modules in the Functional Health Report so your patients can easily interpret and digest the information contained within.

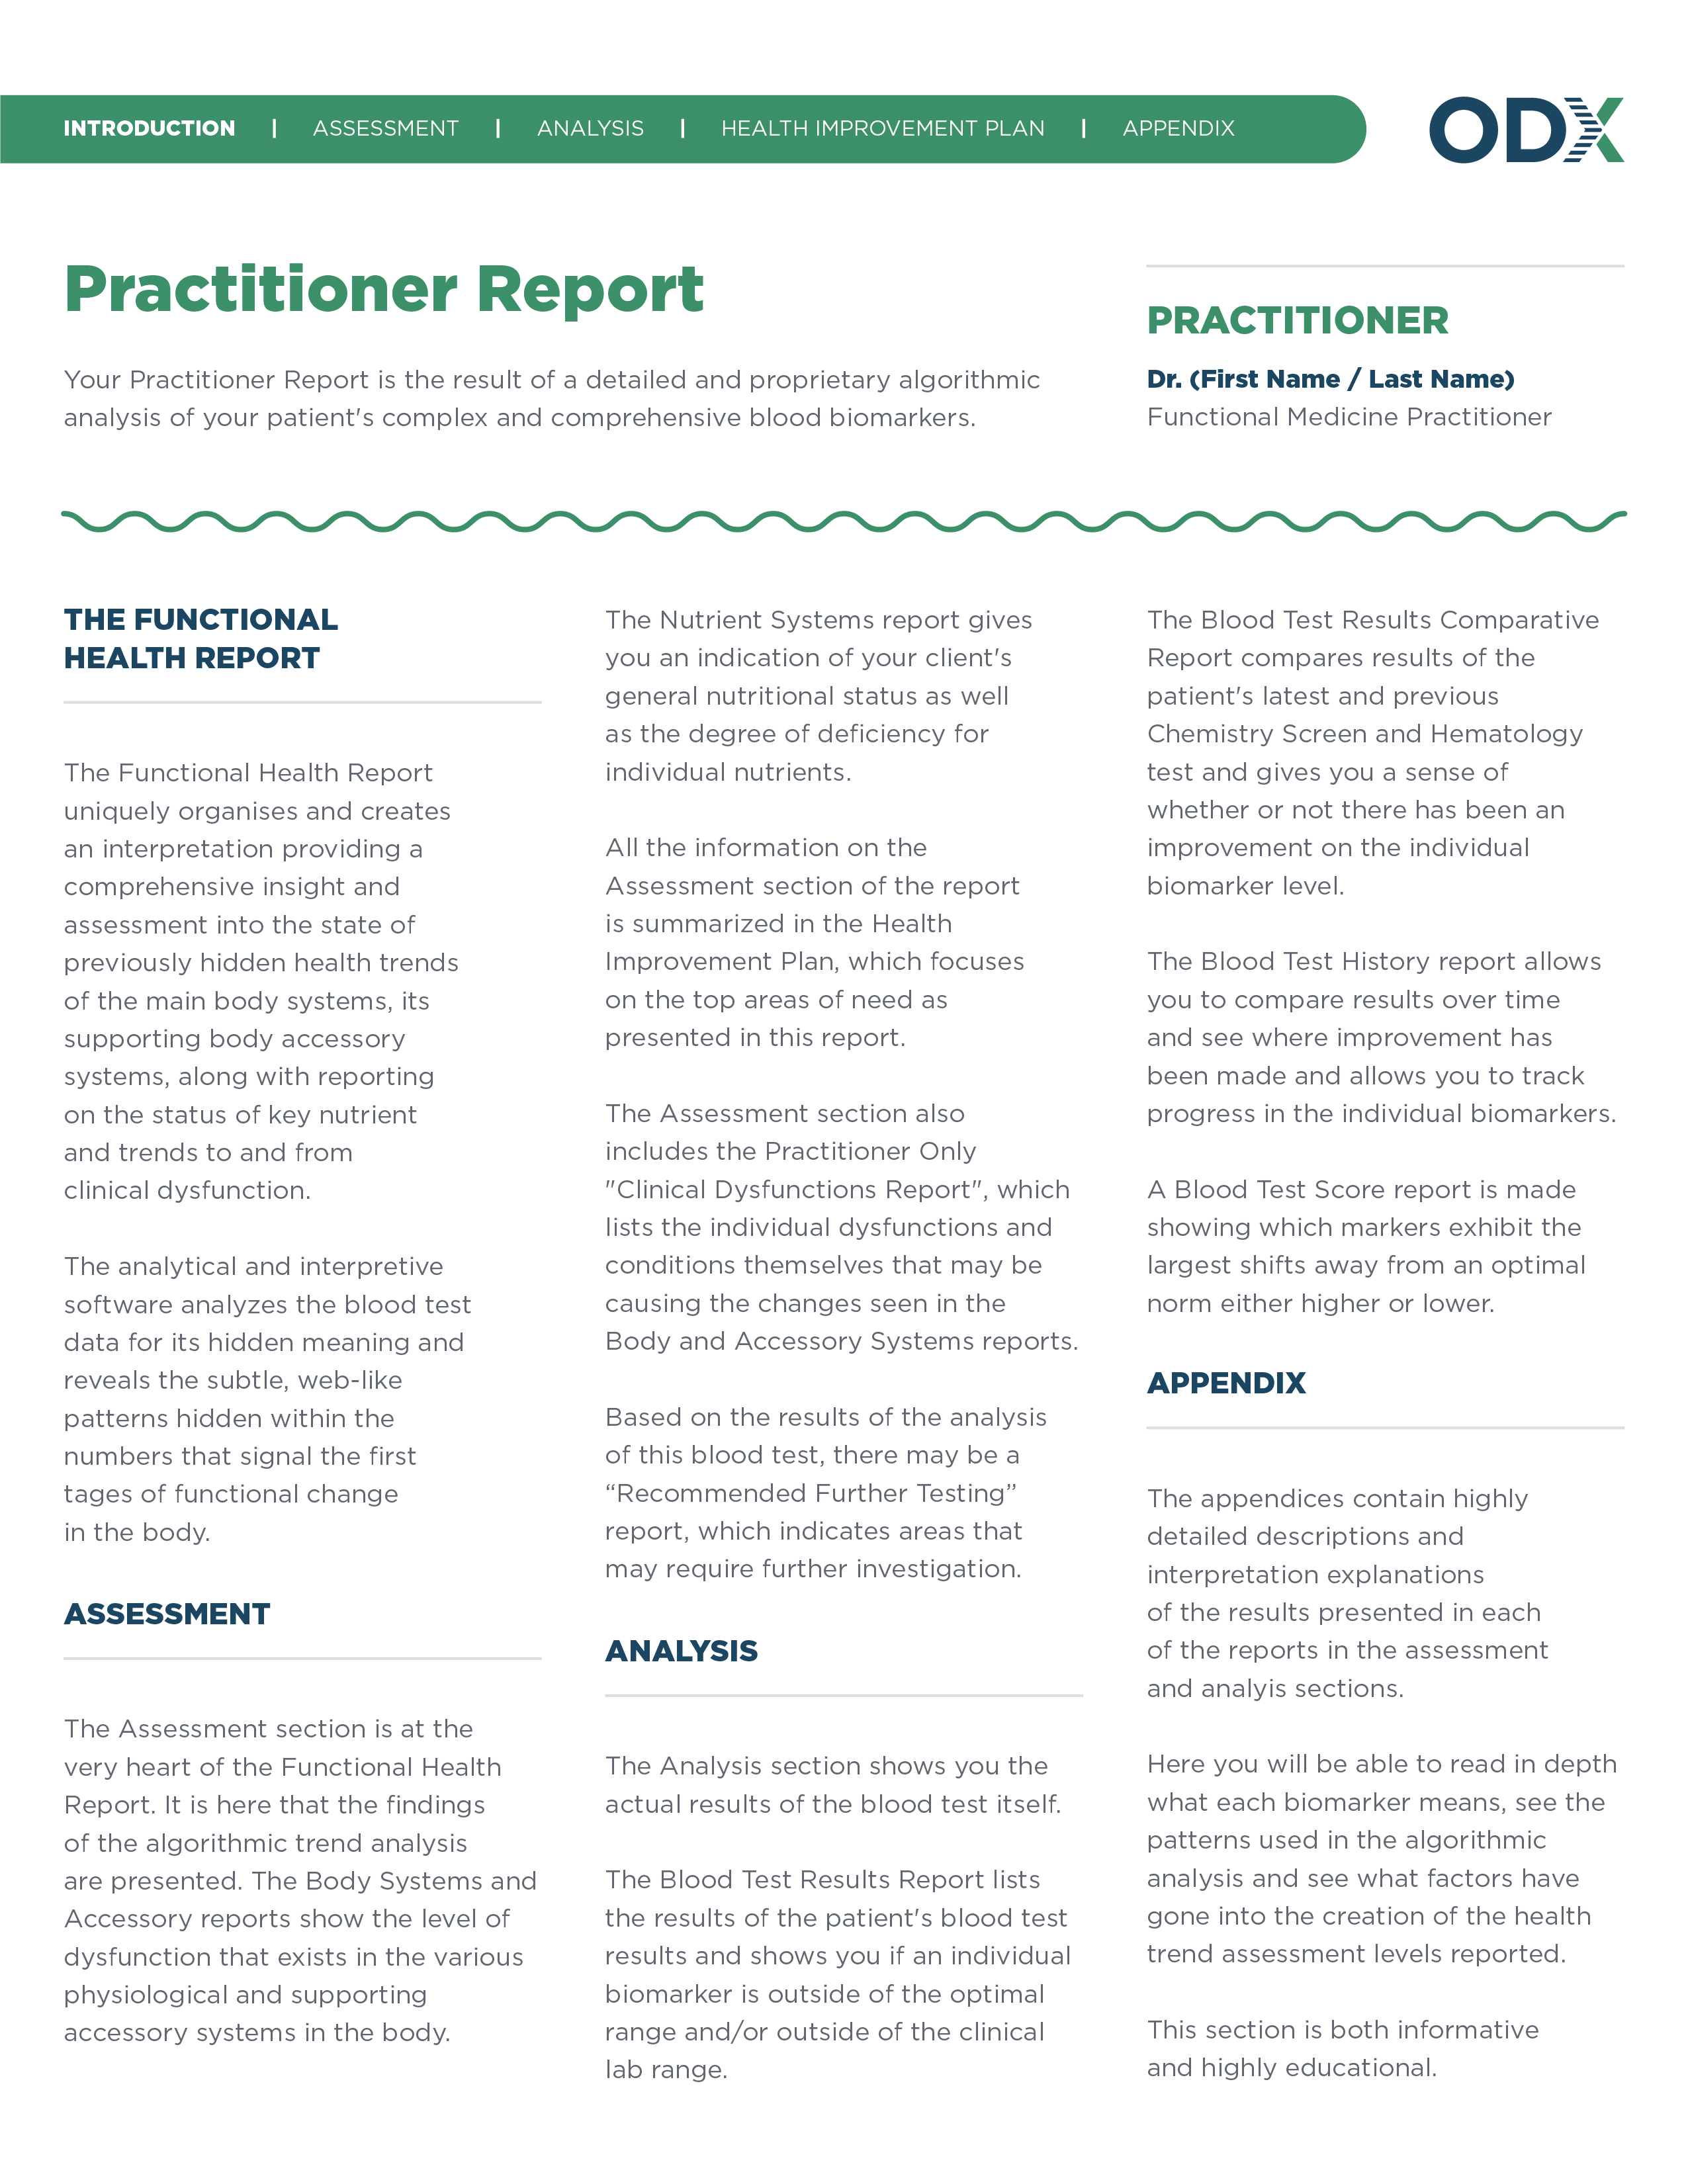
Contextualize the Functional Health Report so that you or other practitioners are equipped with the knowledge to interpret its information.

Add your own notes to deliver alongside the Functional Health Report to your patients. You can call out important information, detail your treatment plan, explain the report further or add any information you feel is relevant to your patients’ health journey.
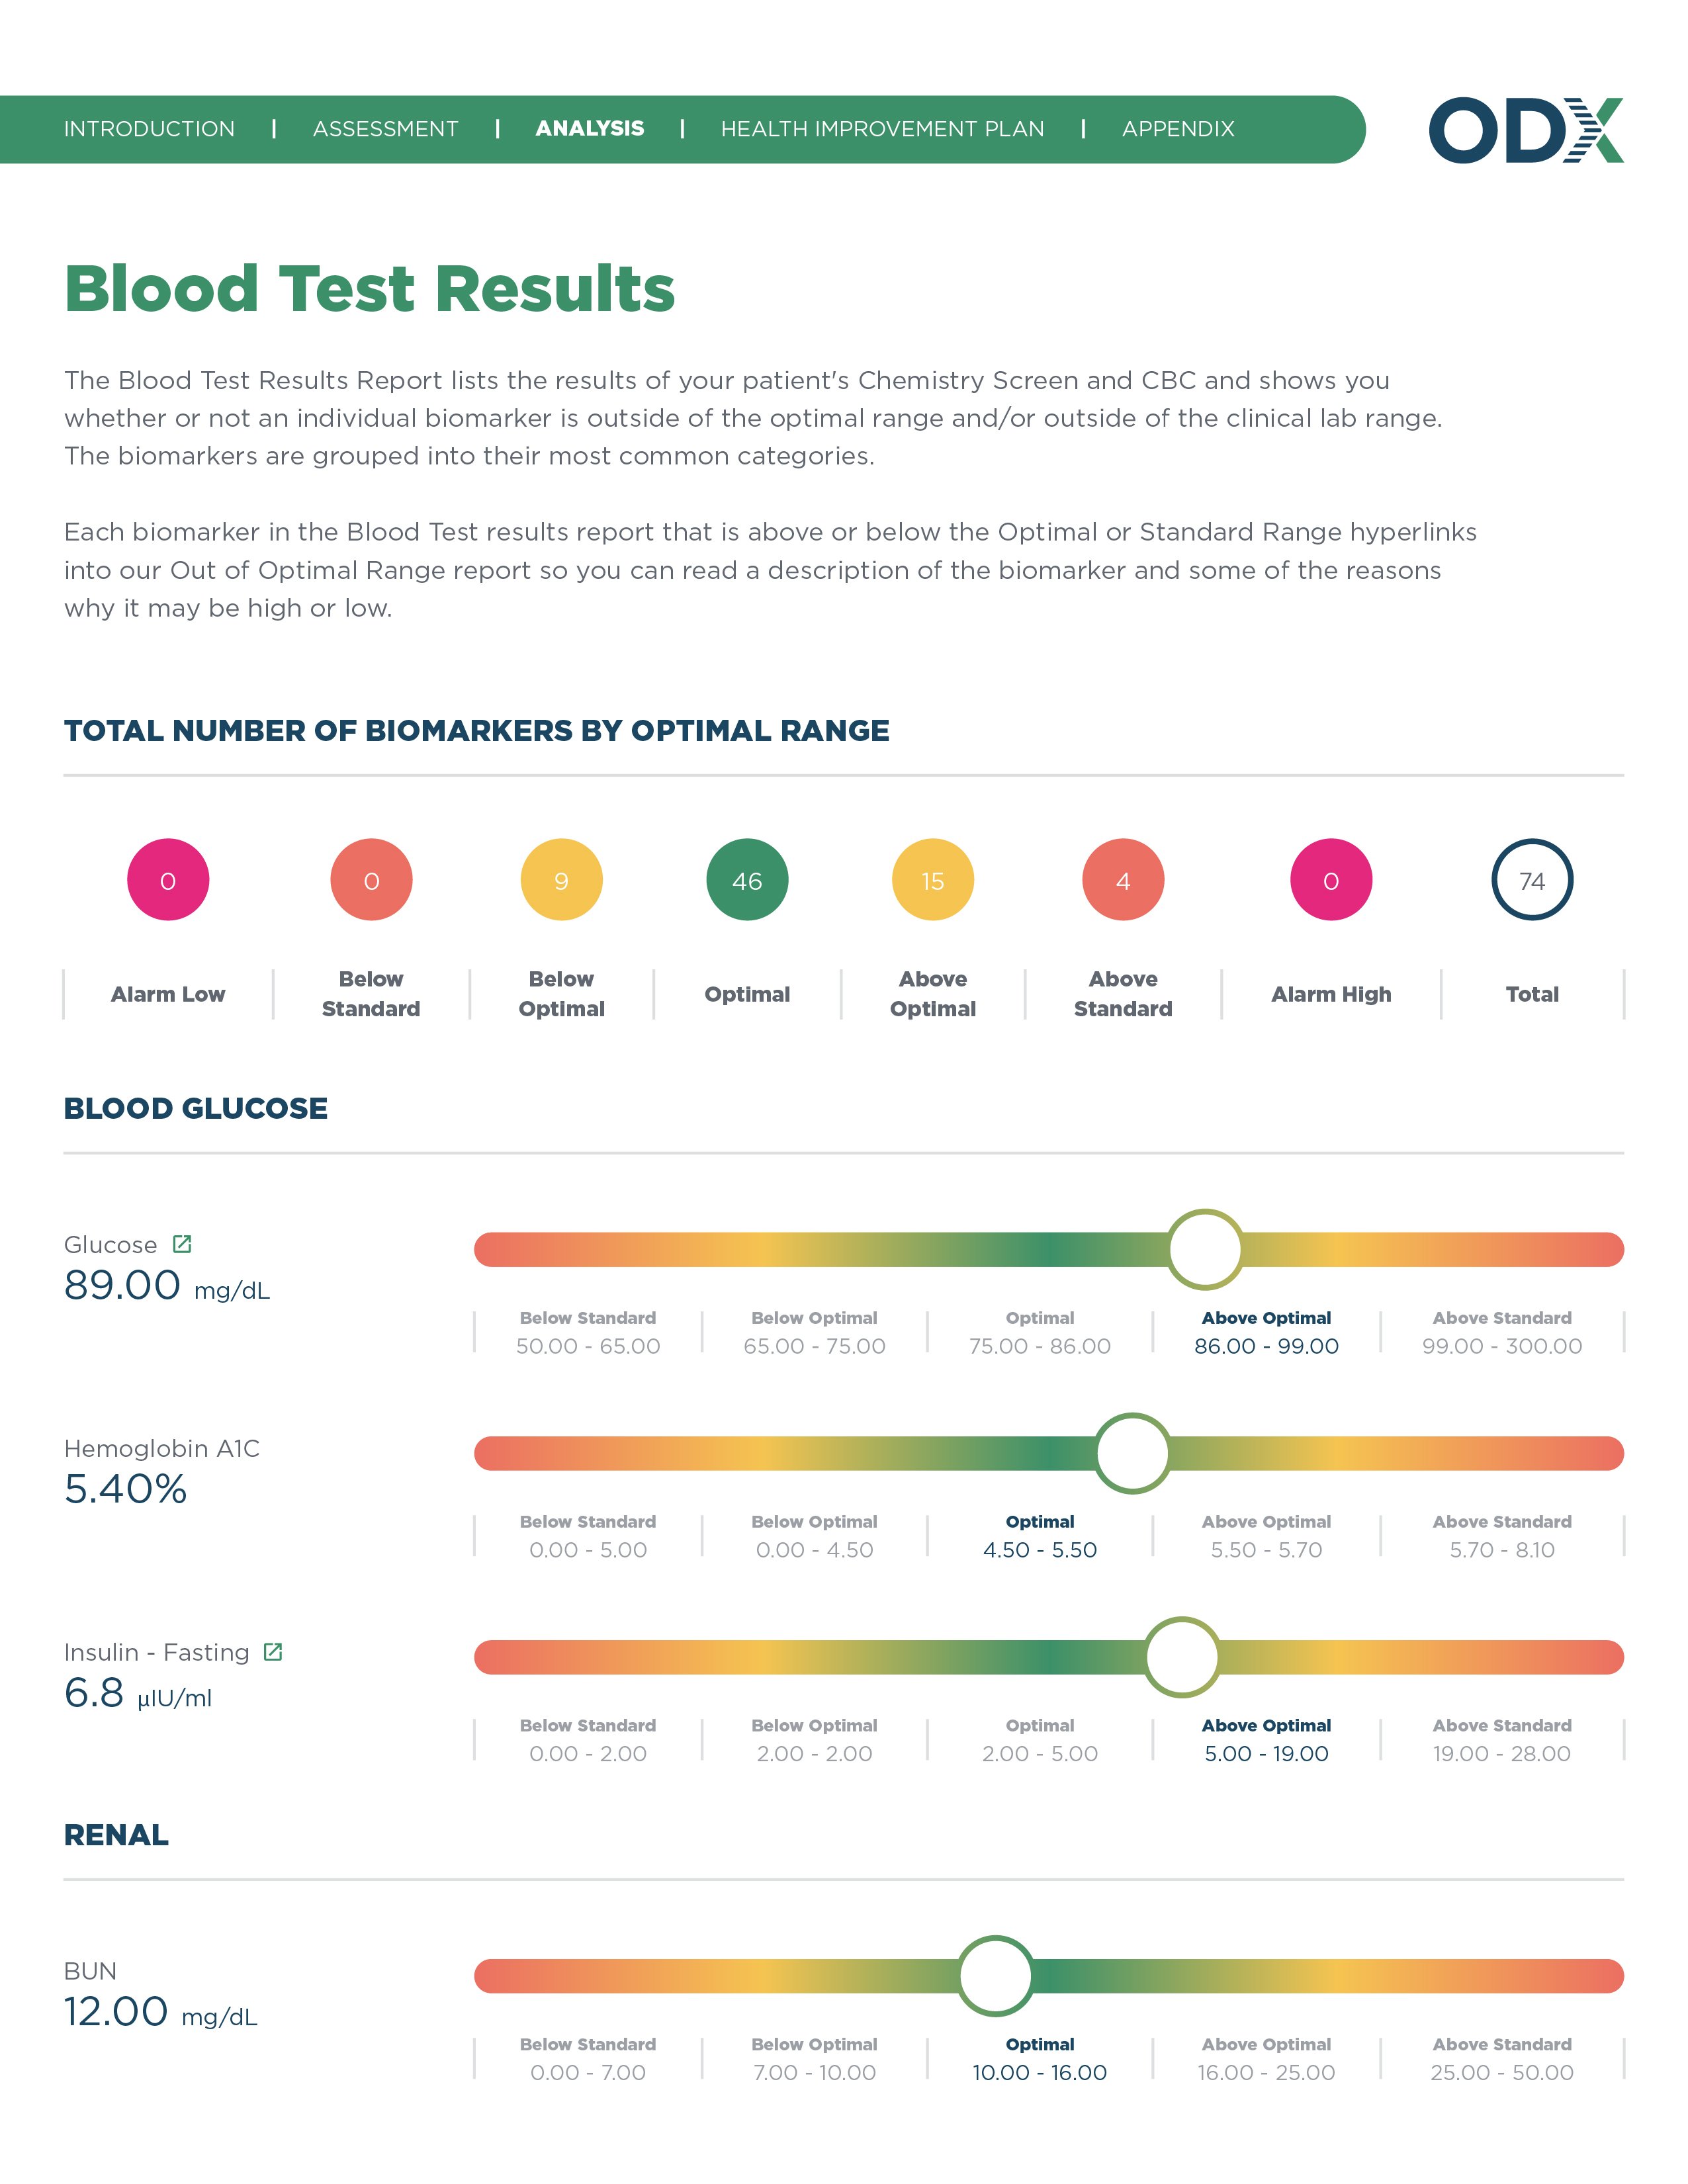
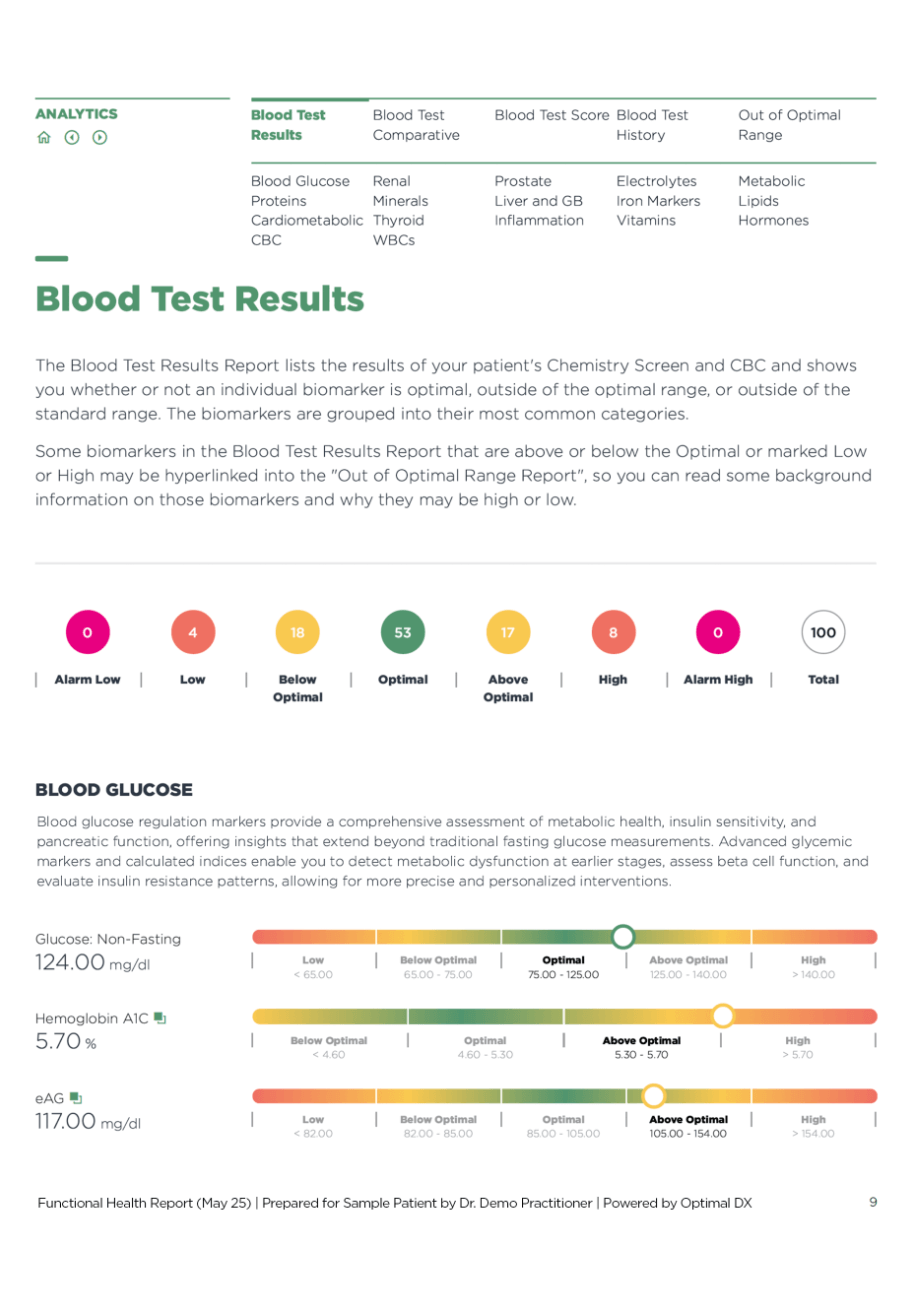
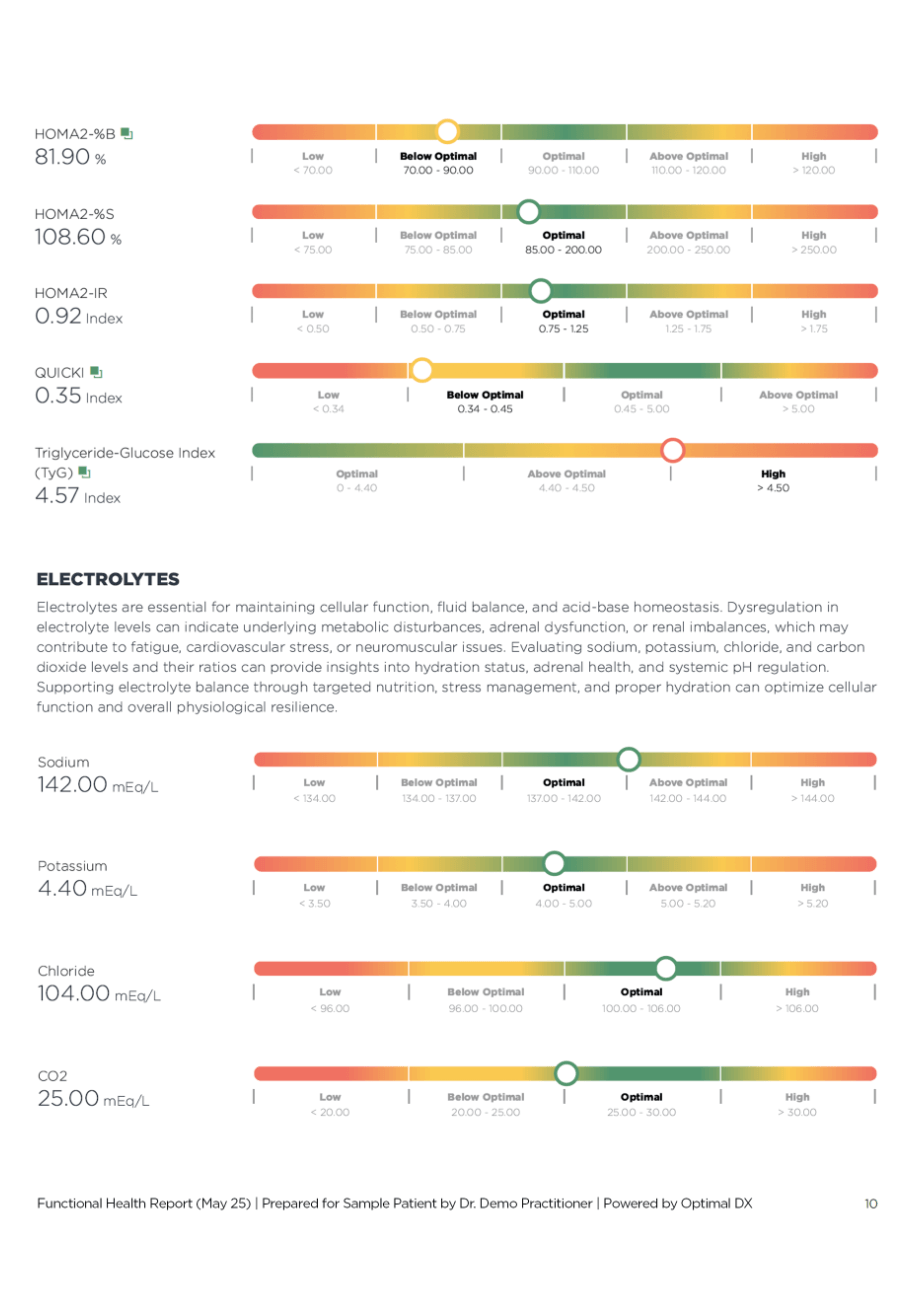
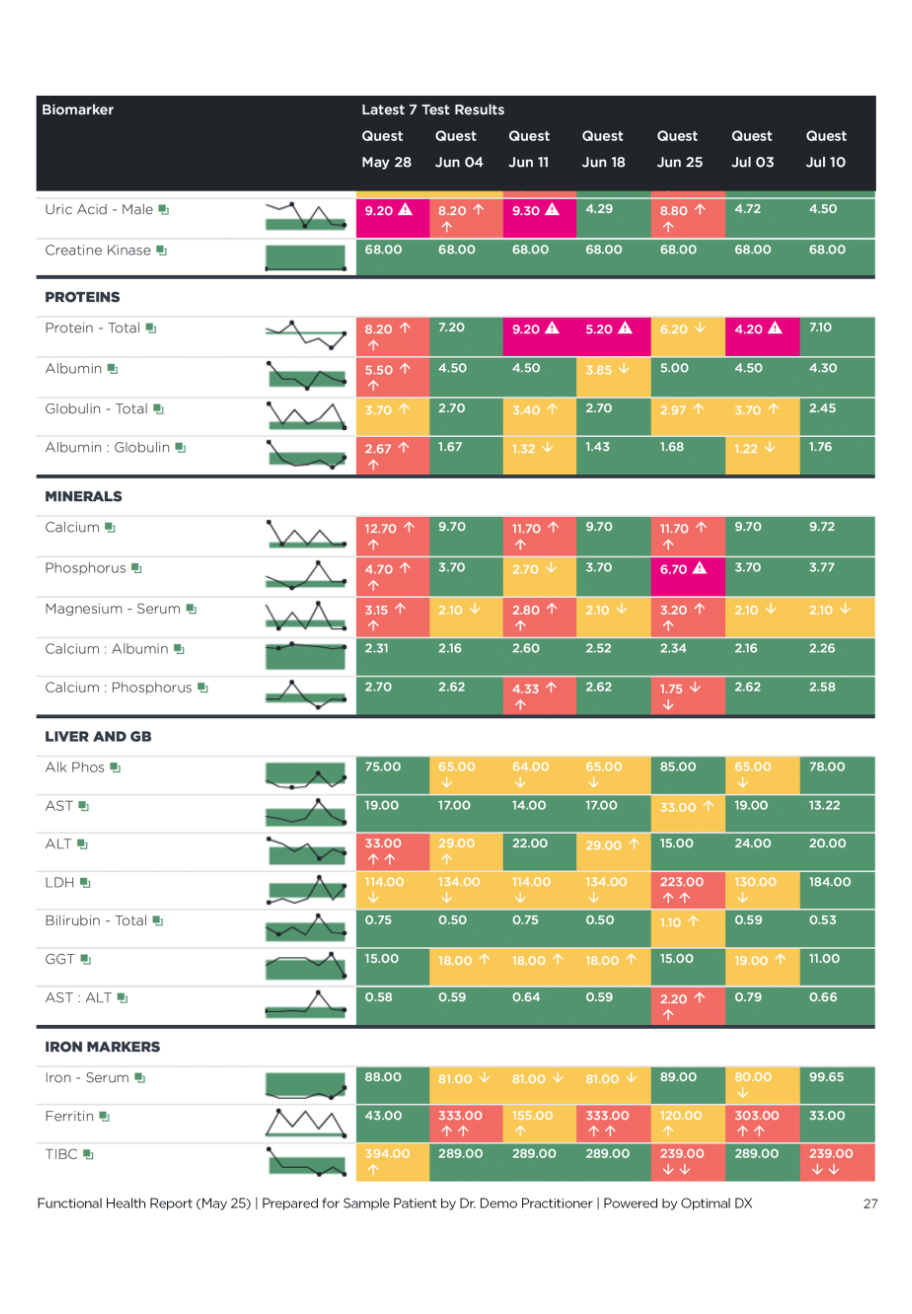
Now that you’ve received your patients’ blood test results, it’s time to review them with a functional lens. This report lists the results of the patients’ tests and whether or not a given biomarker is outside of the optimal range or standard lab range.

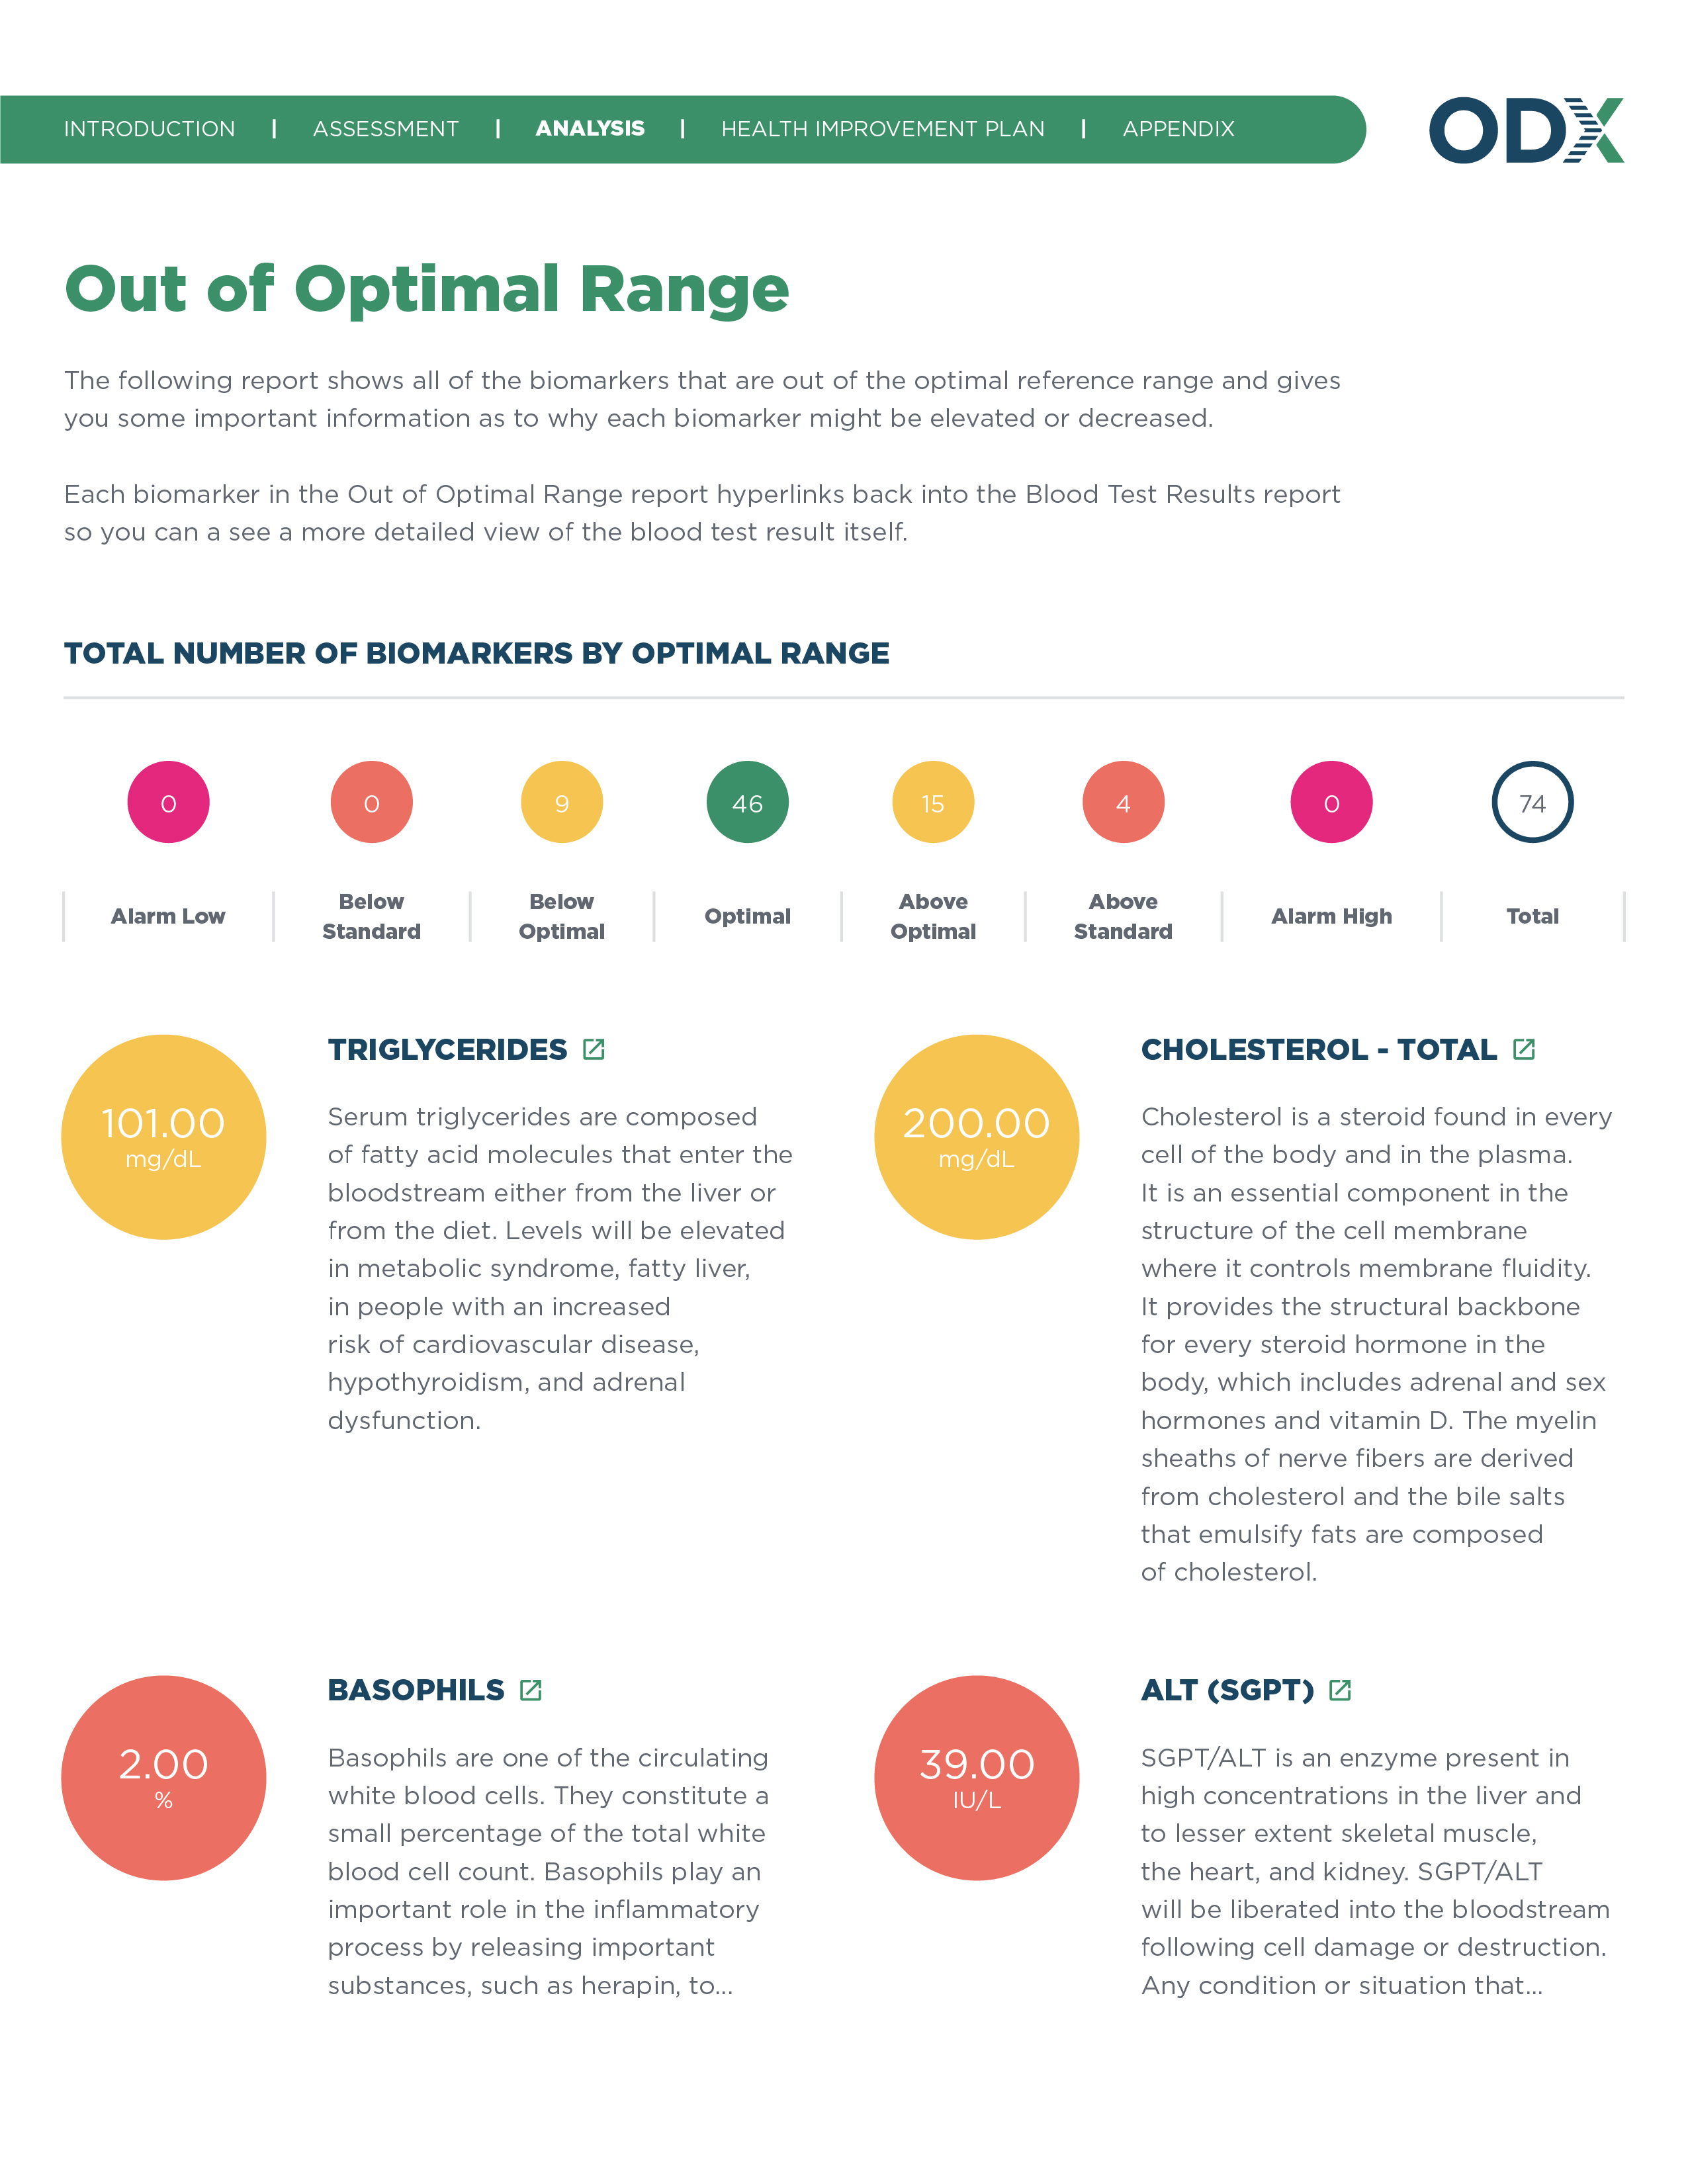
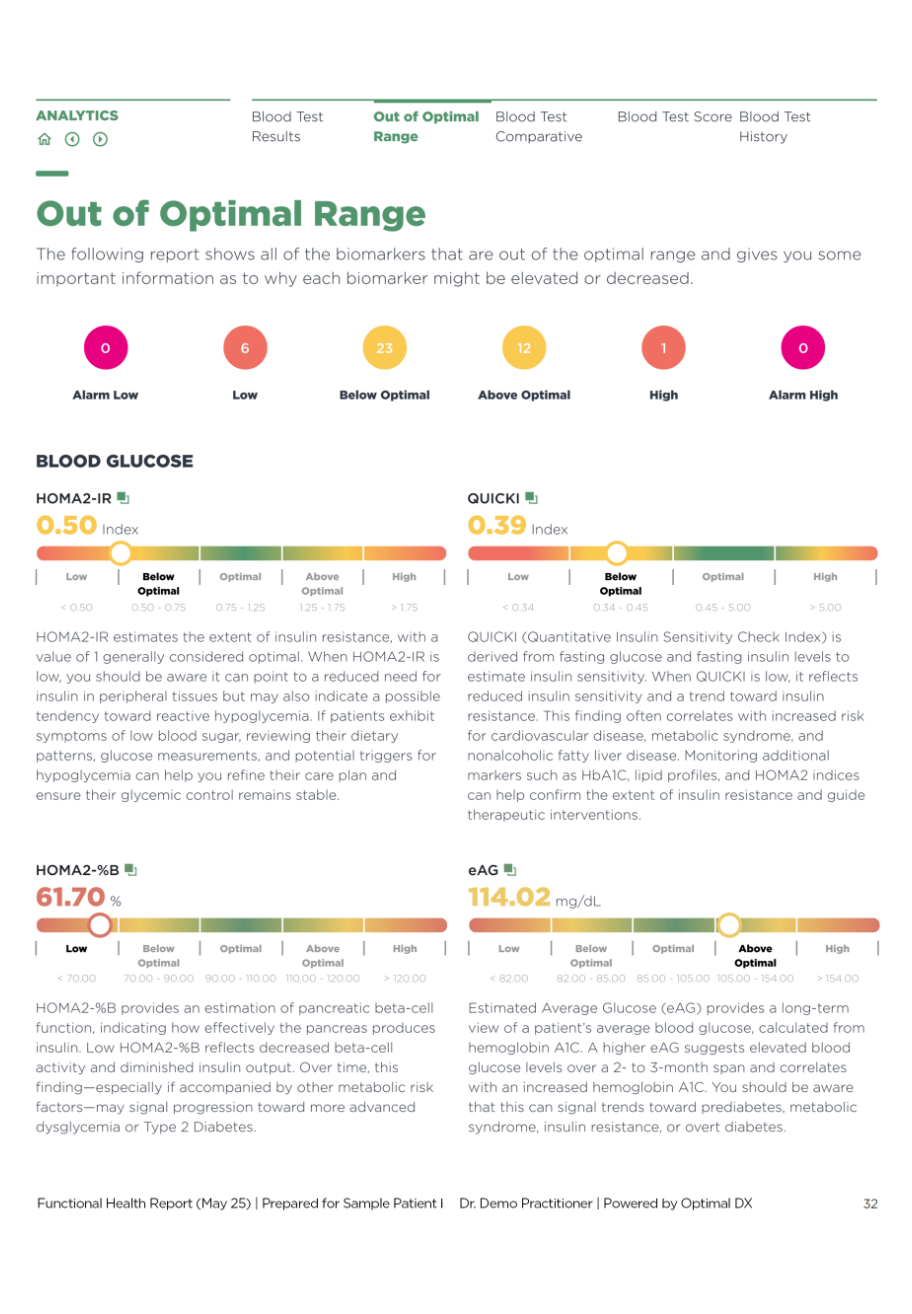
Easily view all of the biomarkers out of their optimal ranges at a glance. Using the Optimal DX Software platform’s built-in functional blood chemistry information, your patients will gain a brief description of why each biomarker might be elevated or decreased.

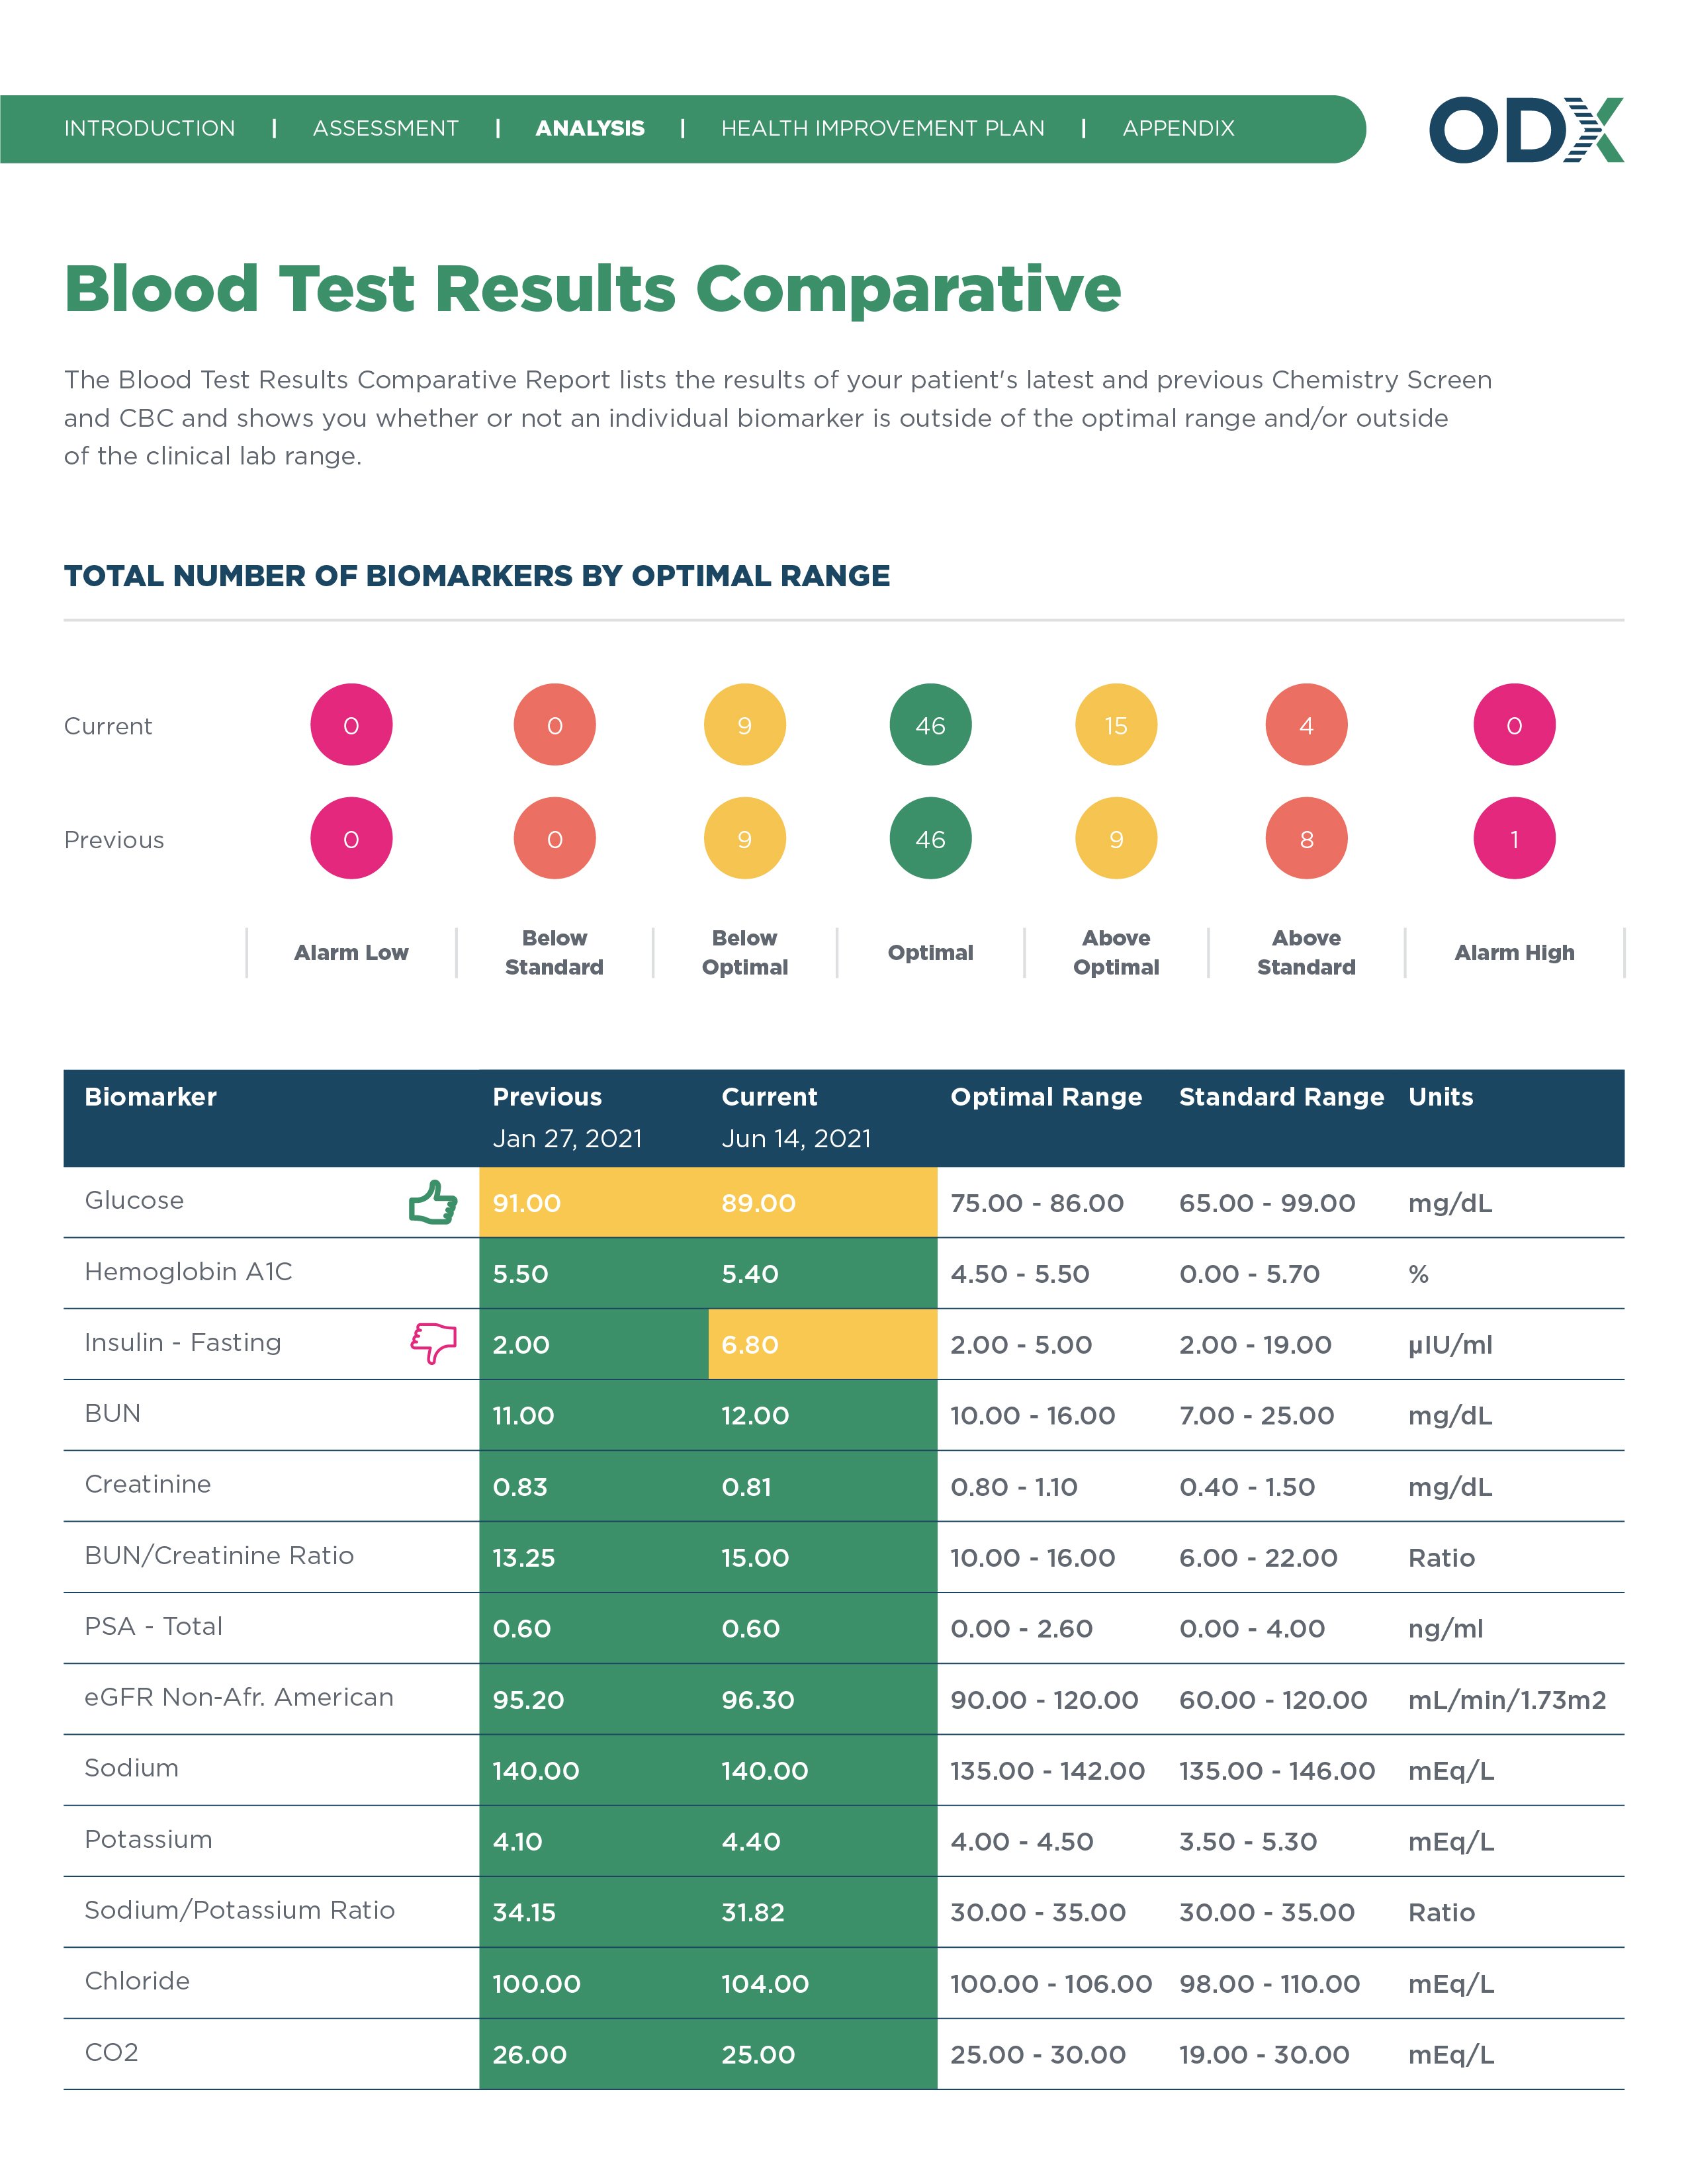
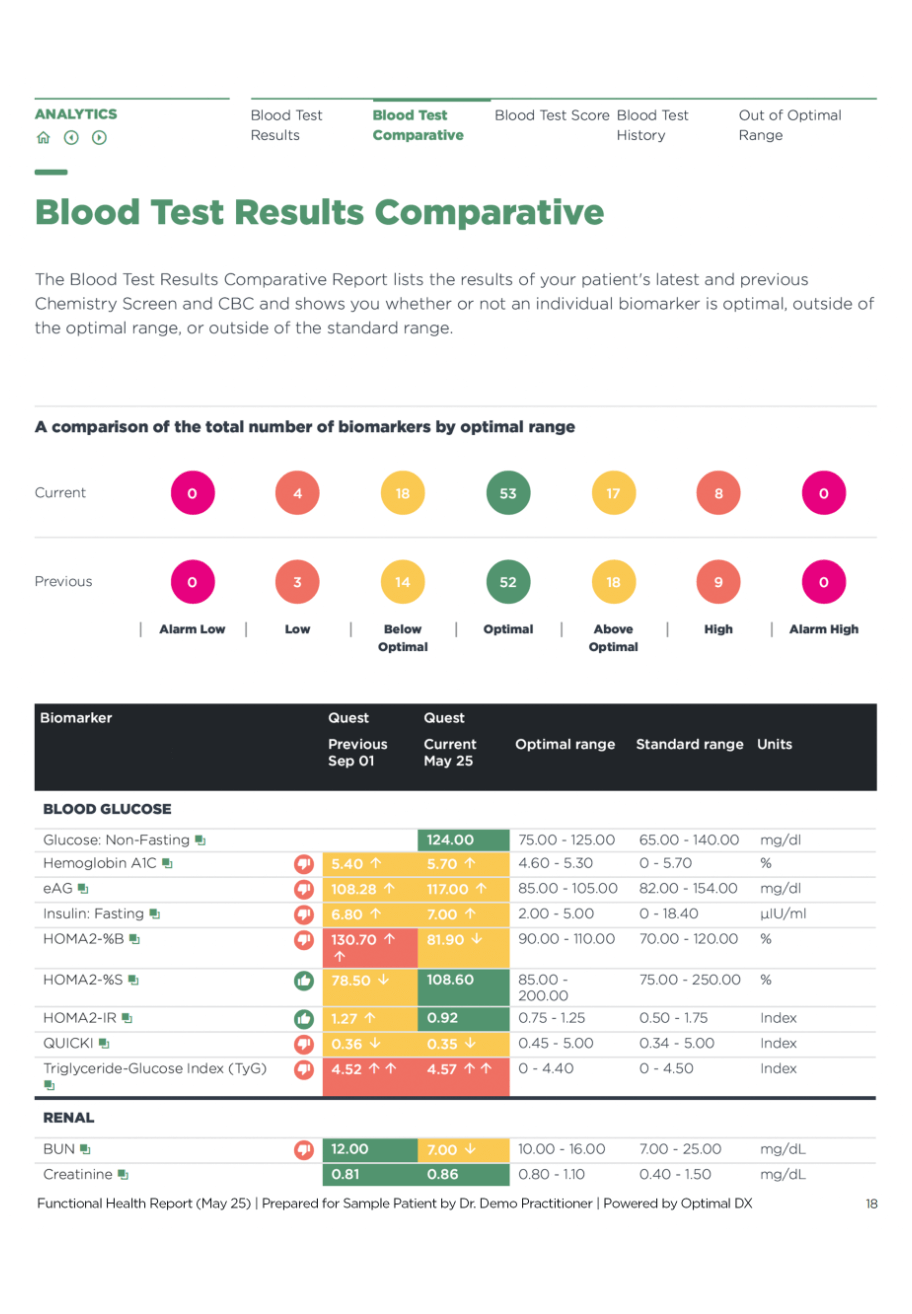
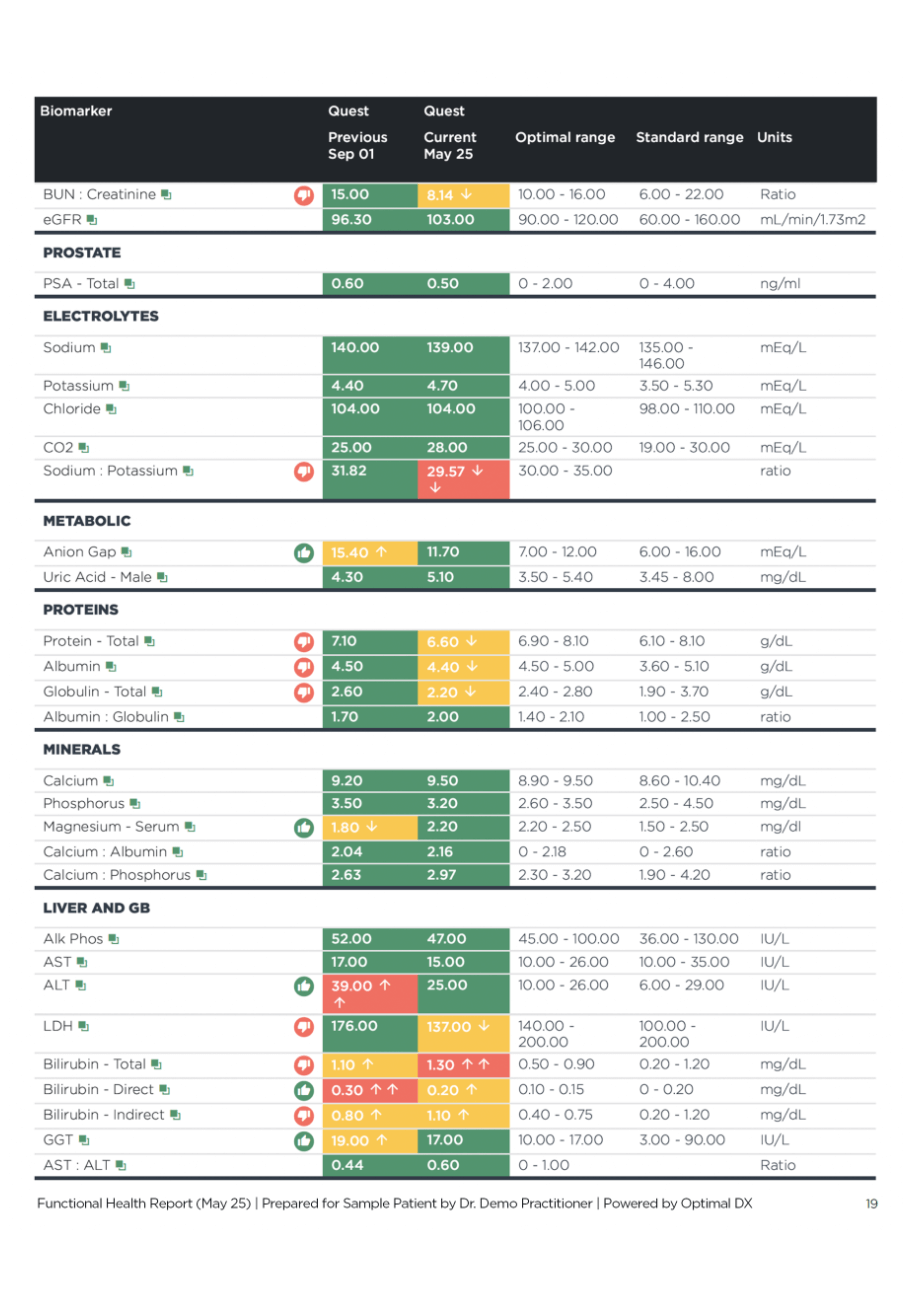
How does a patient’s most recent blood biomarker profile compare to a previous one? This report calls out major areas of change between two lab tests.

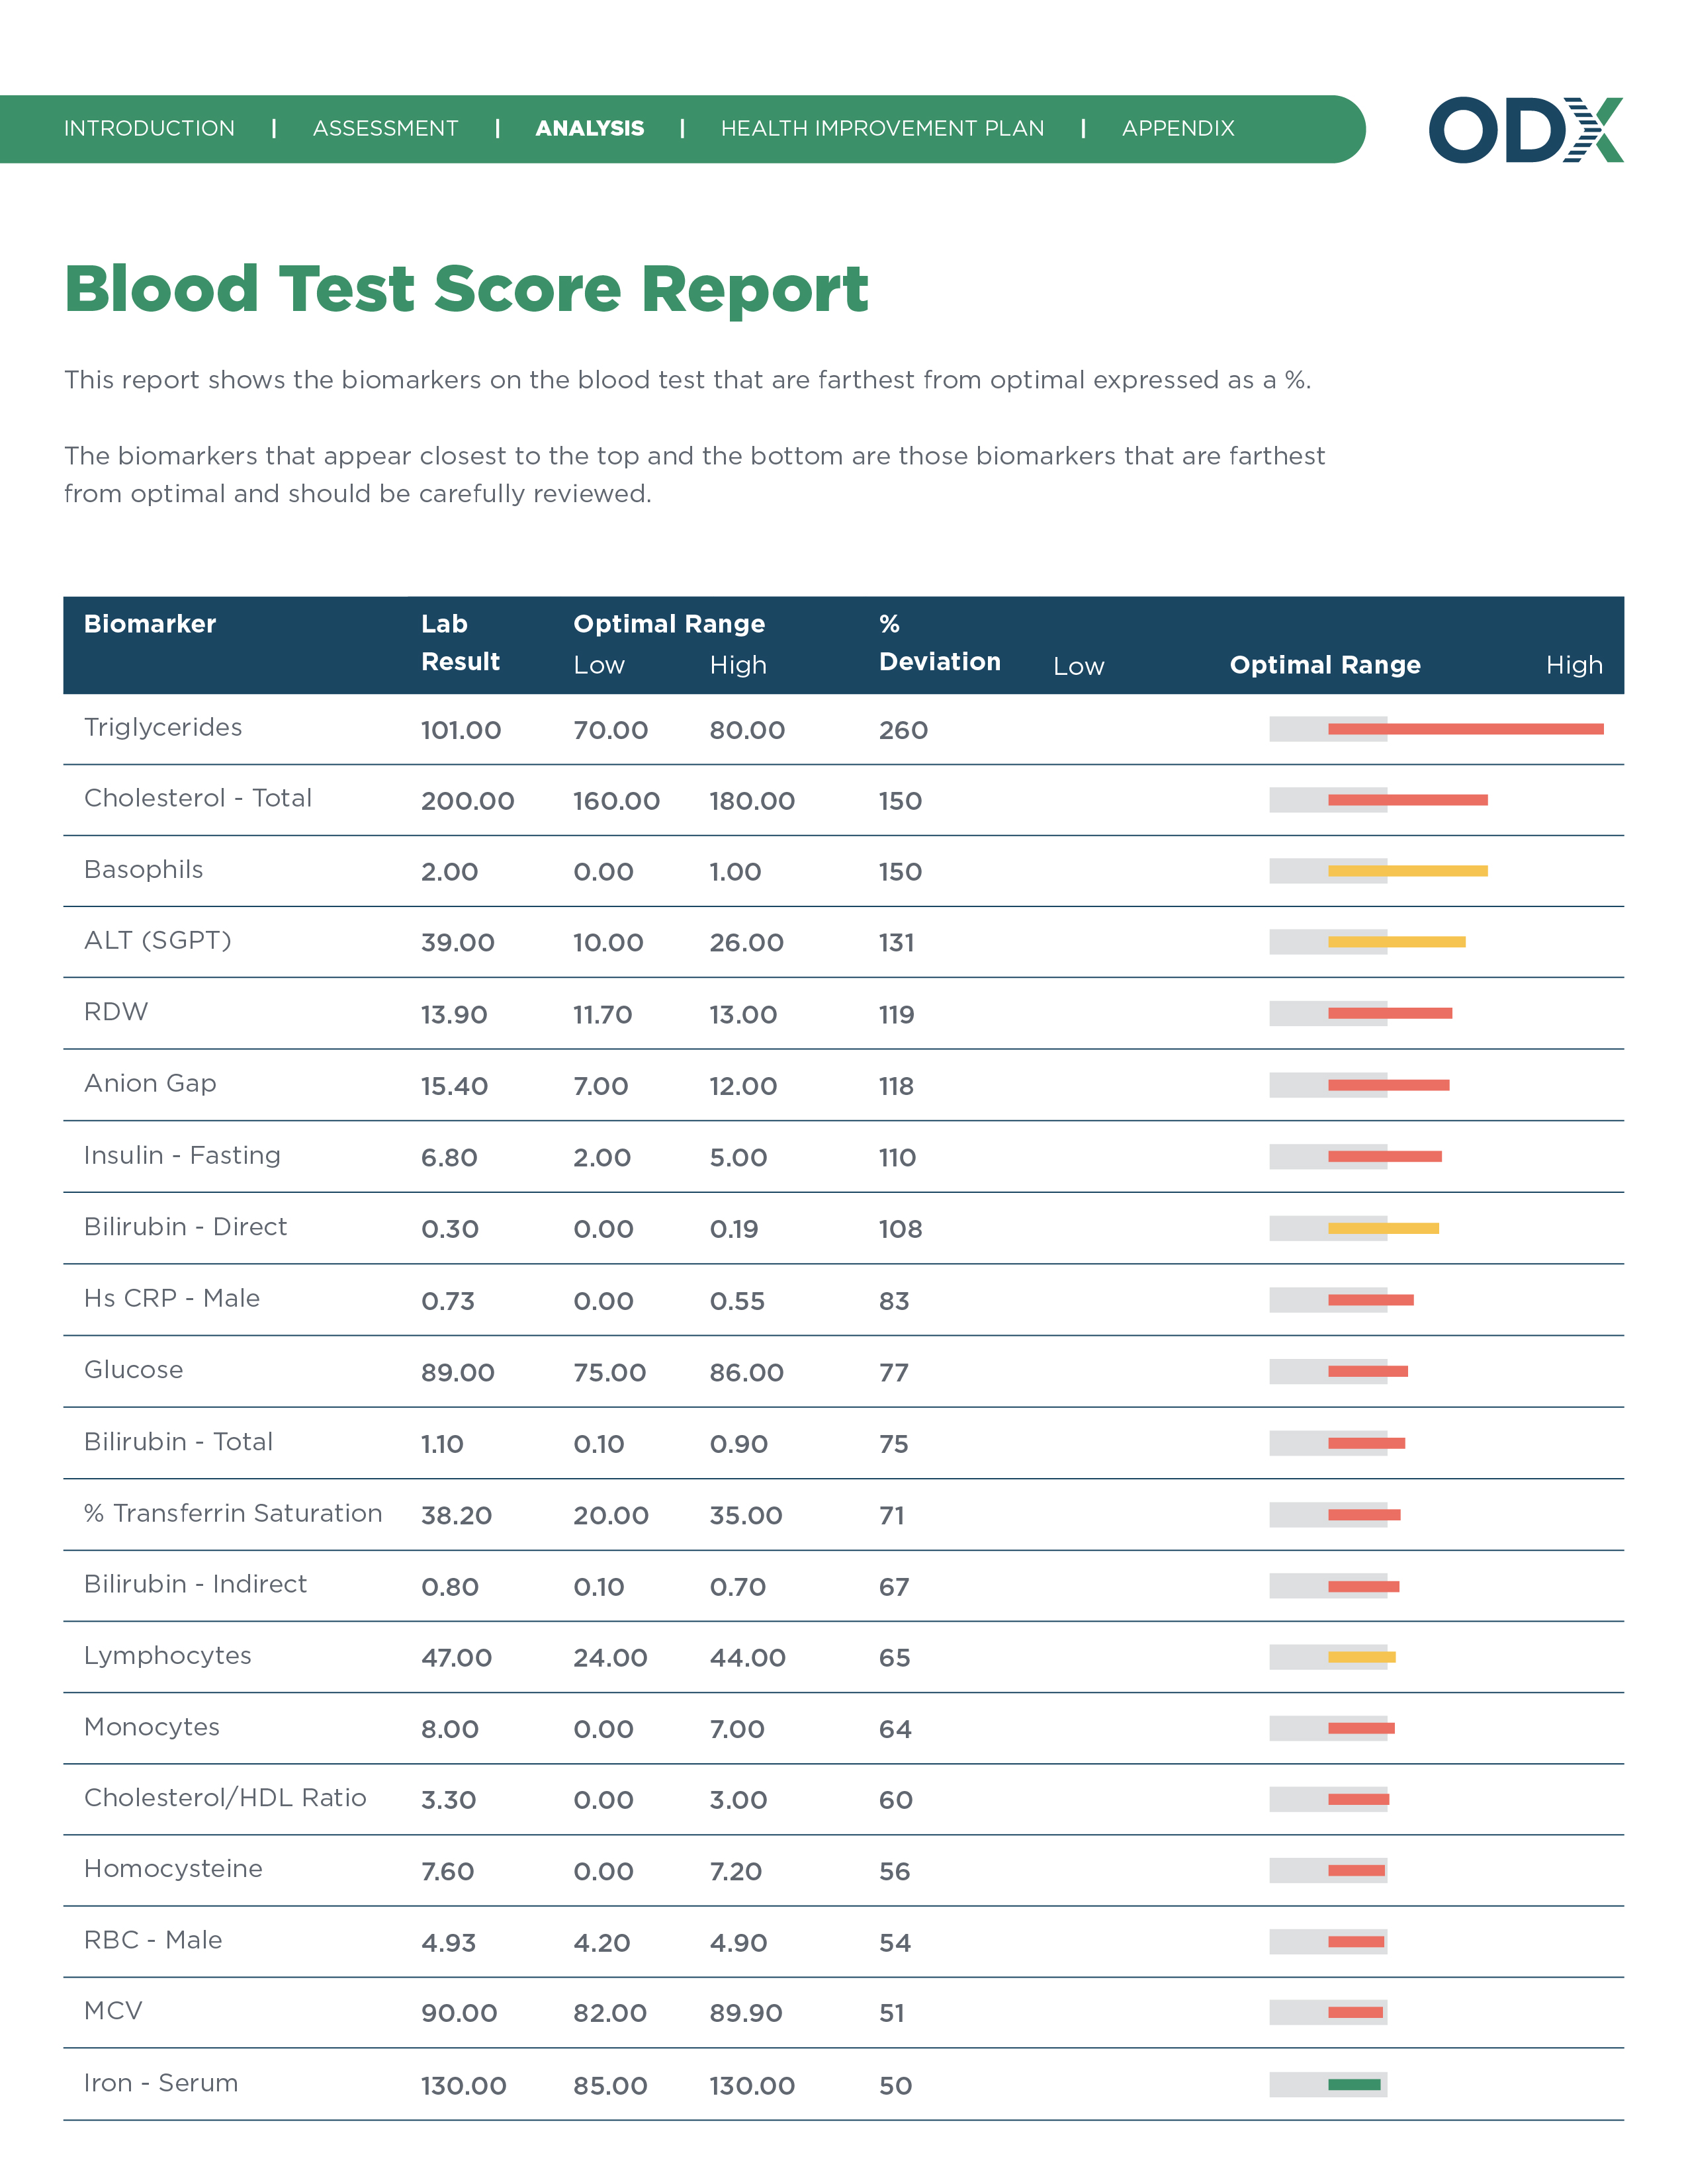
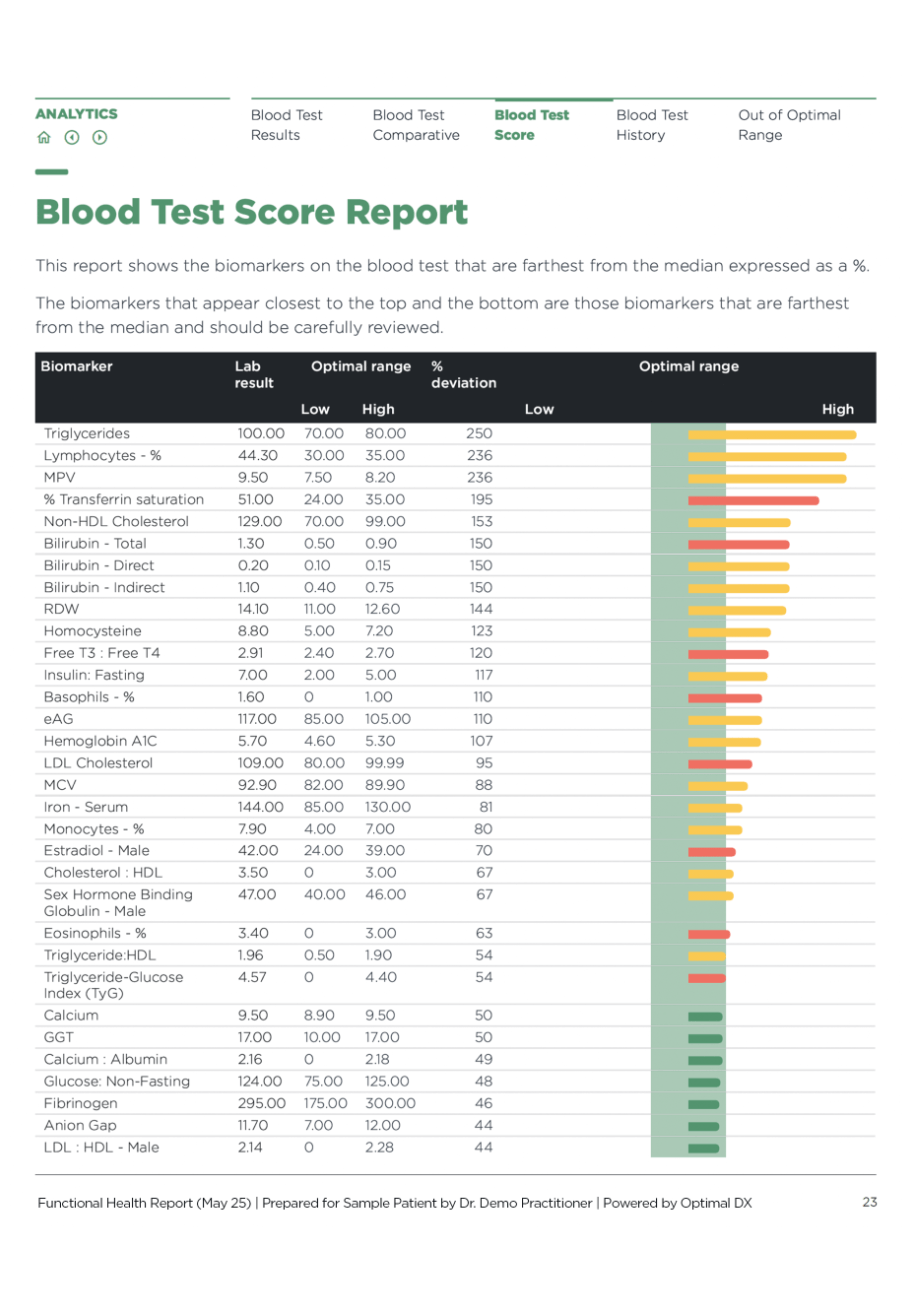
Using this report, you can quickly view which biomarkers scored farthest from the median on your patients’ blood test as expressed as a percentage score.
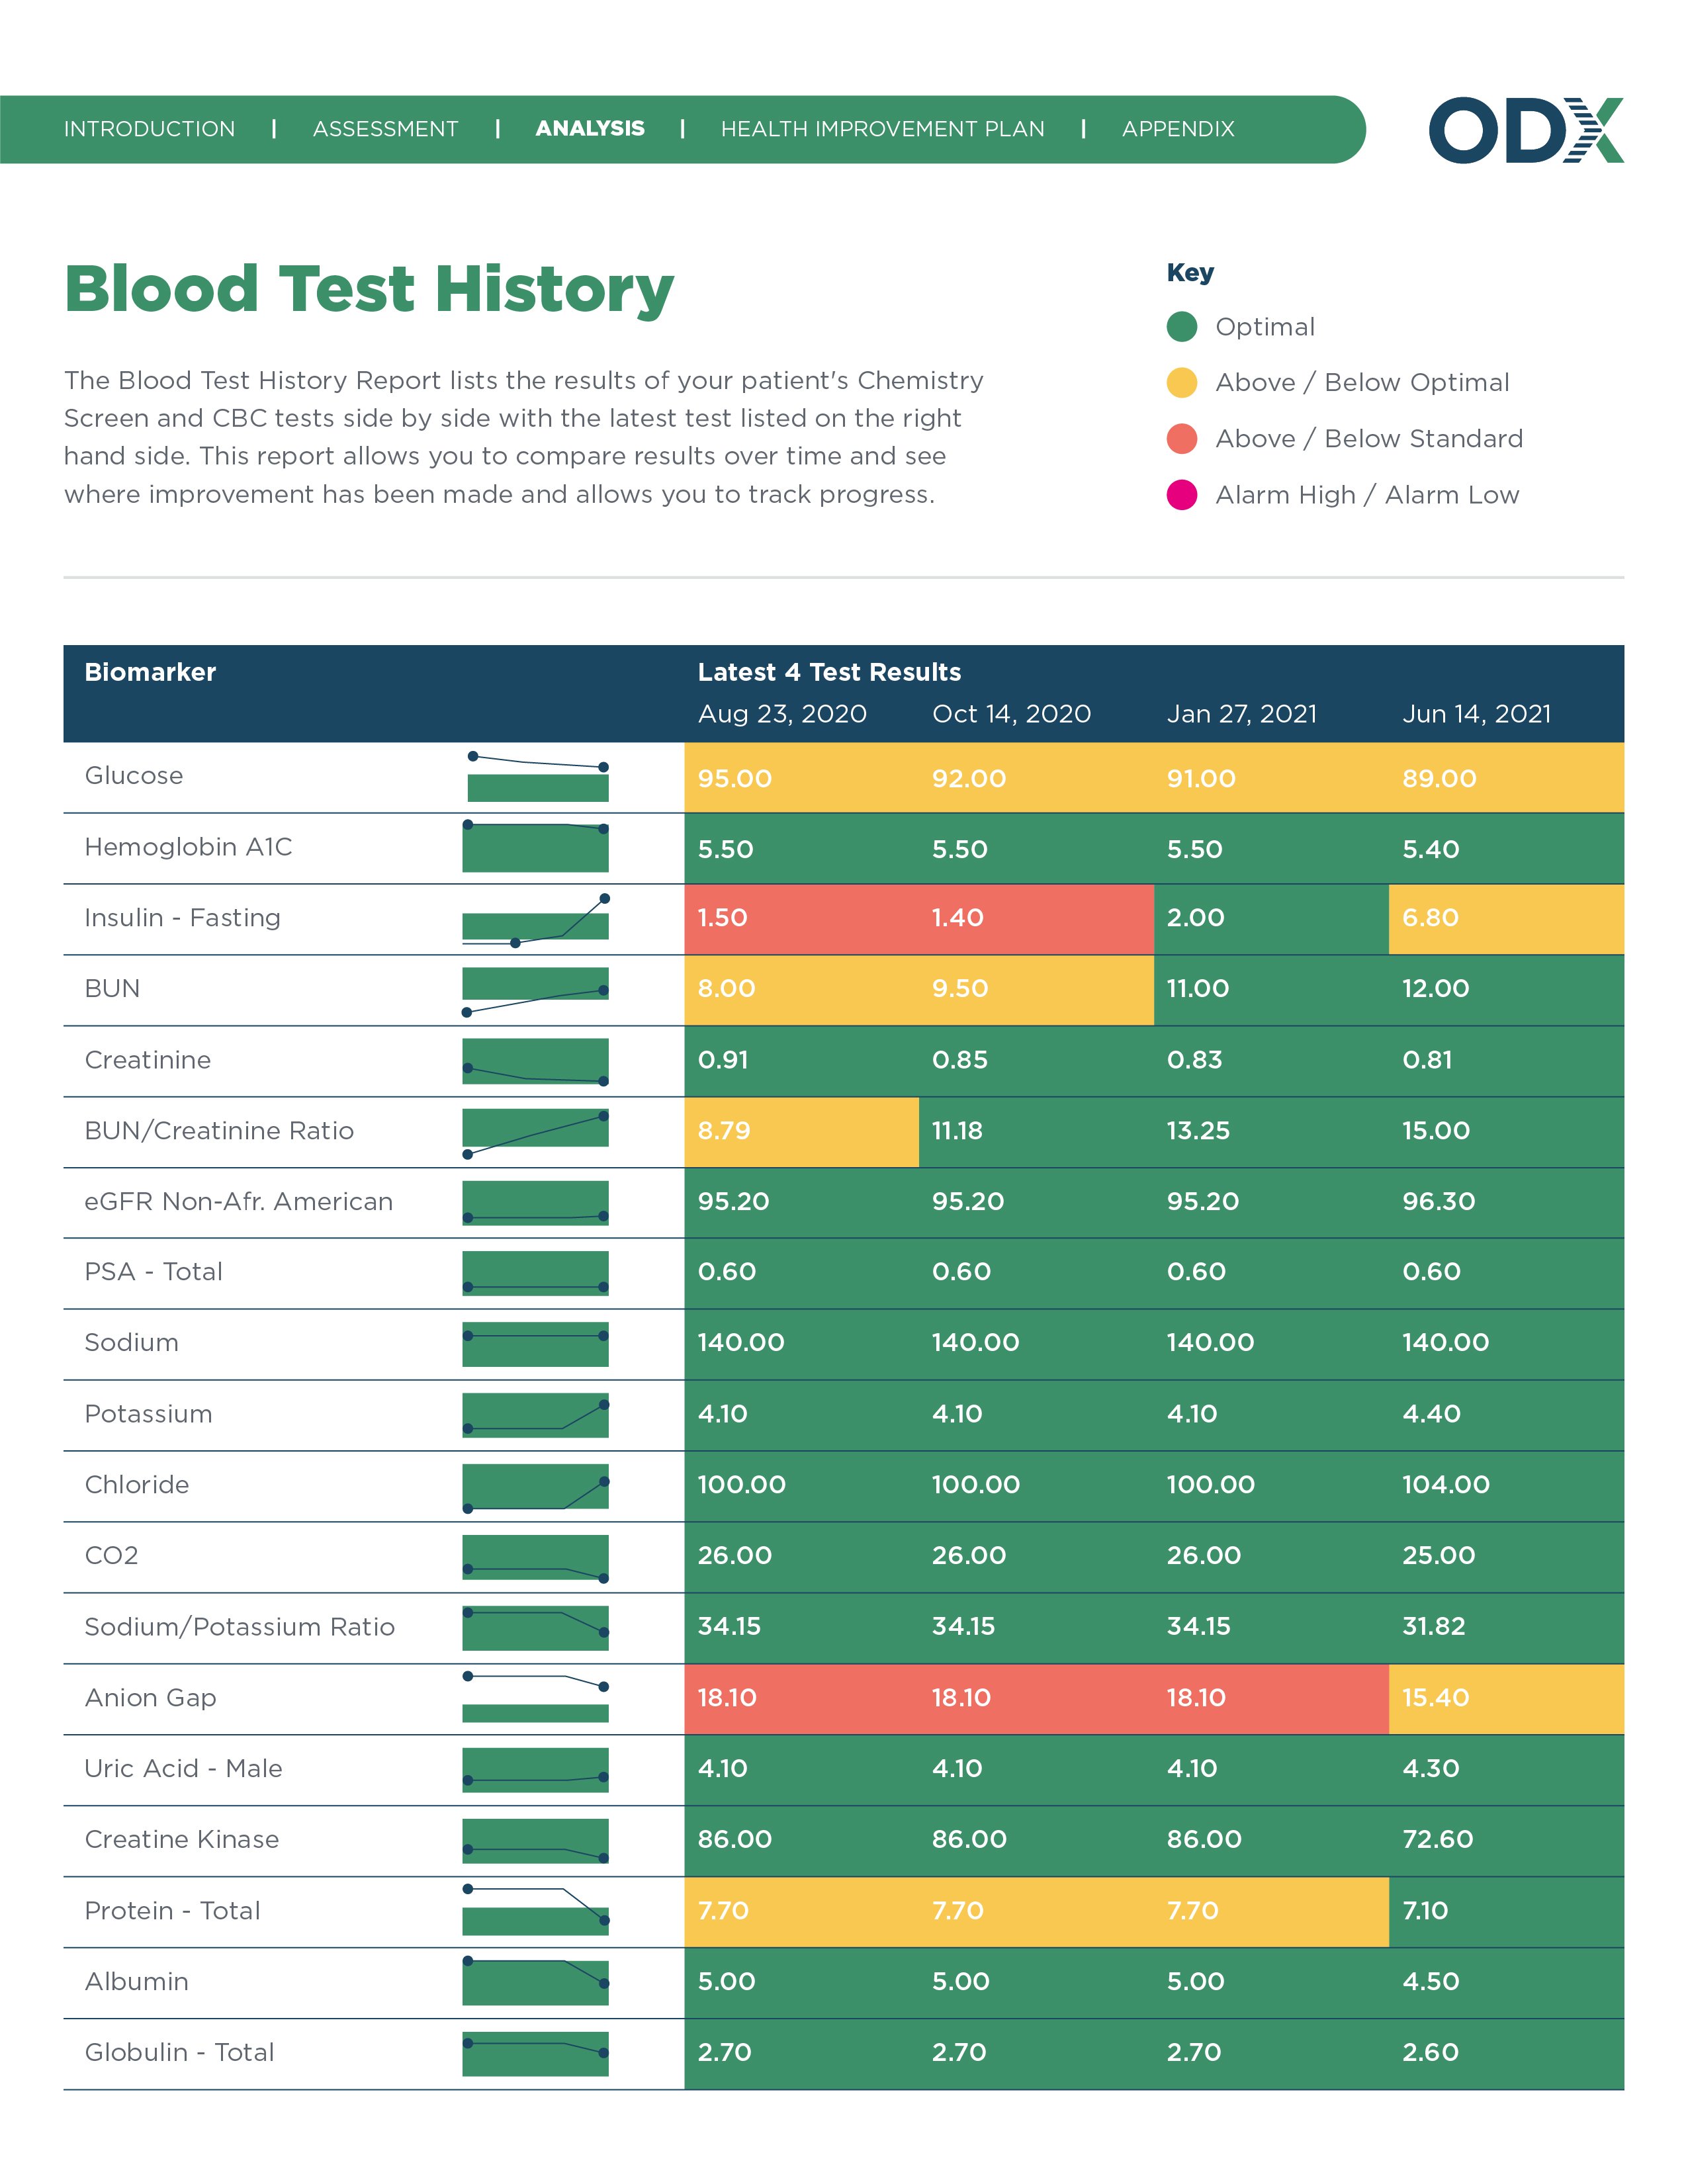
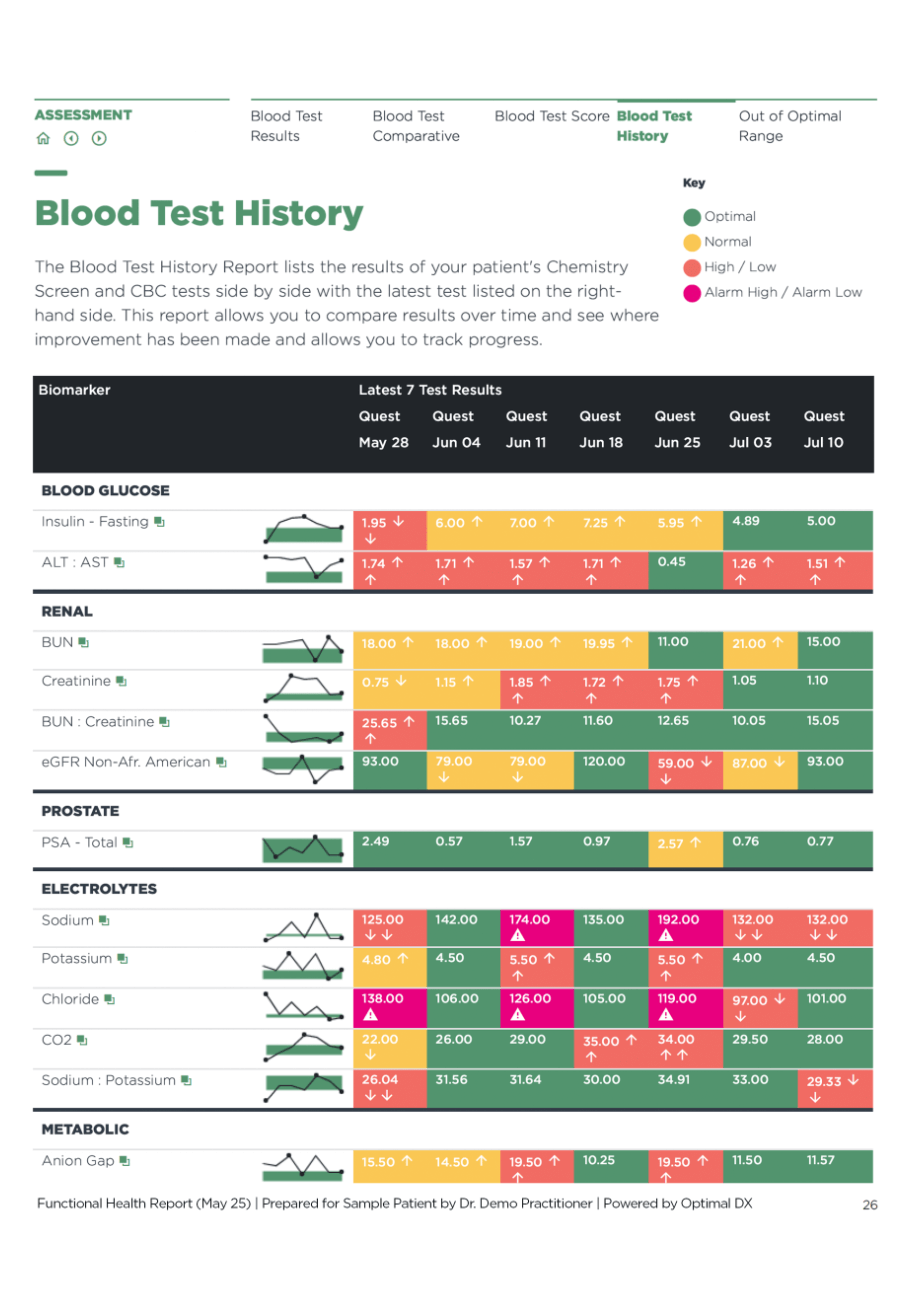
Take a broader view of your patients’ progress over time using the Blood Test History report. This report shows the past 6 blood tests side by side, graphing biomarker change over time.

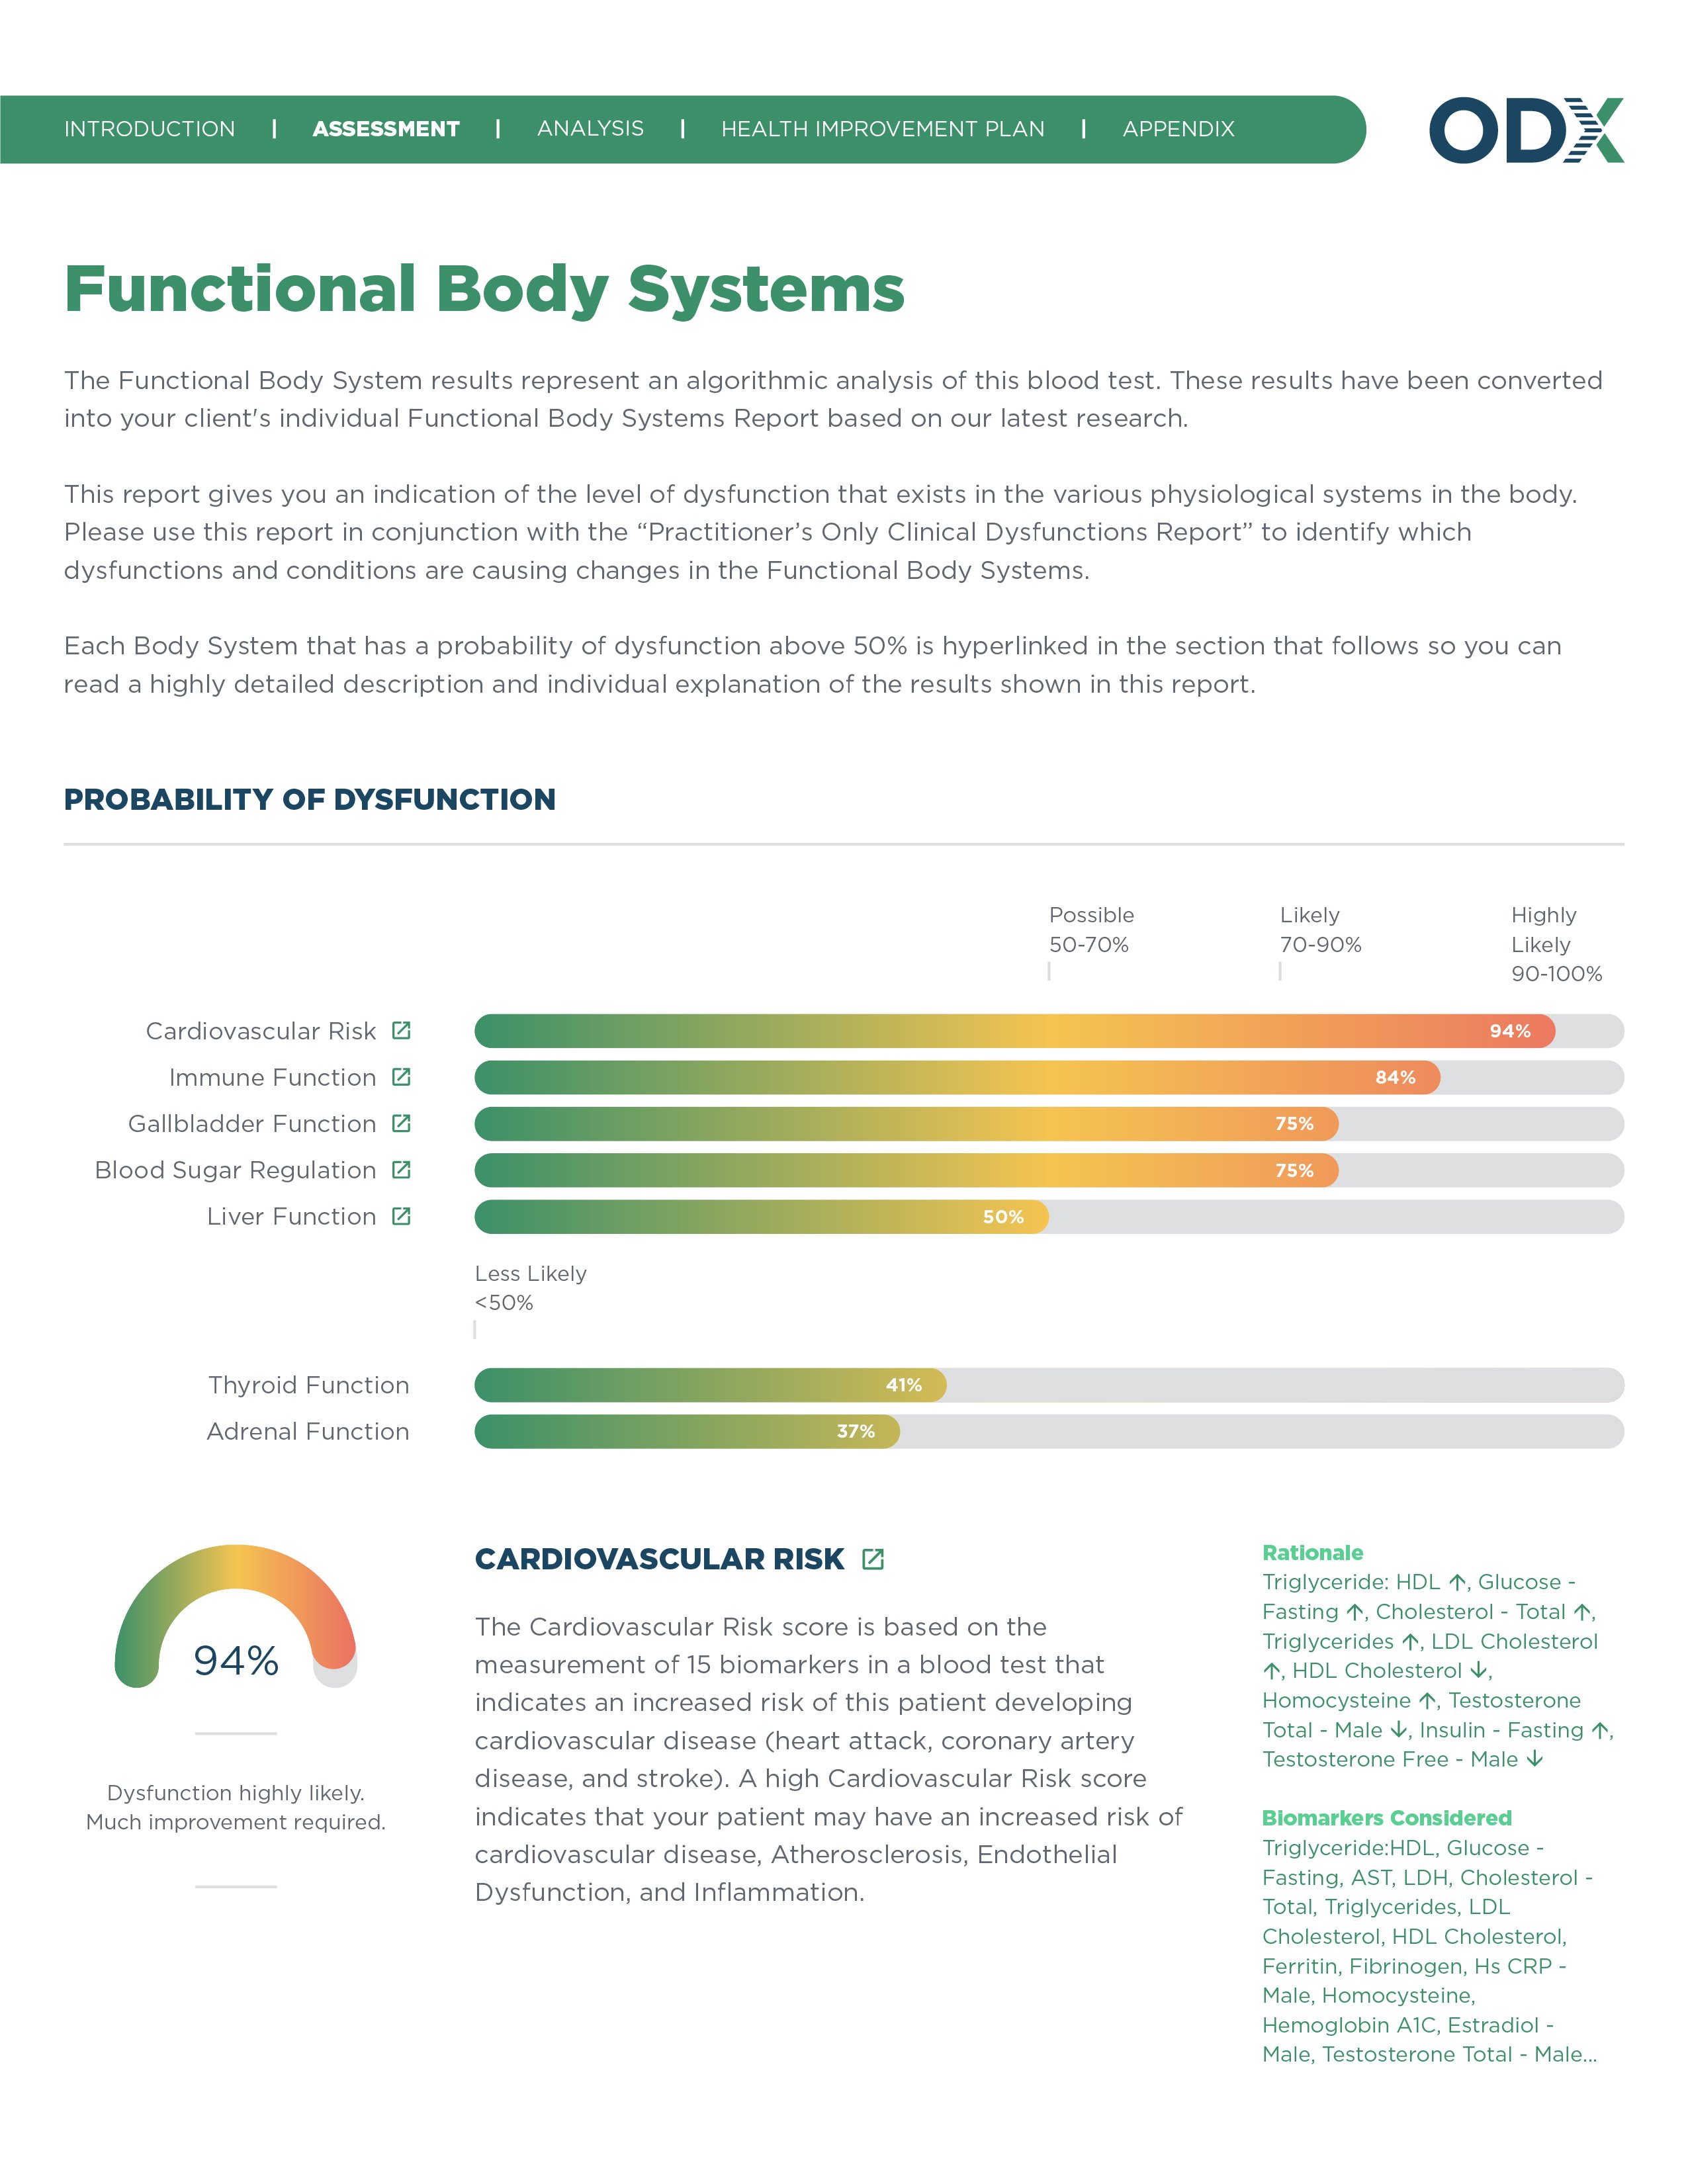
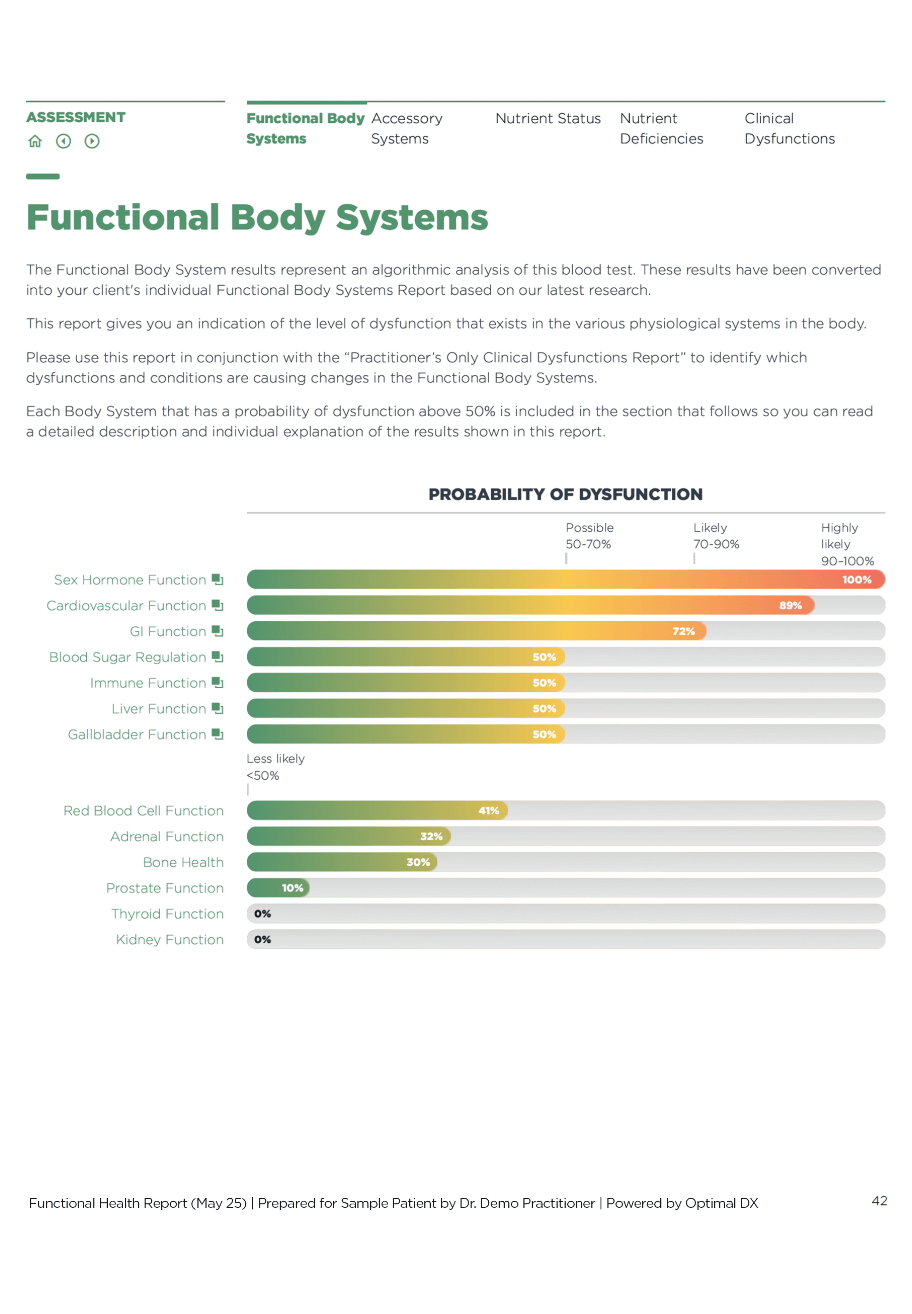
View an algorithmically derived assessment of dysfunction risk for each major functional body system — such as the immune, cardiovascular and others — based on the data from your patients’ latest blood test results.

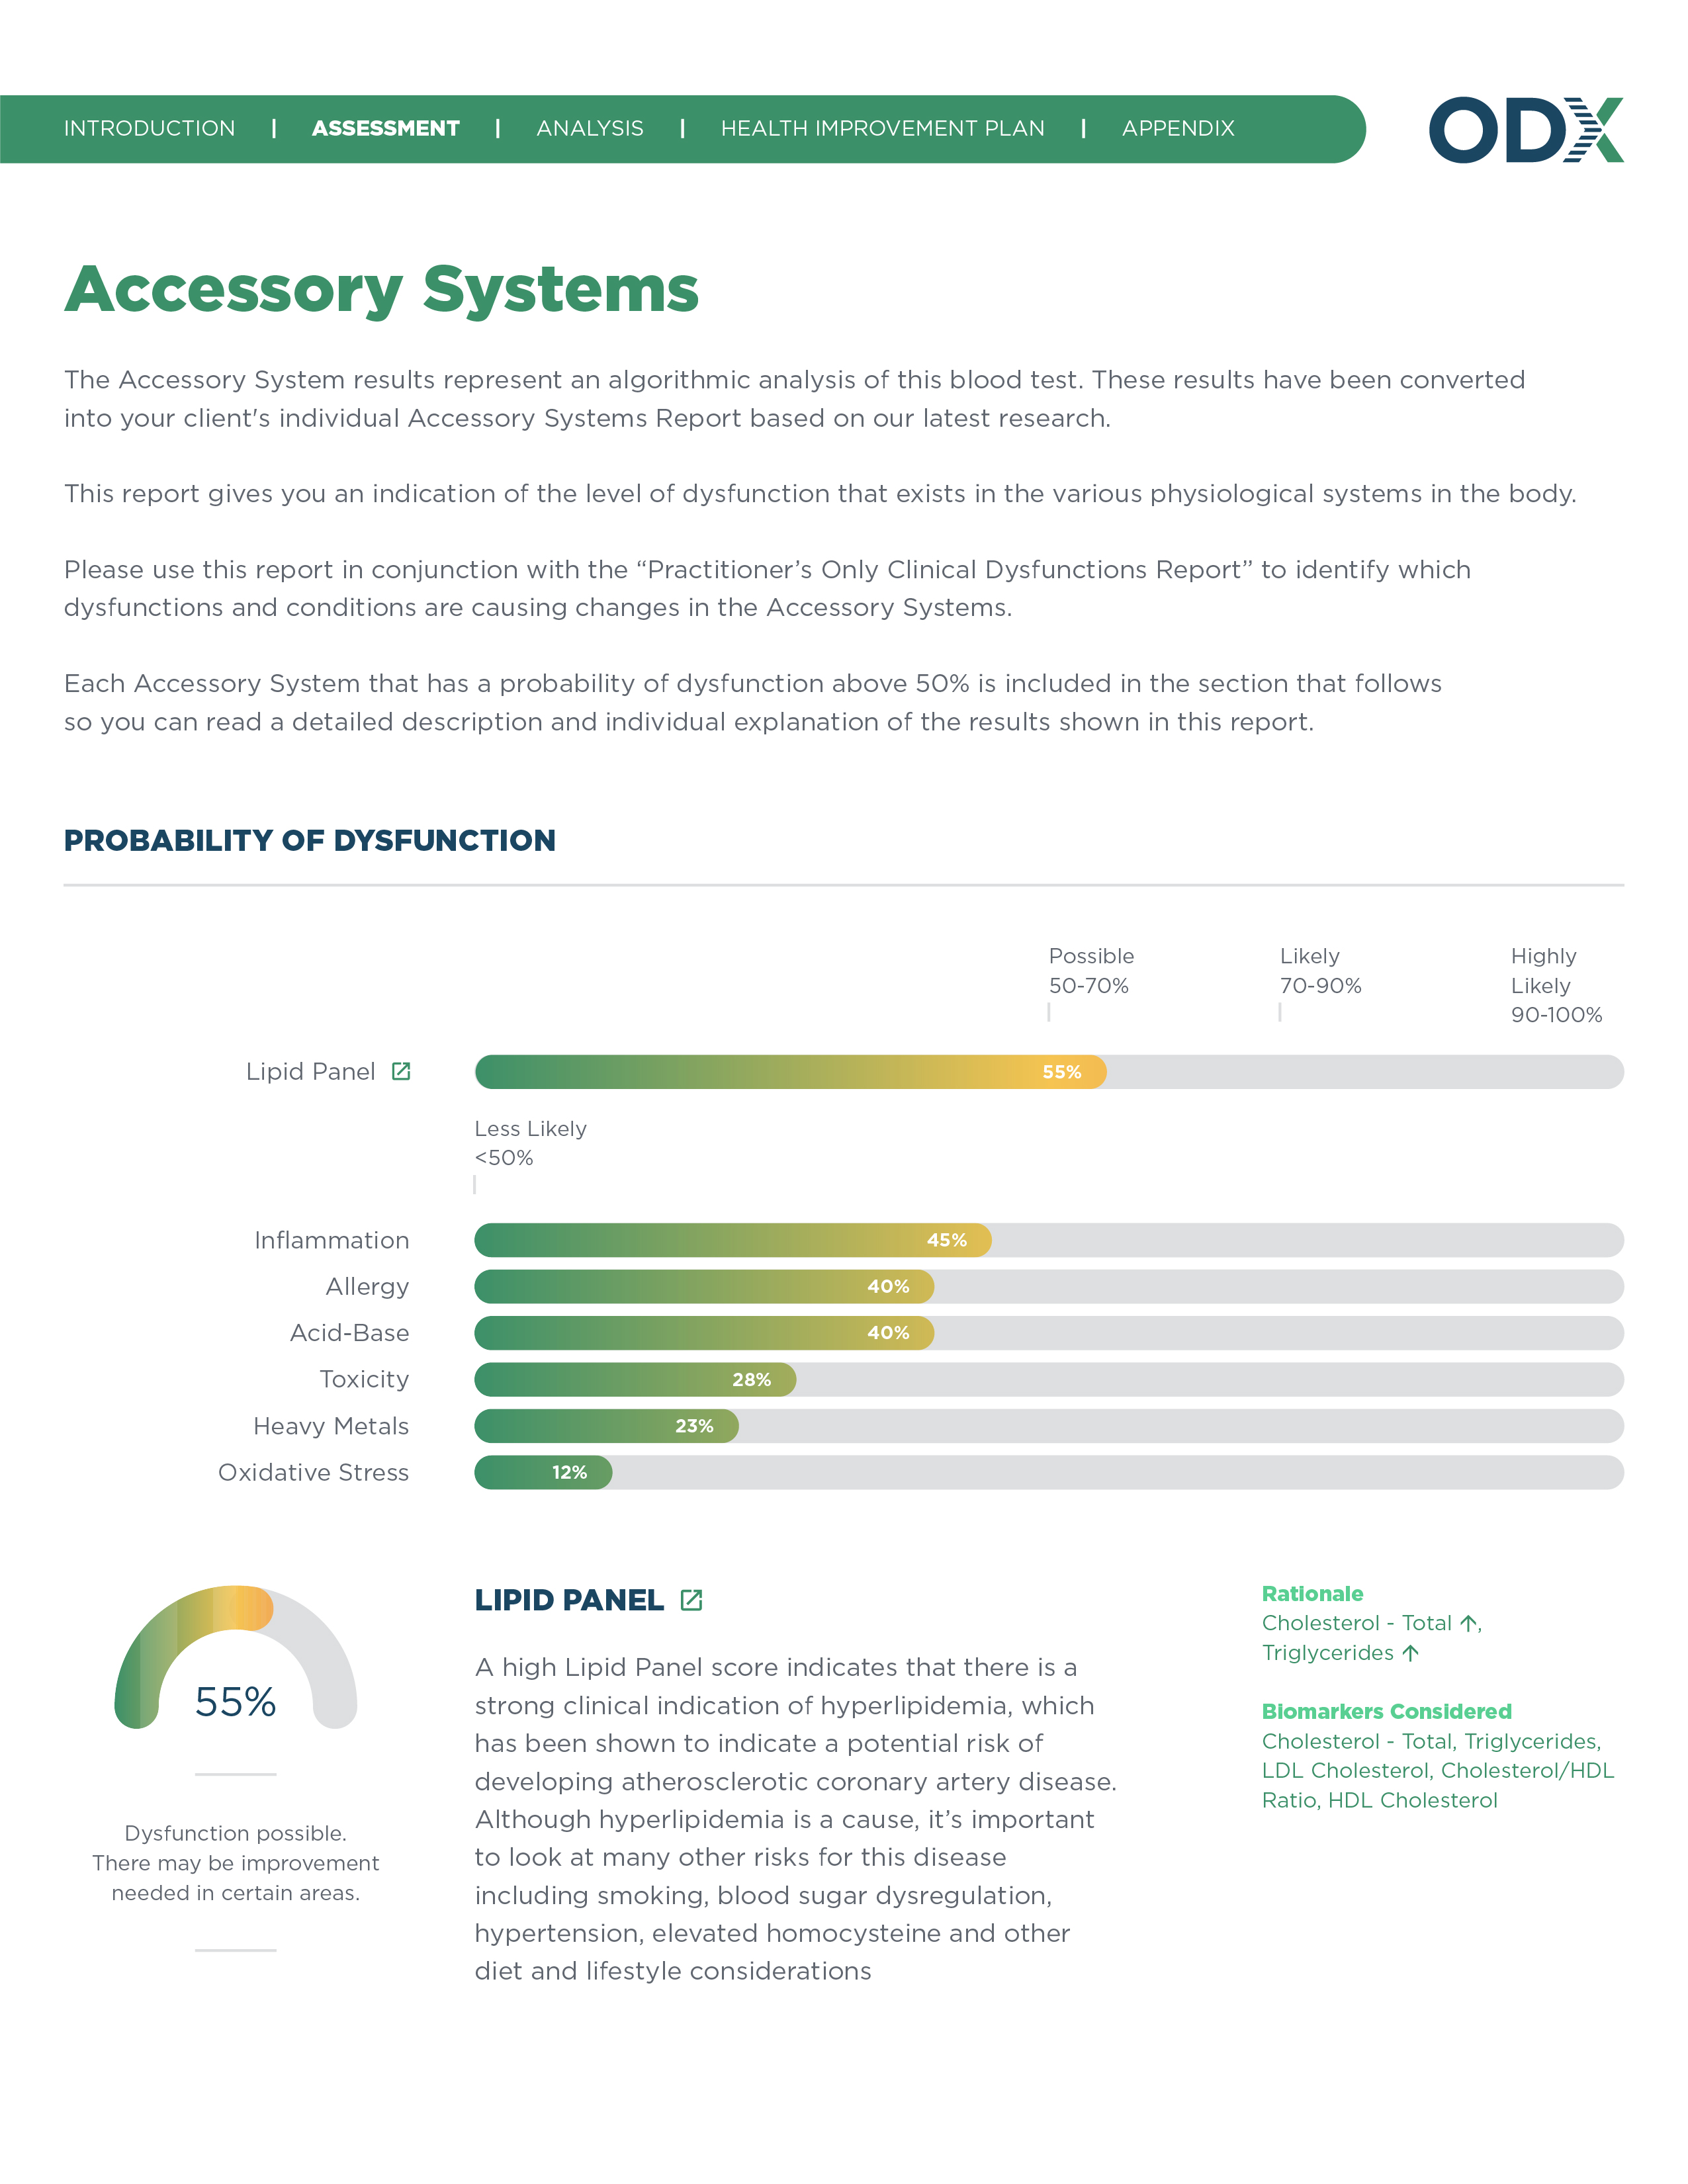
View an algorithmic analysis of the probability of dysfunction for each accessory functional system — such as inflammatory, acid-base and others — based on the data from your patients’ latest blood test results.

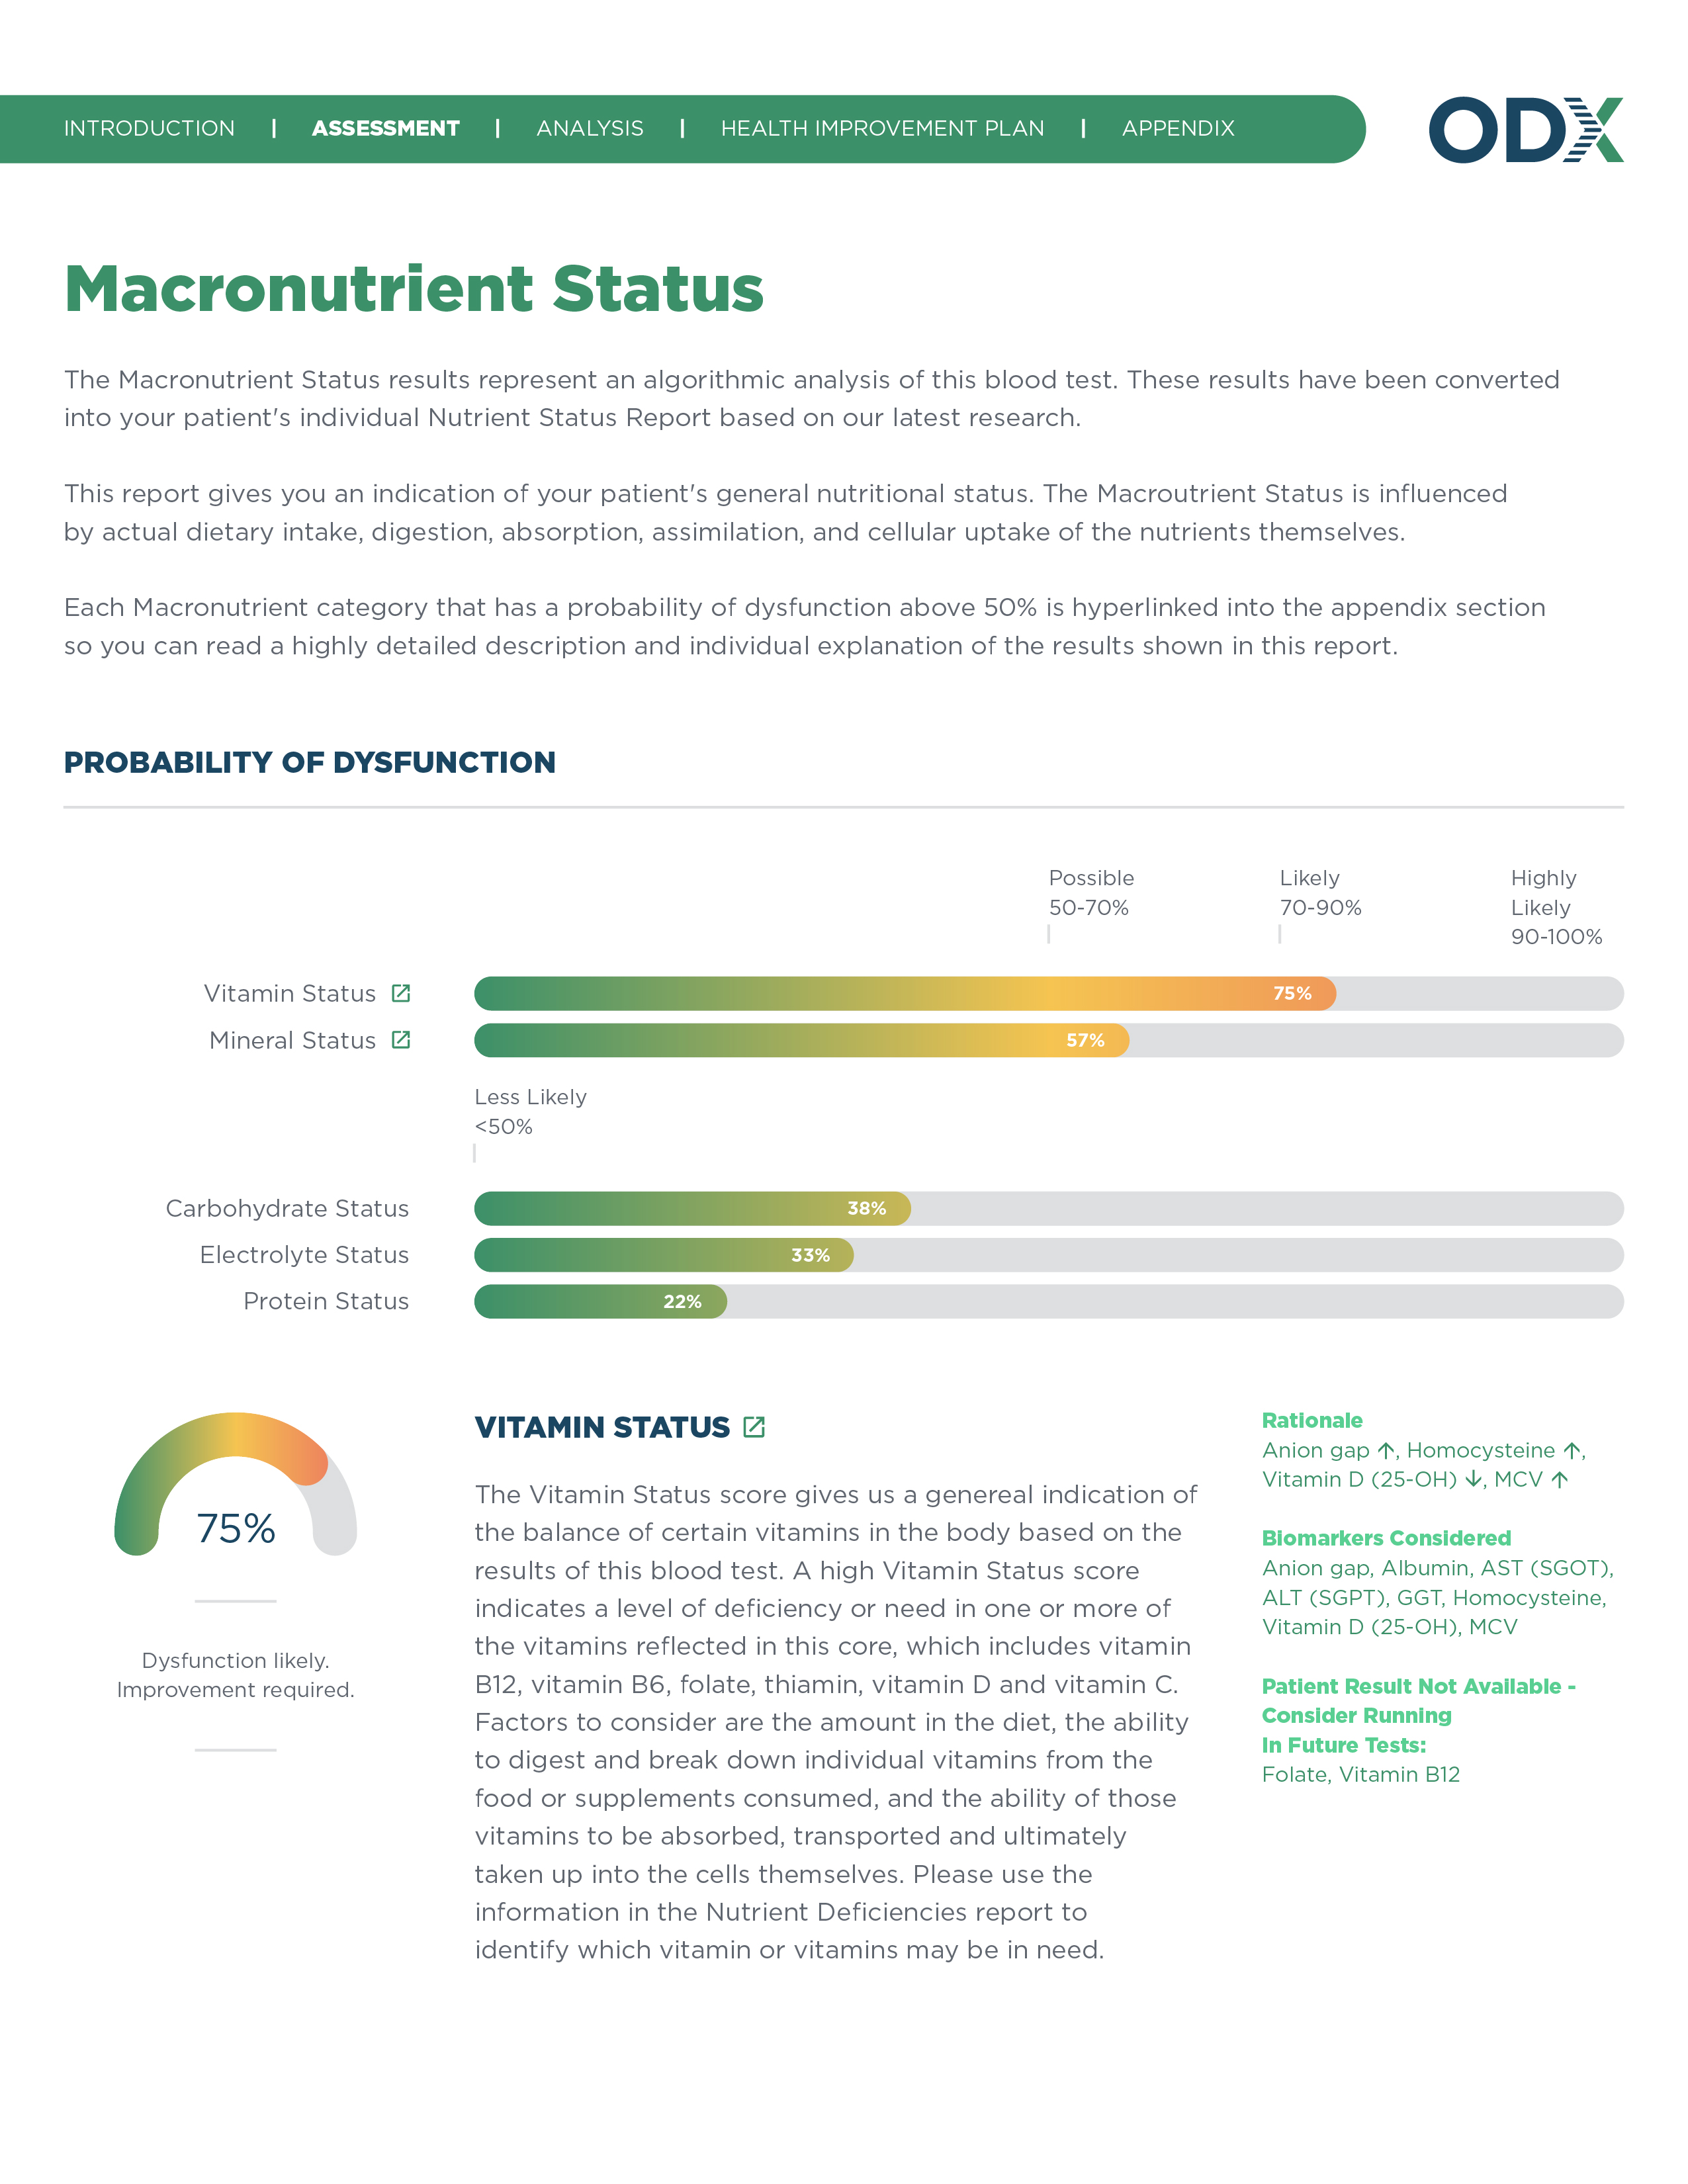
Using the results of your patients’ blood test, see the likelihood of dysfunction based on their overall macronutrient status and their individual dietary domains, like vitamin, mineral and protein intake, digestion, absorption, assimilation and cellular uptake.
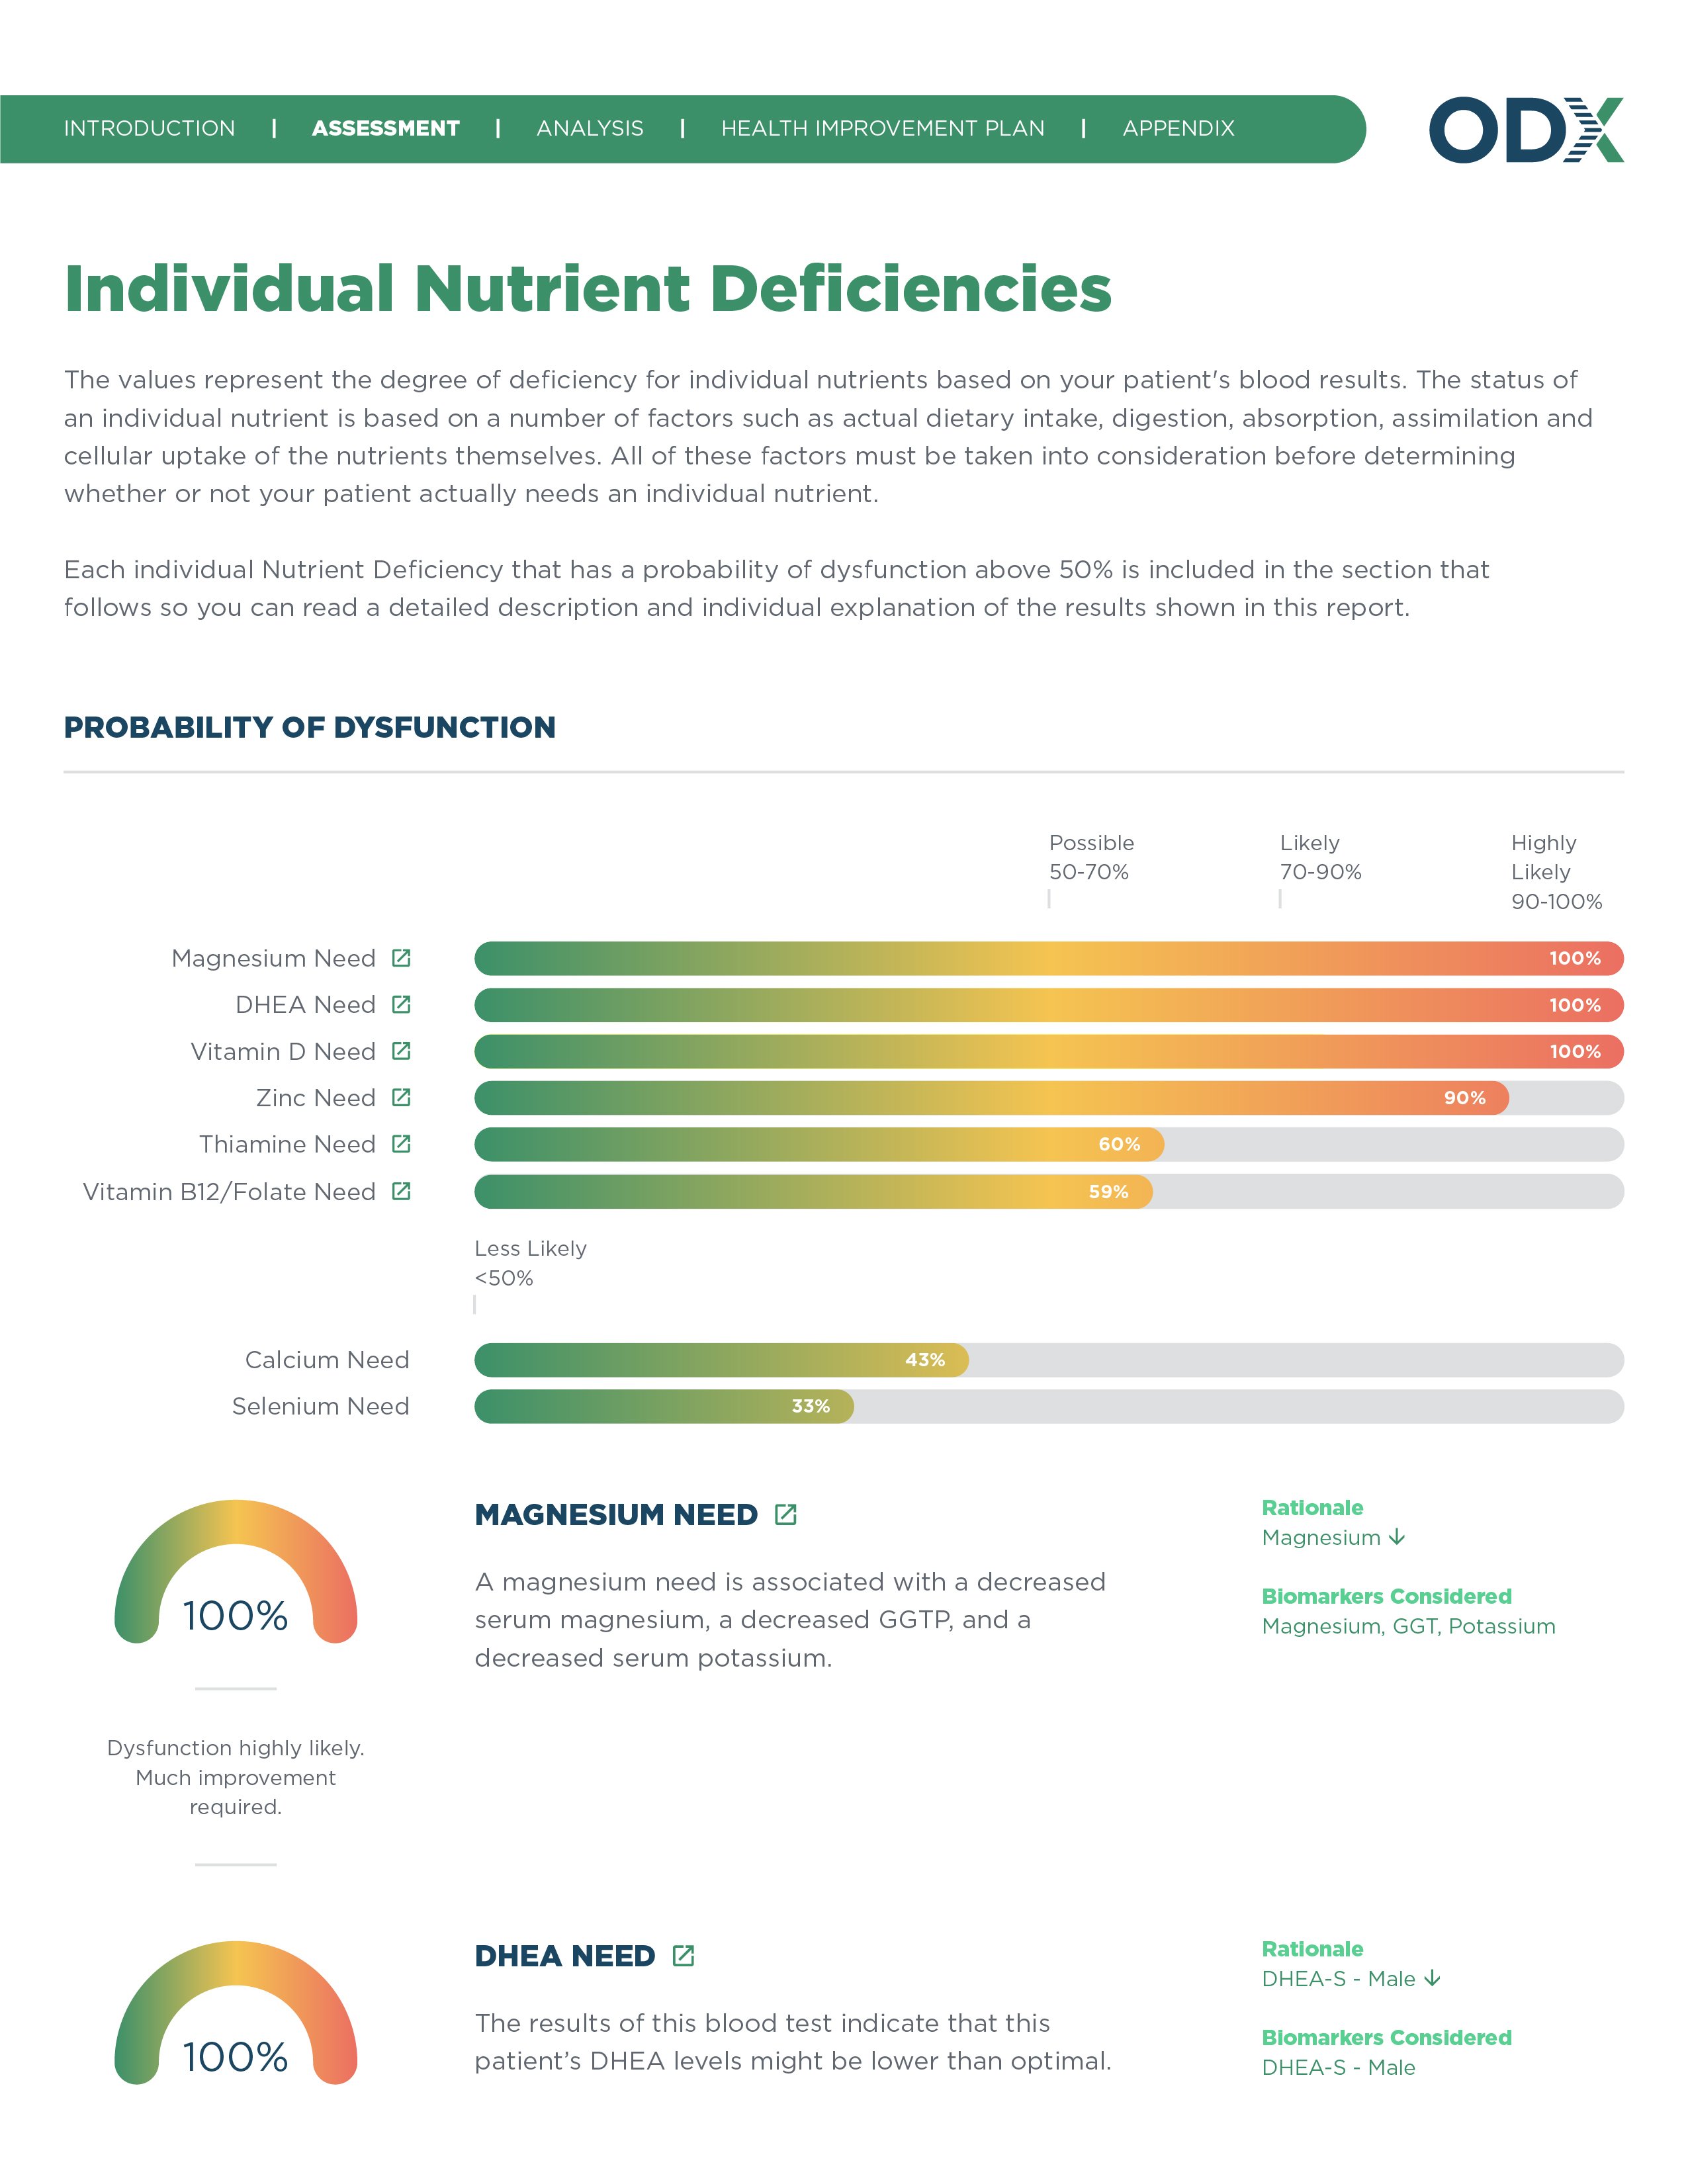
Dive deeper into your patients’ individual nutrient needs to determine whether there is dysfunction related to the intake, digestion, absorption, assimilation and cellular uptake of nutrients based on the blood biomarker levels detected in your patients’ most recent blood test.
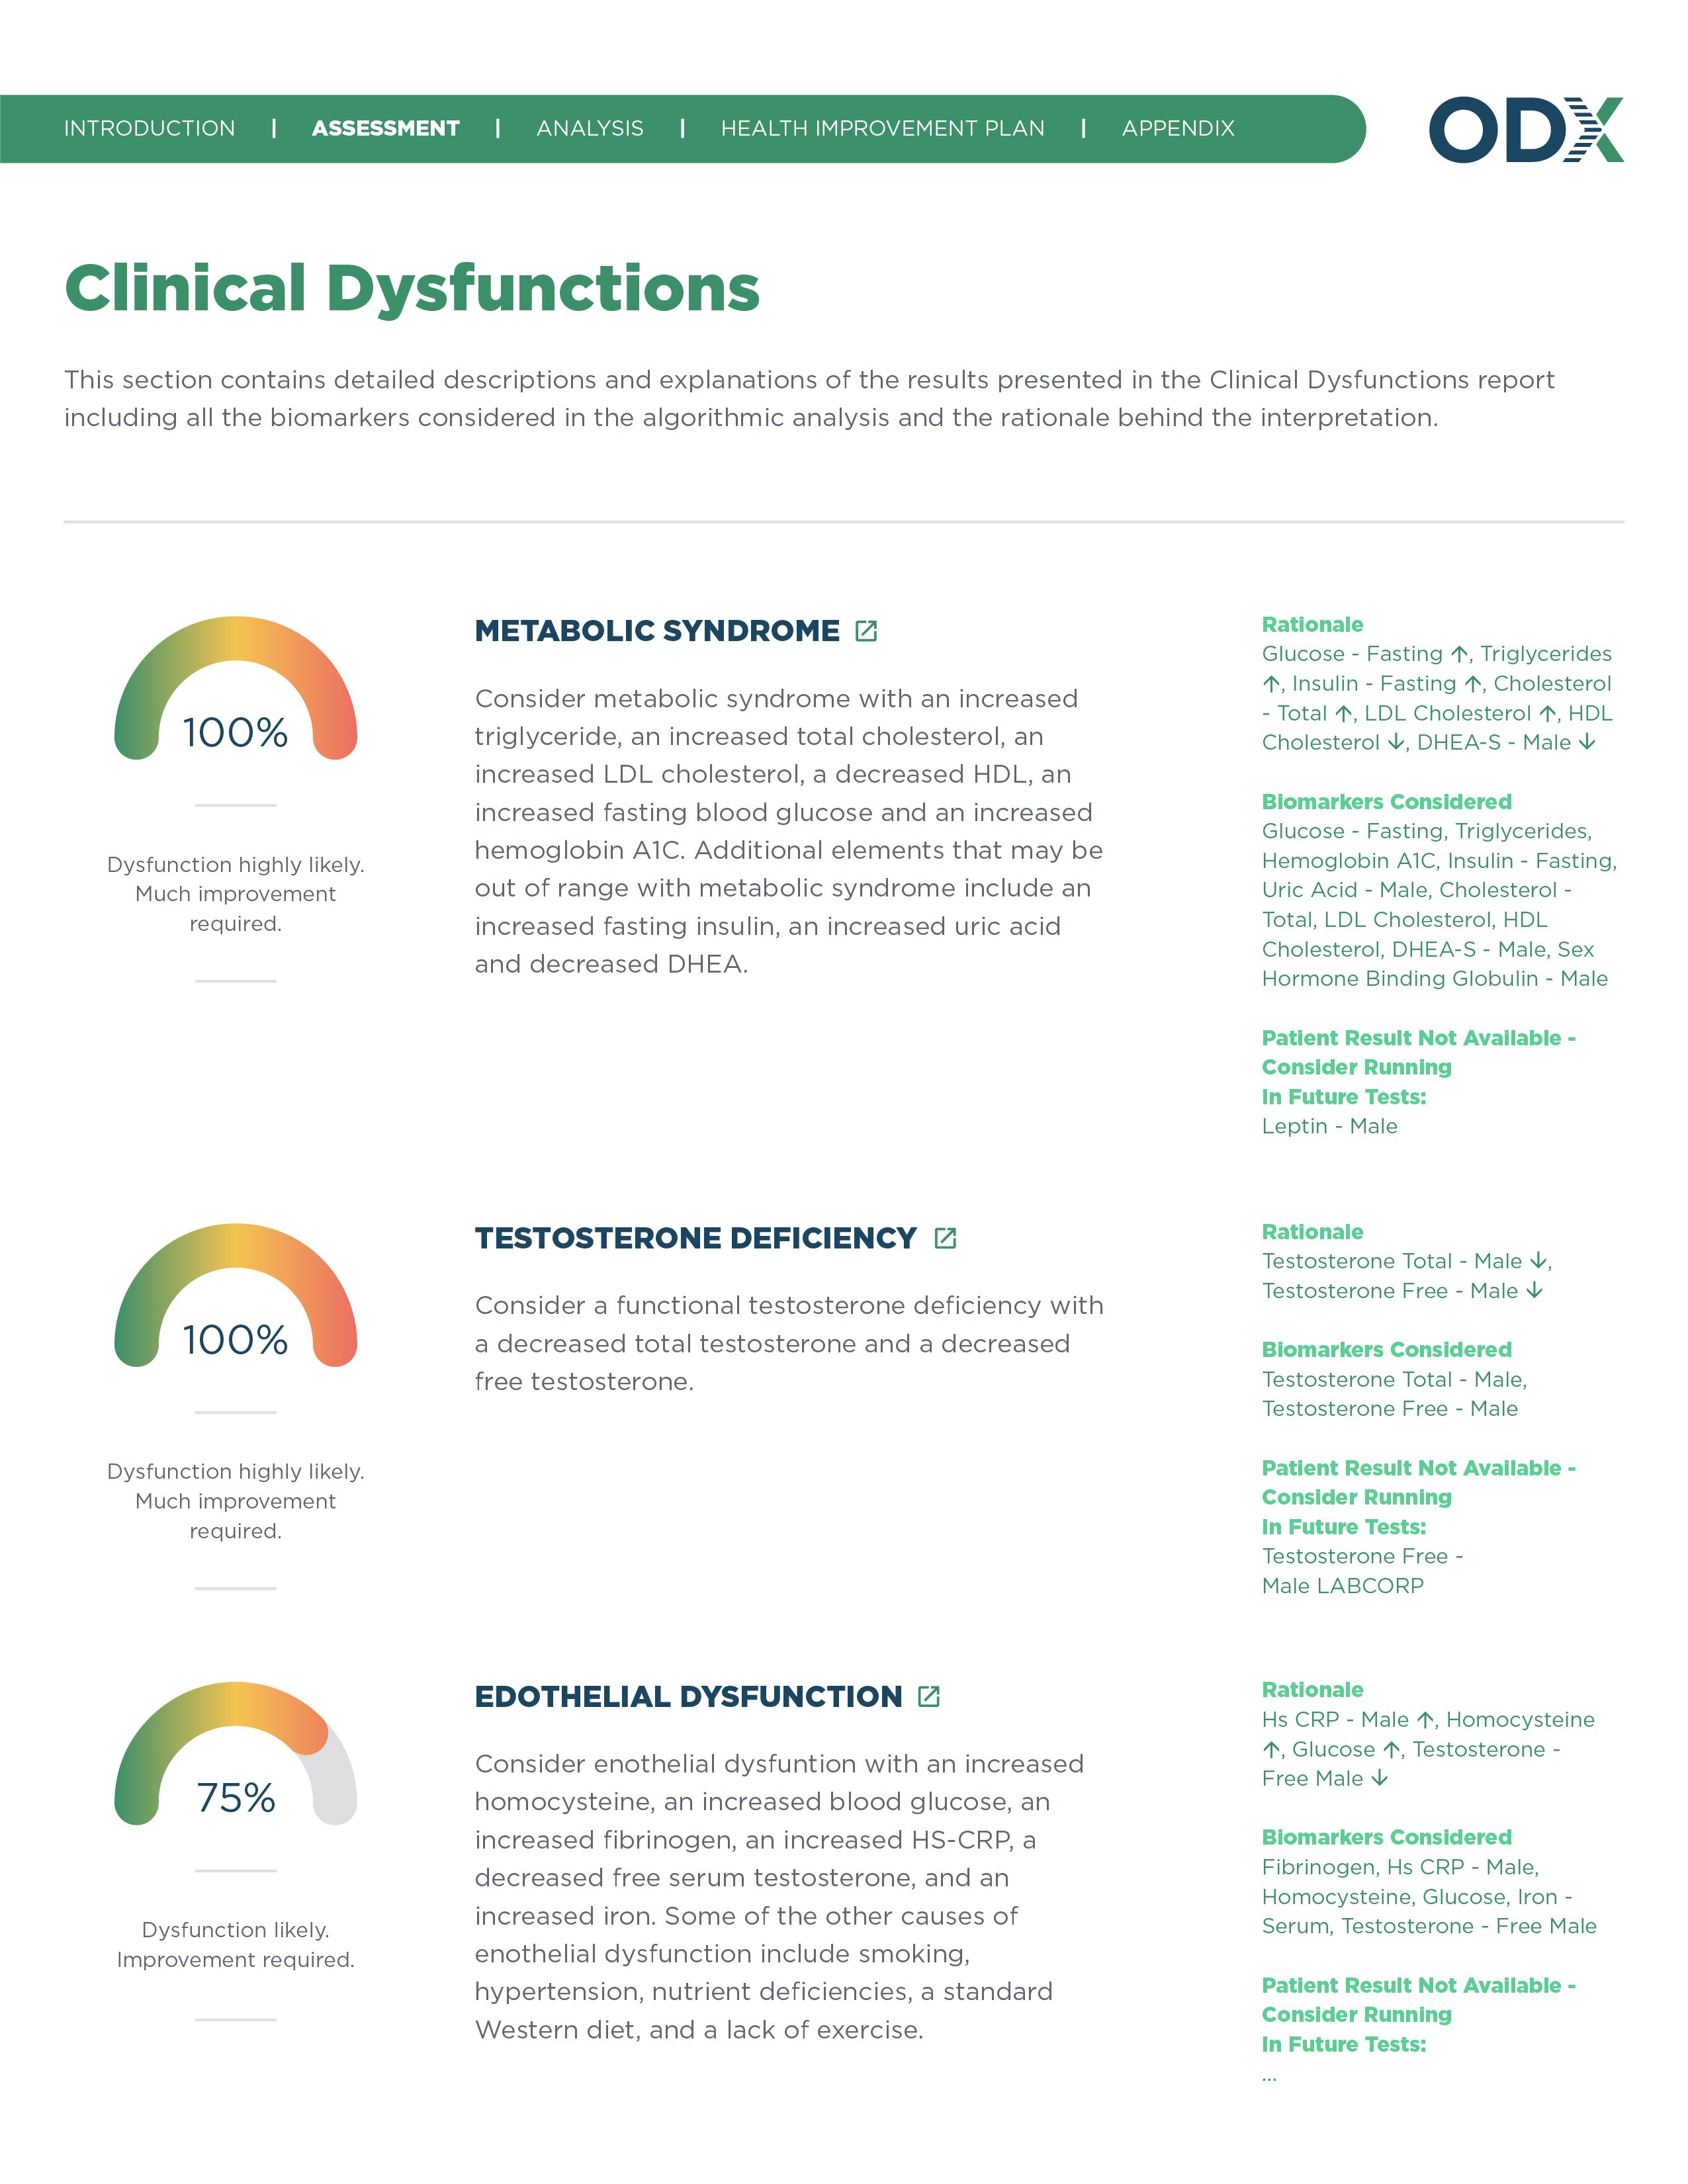
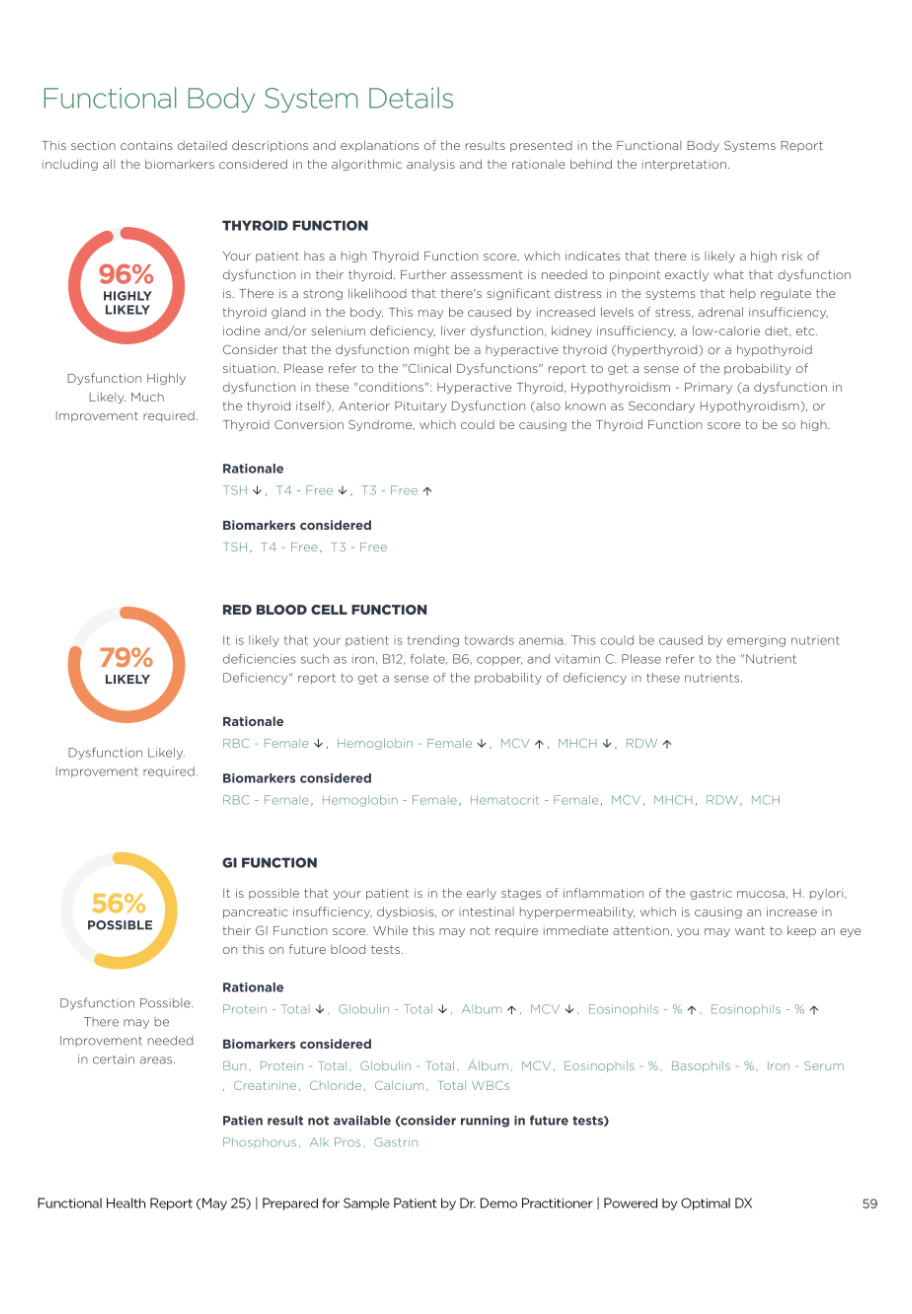
The Clinical Dysfunctions report provides detailed descriptions and explanations of the major areas of concern surfaced by the analysis. It includes all biomarkers involved in the likely dysfunction, the reason why dysfunction is likely with this pattern of biomarkers, and recommended future tests.
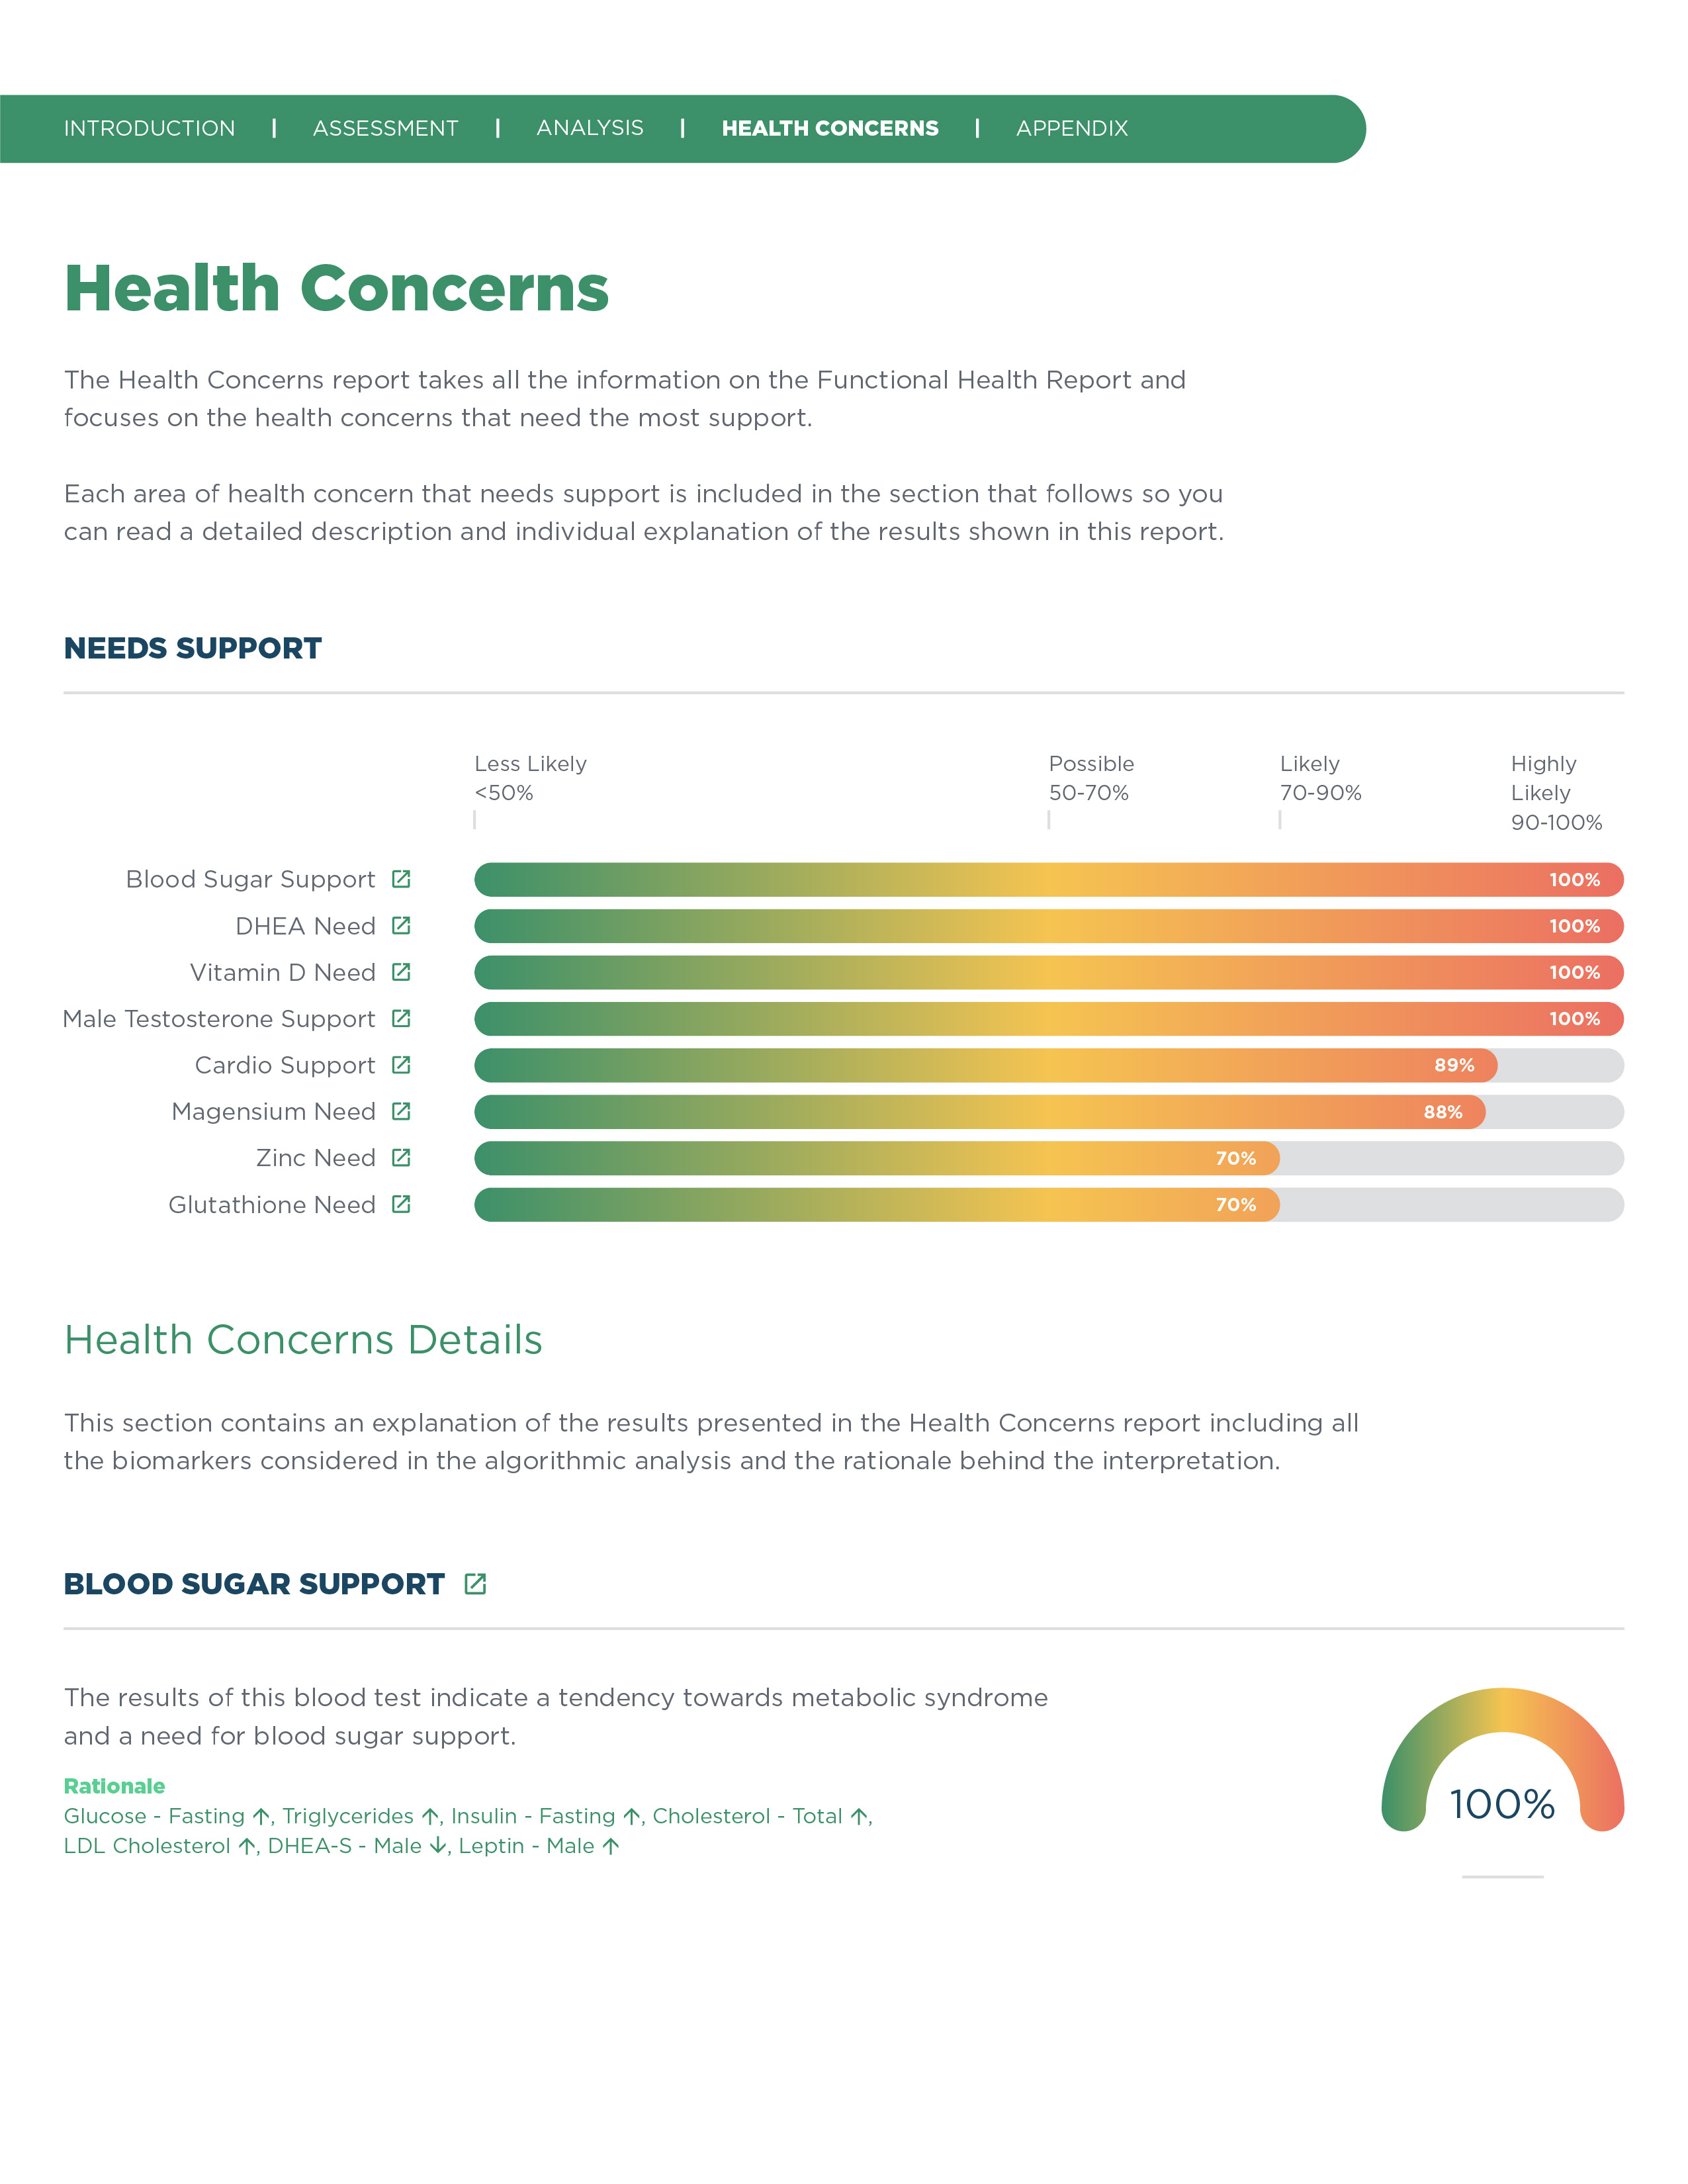
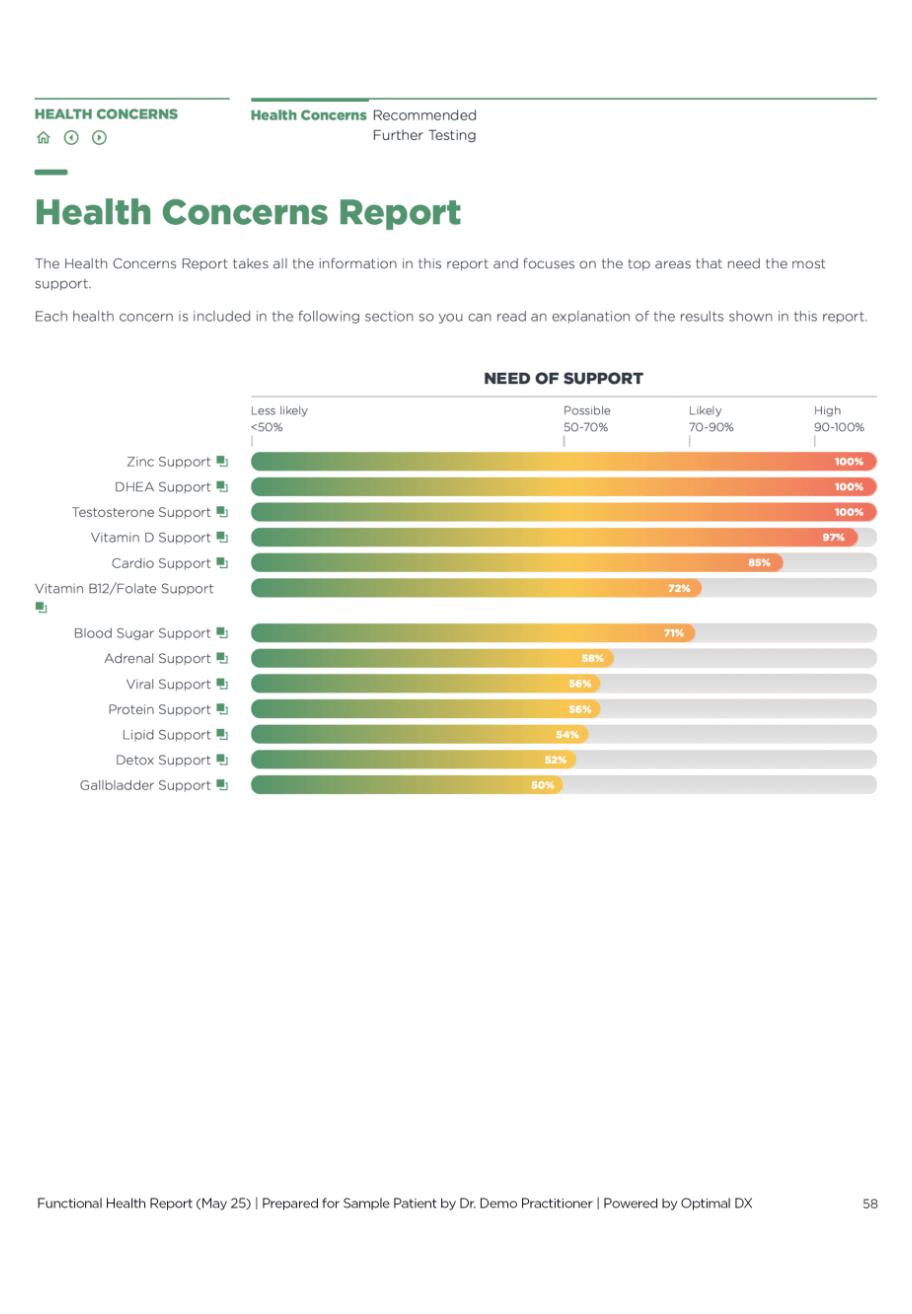
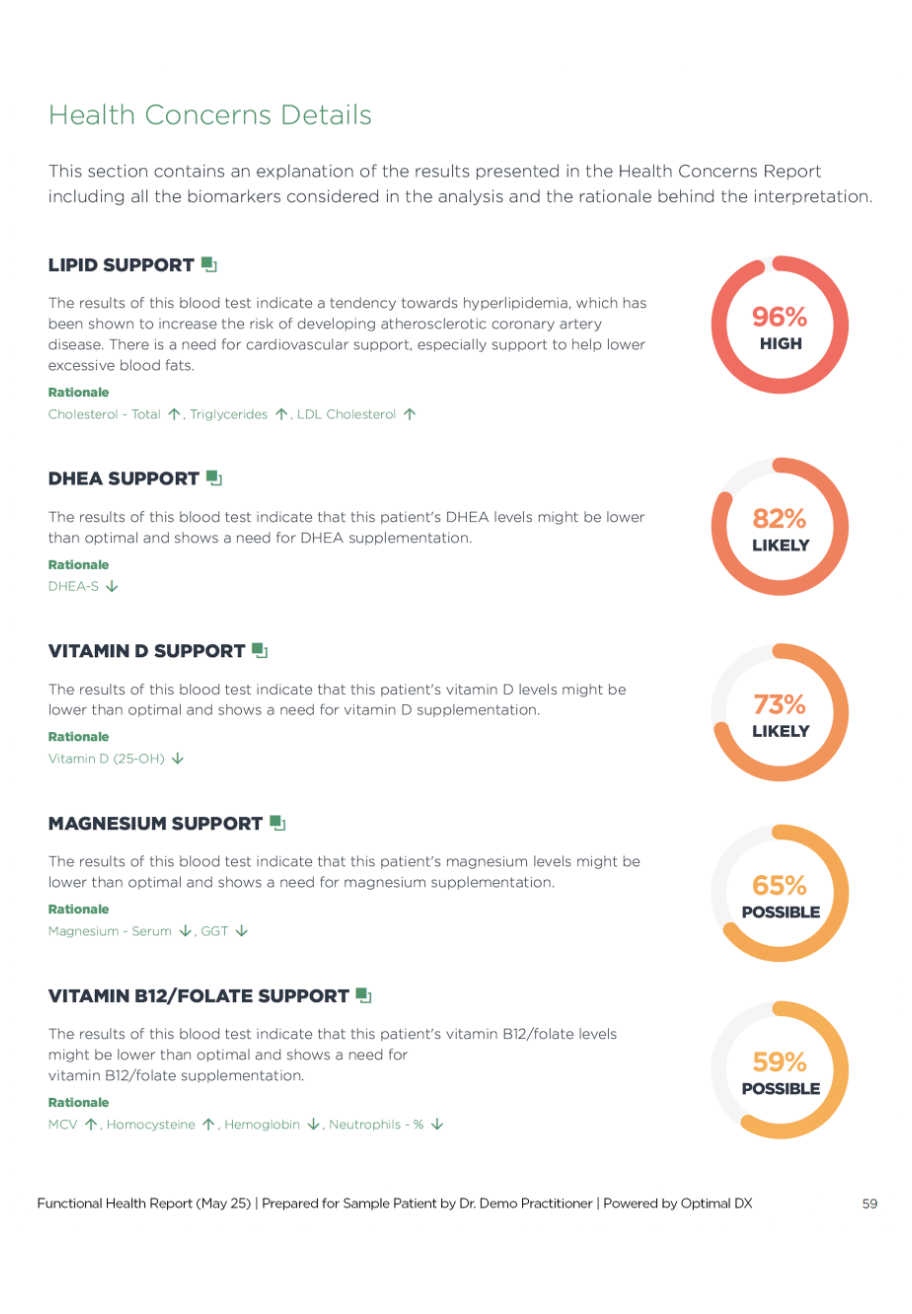
The Health Concerns report gives you an insight into the top areas of concern that need support. Each major area links to a detailed description and individual explanation of why it's an area of concern.
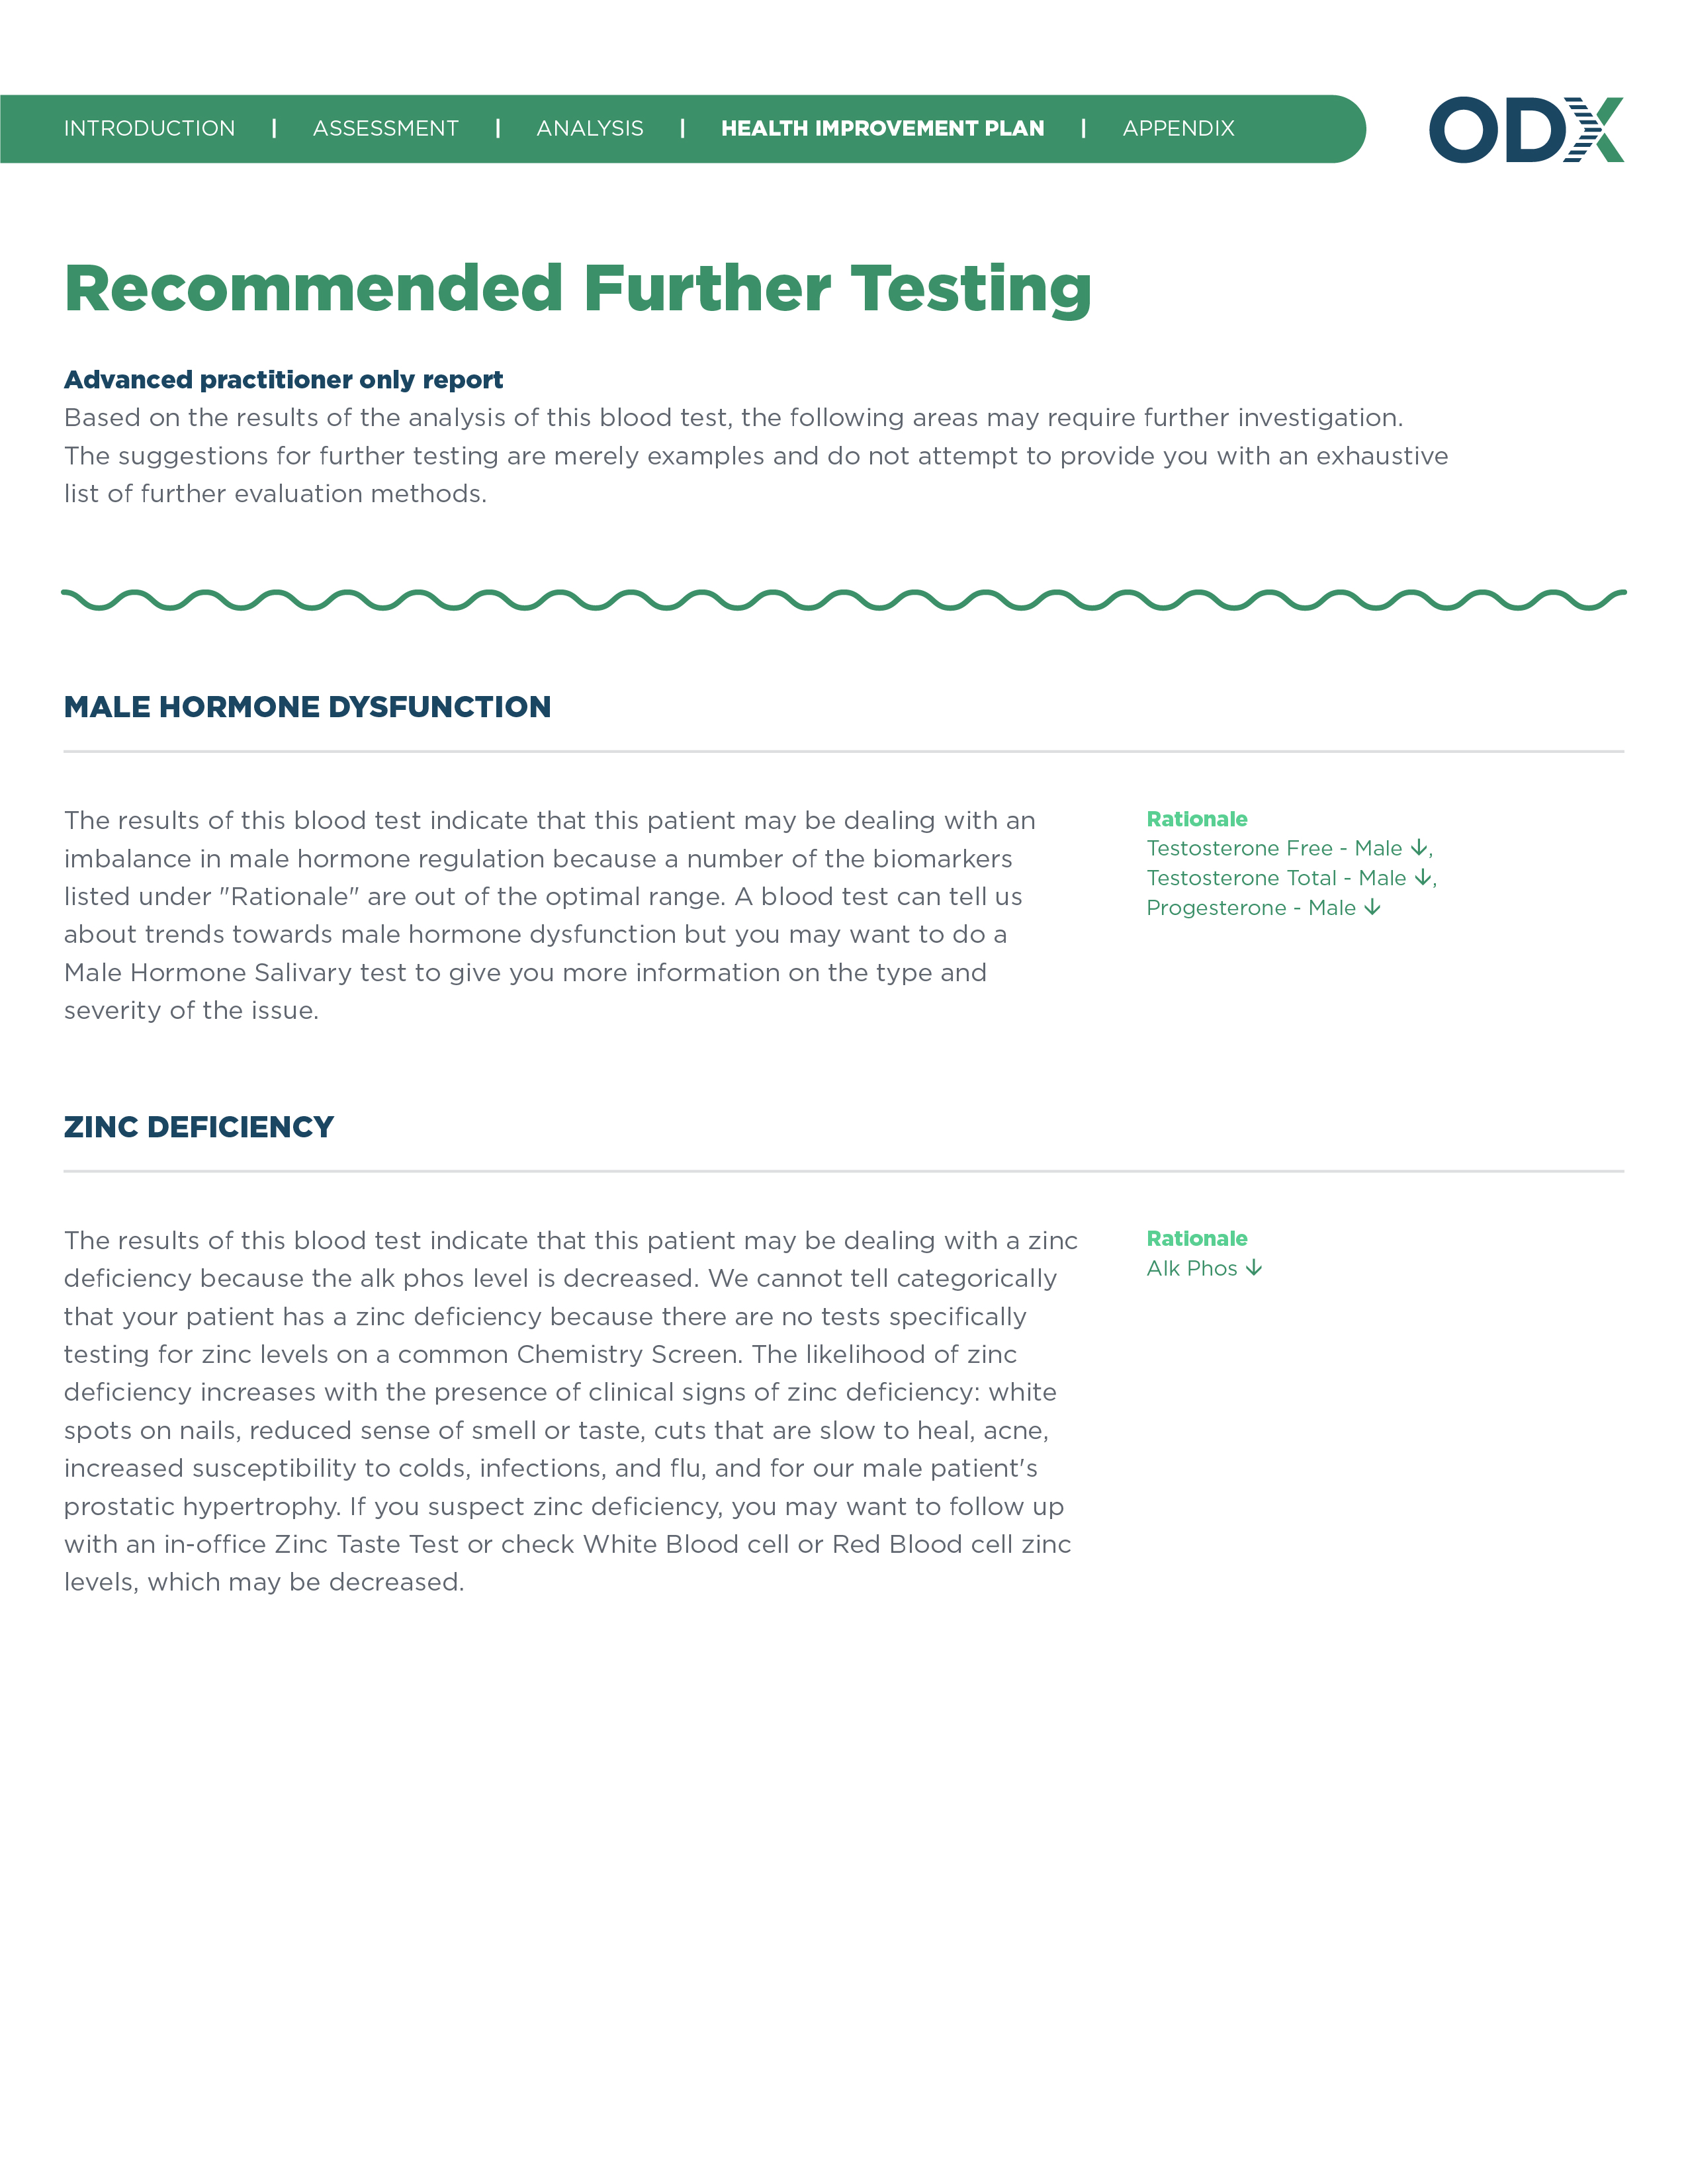
If the Optimal DX Software platform detected any likely areas of dysfunction, this report will automatically suggest areas that could benefit from future lab tests.
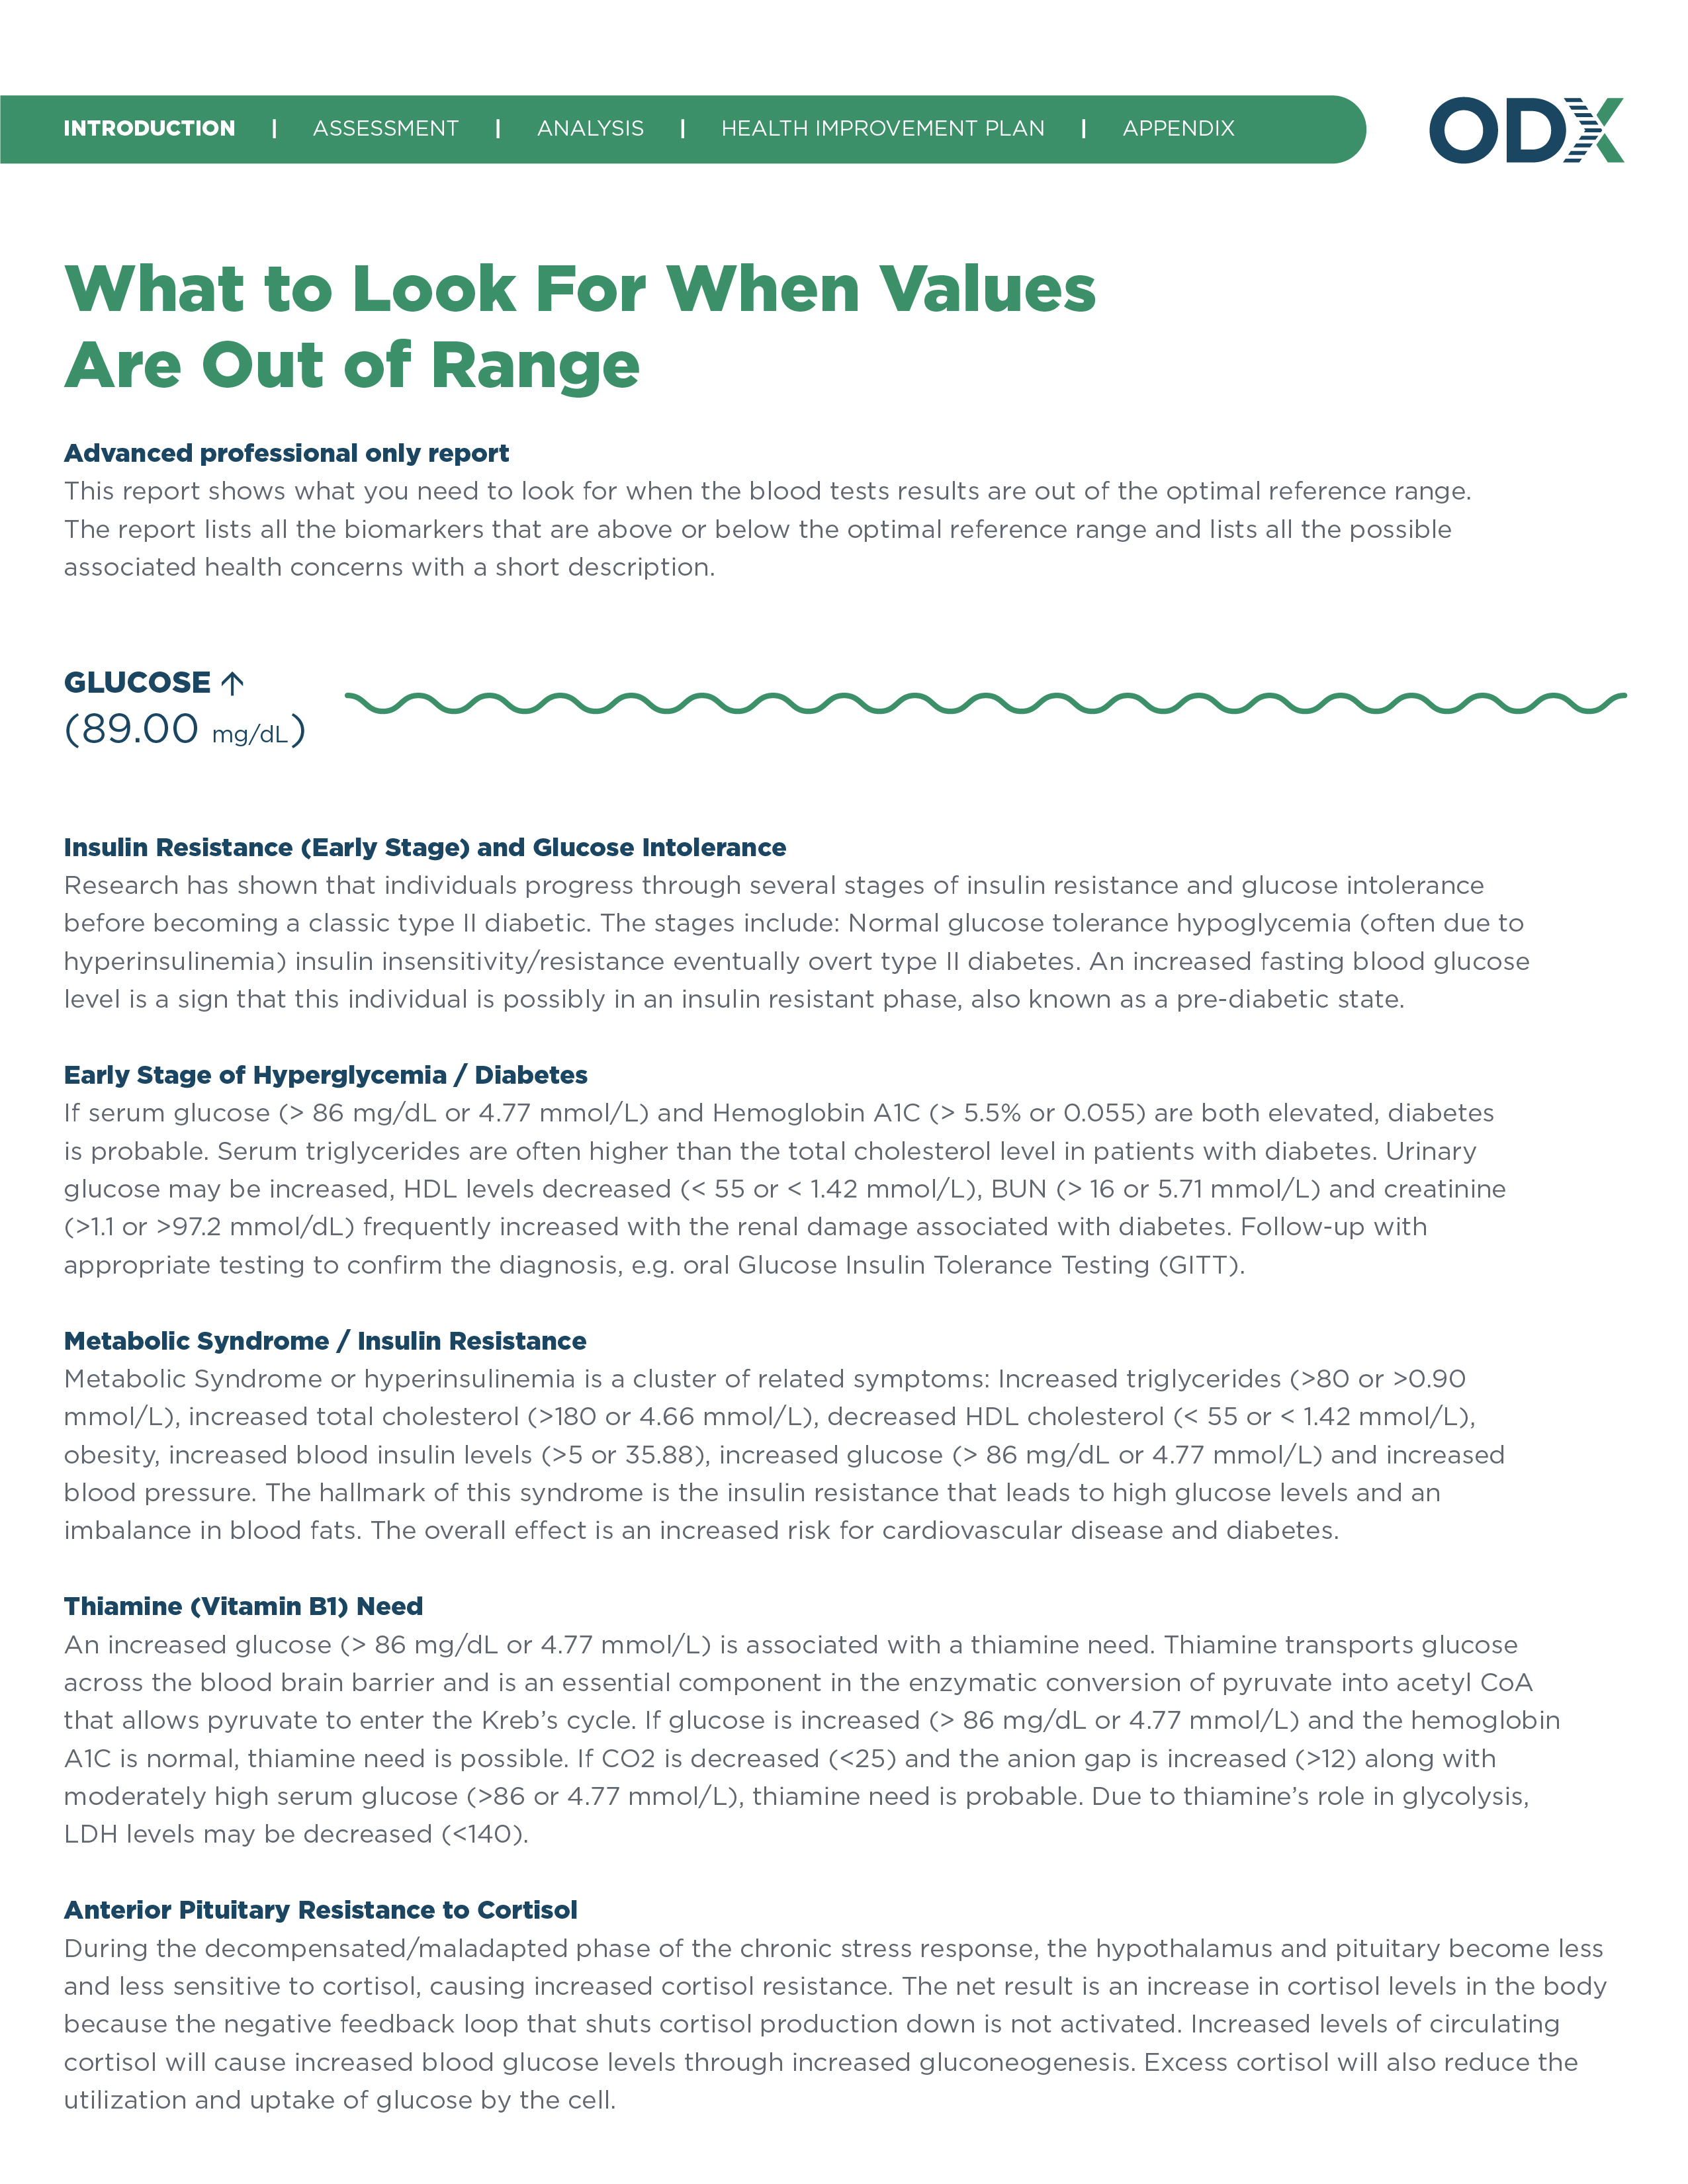
This report calls out important health concerns to watch for when certain biomarkers are out of range. Using it, practitioners can gain an overview of potential issues in their patients at a glance.
White Paper
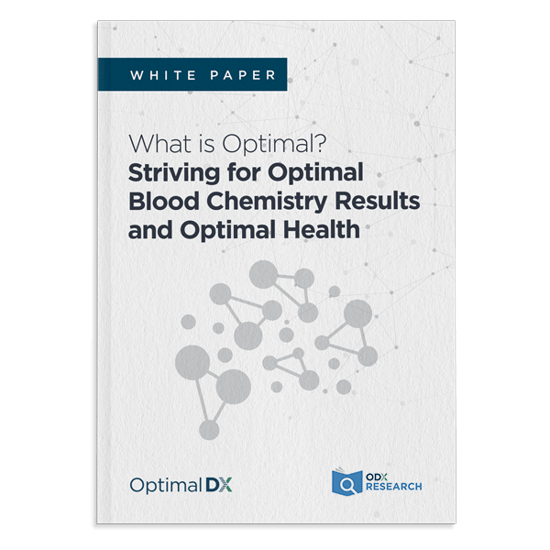
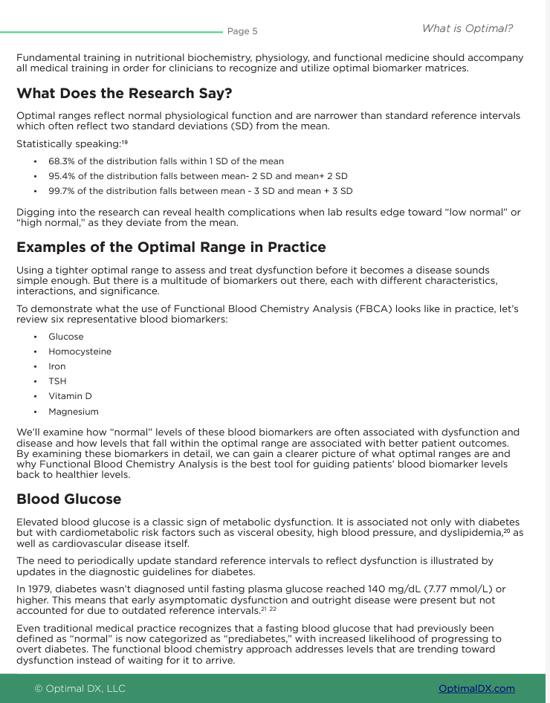
Read our white paper"What Is Optimal - Striving for Optimal Blood Chemistry Results and Optimal Health". At the heart of this whitepaper is a thorough review of the ways standard reference ranges are established and why optimal ranges work better for the Functional Medicine practice. To demonstrate this concept of optimal ranges we review 6 representative biomarkers: Glucose, Homocysteine, Iron, TSH, Vitamin D and Magnesium.
Guide
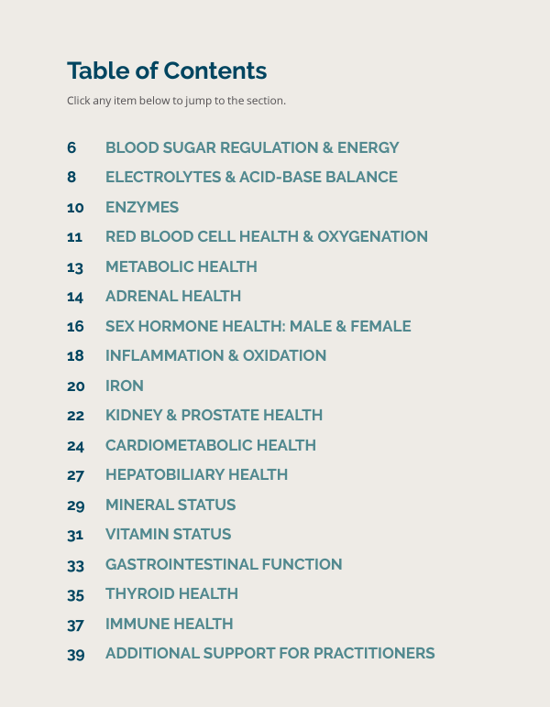
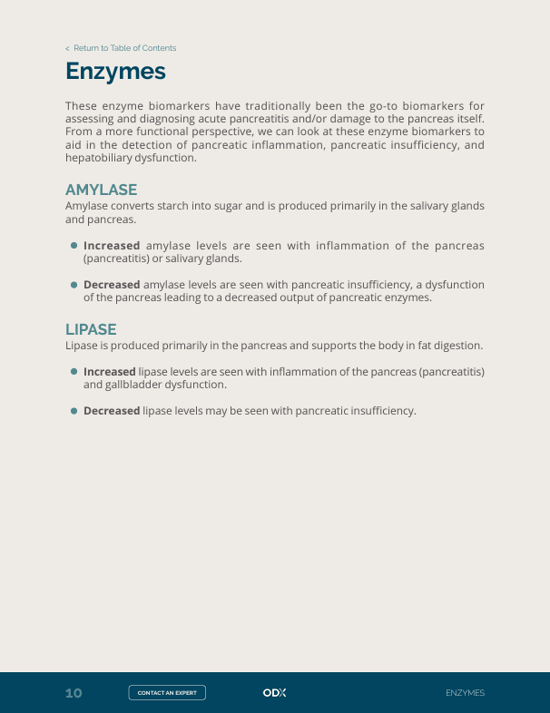
Read Optimal DX's insider guide to blood biomarkers — an informative introduction to Functional Blood Chemistry Analysis, commonly analyzed blood biomarkers and their relationship to dysfunction.
Guide
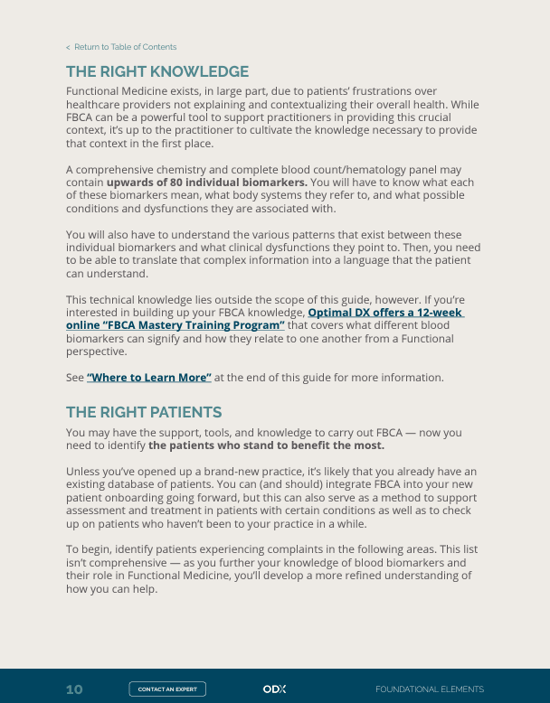
Interested in Functional Blood Chemistry Analysis but don't know how to start? This guide walks you through setting up FBCA in your practice.


White Paper
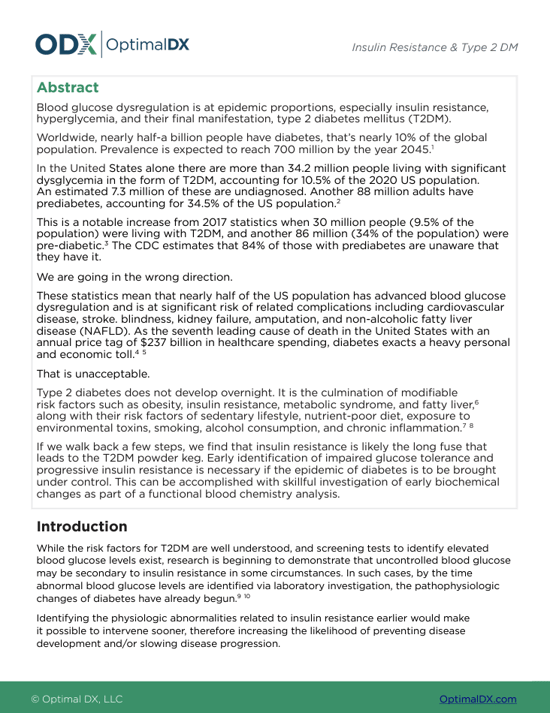
Blood glucose dysregulation is at epidemic proportions, especially insulin resistance. Learn the Functional takeaways to insulin resistance in this white paper.

White Paper
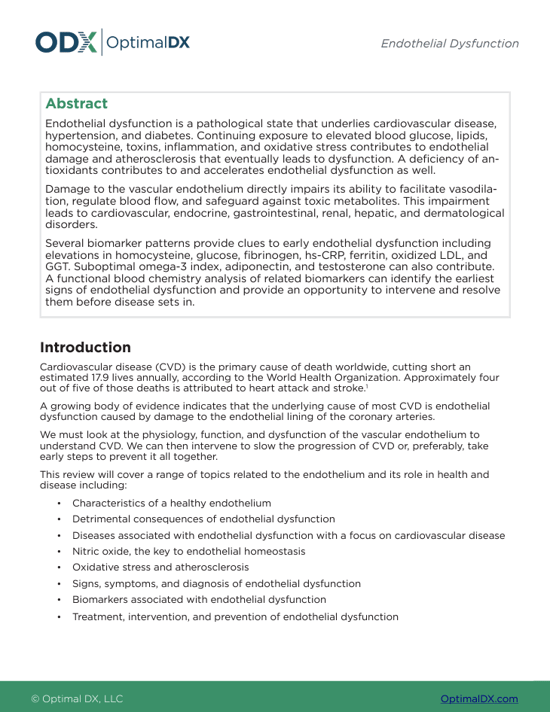
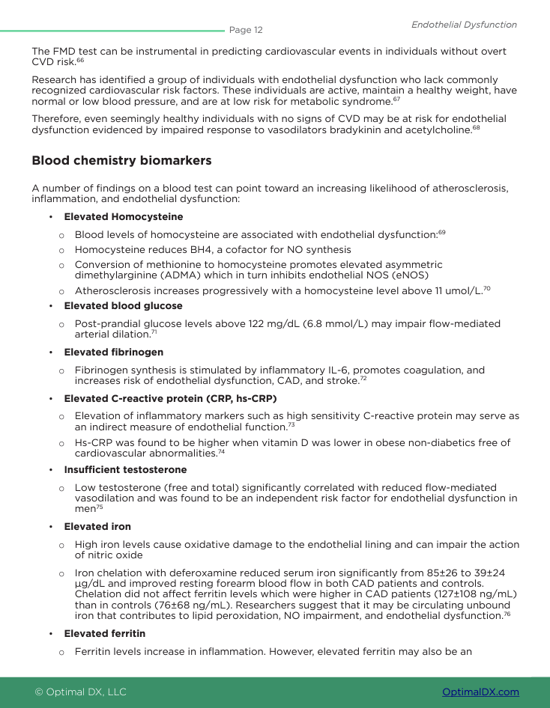
Read our white paperon endothelial dysfunction, a pathological state that underlies many diseases and conditions, and discover how Functional Blood Chemistry Analysis can help.

Want to see the impact Optimal DX Software’s analytical, interpretive, and tracking functionality can have on your practice? Sign up for a free account and find out for yourself.


Our Functional Health Reports interpret the results of your patients’ blood chemistry tests from a functional perspective. But what makes Functional Blood Chemistry Analysis… functional? View our About Blood Chemistry page to find out.




